The annual rate of return on stock is the percentage increase or decrease in the value of an investment over a one-year period. It encompasses capital gains—the increase in the stock's price—and any dividends received, providing a standardized metric to evaluate performance and compare different assets within a portfolio.
As we navigate the financial landscape of 2026, the annual rate of return remains the most critical barometer for individual and institutional investors alike. Whether you are managing a retirement account or day-trading emerging tech equities, understanding how to calculate, interpret, and project these returns is fundamental to long-term solvency. While a stock's price might fluctuate daily, the annual rate of return smooths these variations into a digestible figure that reflects the actual growth of your capital over a fixed timeframe.
Defining the Annual Rate of Return
To understand the annual rate of return, one must first distinguish it from "total return" and "cumulative return." While cumulative return tells you how much an investment has grown since you bought it—potentially over several years—the annual rate of return breaks that performance down into a yearly average.
In the context of the stock market, this metric is often referred to as the annualized return. This is a geometric average that shows what an investor would have earned each year if the annual return were compounded. It is a more accurate representation than a simple arithmetic mean because it accounts for the effects of compounding, which is the process where the value of an investment increases because the earnings on an investment, both capital gains and interest, earn interest as time passes.
The Role of Capital Gains and Dividends
A common mistake among novice investors is focusing solely on the stock price. However, the true annual rate of return must include dividends. Many established companies in the S&P 500 or the Dow Jones Industrial Average pay out a portion of their earnings to shareholders. If a stock's price remains flat for a year but it pays a 4% dividend, your annual rate of return is 4%, not zero. This "total return" perspective is essential for accurately measuring the productivity of your capital.
How to Calculate the Annual Rate of Return
Calculating the return for a single year is straightforward, but calculating the annualized return over multiple years requires a bit more mathematical rigor.
The Simple Annual Return Formula
For a single-year period, the formula is:
Return = ((Ending Price - Beginning Price) + Dividends) / Beginning Price
For example, if you purchased a share of a company on January 1, 2025, for $100 and its price on January 1, 2026, is $110, and you received $2 in dividends during that year:
- Capital Gain: $10
- Dividends: $2
- Total Gain: $12
- Return: $12 / $100 = 0.12 or 12%
The Compound Annual Growth Rate (CAGR)
When an investment spans several years, we use the CAGR formula to find the annual rate of return. This is necessary because market returns are volatile; a stock might go up 20% one year and down 10% the next.
CAGR = [(Ending Value / Beginning Value)^(1 / Number of Years)] - 1
Suppose you invested $10,000 in a tech stock in 2023, and by 2026, your investment is worth $15,000.
- Ending Value: $15,000
- Beginning Value: $10,000
- Number of Years: 3
- Calculation: ($15,000 / $10,000)^(1/3) - 1 = (1.5)^0.333 - 1 ≈ 0.1447 or 14.47%
This result tells you that your investment grew by an average of 14.47% each year, compounded, over that three-year period.
Real vs. Nominal Rates of Return
In the economic climate of 2026, investors must be acutely aware of the difference between nominal and real returns. The nominal return is the percentage increase in the dollar amount of your investment. The real return is the nominal return minus the rate of inflation.
Inflation erodes purchasing power. If your stock portfolio returns 8% in 2026, but the inflation rate (as measured by the Consumer Price Index) is 3%, your real rate of return is only 5%. This distinction is vital for long-term planning, especially for retirement, where the goal is to ensure that your future wealth can buy the same amount of goods and services as your current wealth.
For official data on historical and current inflation rates to assist in your "real return" calculations, refer to the U.S. Bureau of Labor Statistics (BLS).
Historical Benchmarks: What is a "Good" Return?
To judge whether your stock’s annual rate of return is successful, you need a benchmark. Historically, the U.S. stock market, represented by the S&P 500, has returned an average of approximately 10% annually before inflation over long periods (20 to 30 years).
However, this average is rarely achieved in any single year. The market is prone to "fat tails"—years of extreme gains or significant losses. In 2026, professional analysts often look at the 10-year rolling average to determine if a stock is outperforming its sector or the broader market.
Comparison of Asset Class Returns (2026 Projections)
The following table provides a generalized comparison of annualized returns across different asset classes, based on historical data and current 2026 market trends.
| Asset Class | Typical Annual Return Range | Risk Level | Primary Growth Driver |
|---|---|---|---|
| S&P 500 (Large Cap Stocks) | 8% – 12% | Moderate/High | Corporate Earnings & Economic Growth |
| Nasdaq 100 (Tech Stocks) | 12% – 18% | High | Innovation & Scalability |
| Corporate Bonds | 4% – 6% | Low/Moderate | Interest Payments (Yield) |
| U.S. Treasury Bills | 3% – 5% | Very Low | Government Backing/Fed Rates |
| Real Estate (REITs) | 7% – 10% | Moderate | Rental Income & Property Appreciation |
| Savings Accounts/CDs | 2% – 4% | Minimum | Central Bank Interest Rates |
Note: These figures are averages and can fluctuate significantly based on geopolitical events and monetary policy.
Factors That Influence Annual Rates of Return
Multiple internal and external variables dictate why one stock might return 25% while another in the same industry loses 5%.
1. Macroeconomic Environment
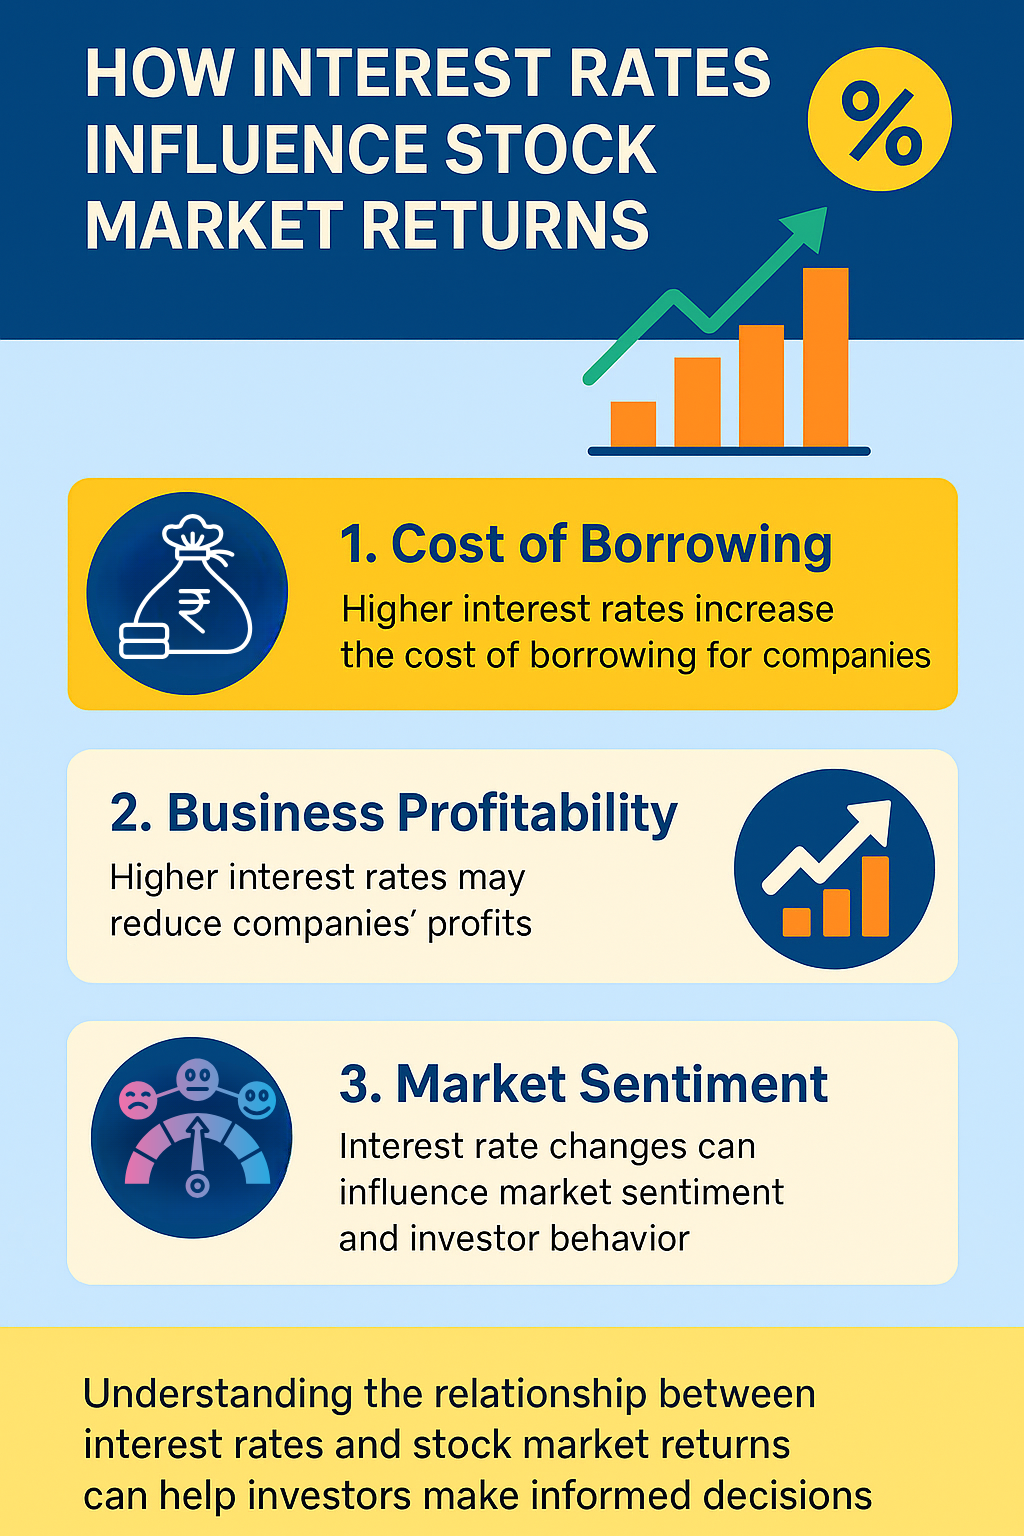
Interest rates set by the Federal Reserve are perhaps the most significant external factor. When interest rates rise, borrowing becomes more expensive for companies, potentially lowering their earnings. Furthermore, higher rates make "safe" investments like bonds more attractive, which can lead investors to pull money out of stocks, driving prices down.
2. Company Earnings and Guidance
At the micro-level, a company’s quarterly earnings reports are the primary catalyst for price changes. If a company consistently beats analyst expectations and provides "positive guidance" (predicting higher future profits), its annual rate of return is likely to be high. Conversely, stagnant growth or shrinking margins will lead to negative returns.
3. Market Sentiment and Volatility
The stock market is driven by human emotion as much as by math. In the short term (under one year), sentiment, news cycles, and geopolitical stability can cause a stock's annual return to deviate wildly from its intrinsic value.
4. Fees and Expenses
Your "net" annual rate of return is what truly matters. If you are trading through a broker that charges high commissions, or if you are invested in an actively managed mutual fund with a high expense ratio (e.g., 1.5%), that cost comes directly out of your annual return. In 2026, with the prevalence of zero-commission trading, investors should aim to keep their total investment costs below 0.25% annually.
Common Pitfalls in Evaluating Returns
The "Recency Bias"
Investors often fall into the trap of looking at the previous year's spectacular return (e.g., 30%) and assuming that the stock will continue at that pace. In finance, this is known as the "hot hand fallacy." Often, a year of exceptionally high returns is followed by a period of "mean reversion," where the return drops back toward the long-term average.
Ignoring Taxes
Unless your stocks are held in a tax-advantaged account like a 401(k) or an IRA, you must pay taxes on your gains. Short-term capital gains (on stocks held for less than a year) are taxed at your ordinary income rate, while long-term gains are taxed at a lower rate (0%, 15%, or 20% in the U.S.). To calculate your true "spendable" annual rate of return, you must factor in these liabilities. For current tax bracket information, the IRS website remains the definitive source.
Arithmetic vs. Geometric Mean
If a stock drops 50% in Year 1 and gains 50% in Year 2, your arithmetic average return is 0% ((-50 + 50) / 2). However, your actual wealth has decreased. If you started with $100, you dropped to $50, and then gained 50% of $50 ($25), leaving you with $75. Your geometric mean (CAGR) would correctly show a negative return. Always use CAGR for multi-year analysis.
Risk-Adjusted Returns: The Sharpe Ratio
A high annual rate of return is only impressive if it wasn't achieved by taking excessive risk. In 2026, sophisticated investors use the Sharpe Ratio to evaluate return. This ratio subtracts the "risk-free" rate (like the return on a Treasury bond) from the stock's return and divides the result by the stock's standard deviation (a measure of volatility).
A stock with a 15% return and massive price swings might actually be a worse investment than a stock with a 10% return that grows steadily. The latter has a better risk-adjusted return, meaning you "earned" more for every unit of stress or risk you endured.
The Impact of Reinvesting Dividends
One of the most powerful ways to boost your annual rate of return over time is through a Dividend Reinvestment Plan (DRIP). Instead of taking dividend payments as cash, you use them to buy more shares of the stock.
Over a 20-year period, the difference between "price return" and "total return with dividends reinvested" is staggering. Compounding works exponentially; as you acquire more shares through reinvestment, you receive more dividends, which in turn buy even more shares. This creates a snowball effect that significantly raises your effective annual rate of return compared to an investor who spends their dividends.
Frequently Asked Questions
What is a realistic annual rate of return on a stock portfolio?
For a diversified portfolio of stocks, a realistic long-term expectation is 7% to 10% annually. While some years may see returns of 20% or more, these are typically offset by years of flat or negative growth. In 2026, many analysts suggest a slightly more conservative outlook of 6% to 8% due to higher global valuations.
Does the annual rate of return include the money I added to the account?
No. When calculating your rate of return, you must exclude new deposits or withdrawals. The return should only reflect the performance of the capital already in the market. Most modern brokerage platforms use a "time-weighted return" to automatically account for these cash flows and show you the actual performance of your investments.
How often should I check my annual rate of return?
While it is important to stay informed, checking your returns daily or even weekly can lead to "emotional trading." Most financial advisors recommend a quarterly or annual review. This provides enough data to see if your investment thesis is still valid without reacting to the "noise" of short-term market volatility.
Is a high annual rate of return always better?
Not necessarily. A very high return often indicates high risk. If a stock returns 50% in a year, it may be due to a speculative bubble or a high-leverage strategy that could just as easily result in a 50% loss the following year. Context—such as the company's debt levels and industry stability—is vital.
How do I compare my stock's return to the S&P 500?
You can find the "Total Return" of the S&P 500 for any given year on major financial news sites or through the S&P Dow Jones Indices website. Compare your stock's CAGR for the same period against the index's CAGR to see if you are "beating the market."
Practical Recommendation
To maximize your annual rate of return while managing risk in 2026, focus on Total Return rather than just price movement. Ensure you are accounting for inflation, taxes, and investment fees, as these "hidden" costs can easily turn a 10% nominal return into a 4% real return.
For most individual investors, the most reliable path to a high annual rate of return is not through picking individual "winner" stocks, but through low-cost index funds that capture the growth of the entire market. If you do choose individual stocks, prioritize companies with a history of dividend growth and strong "moats"—competitive advantages that protect their earnings through various economic cycles. Regularly rebalance your portfolio to ensure that a single high-performing stock doesn't over-concentrate your risk.