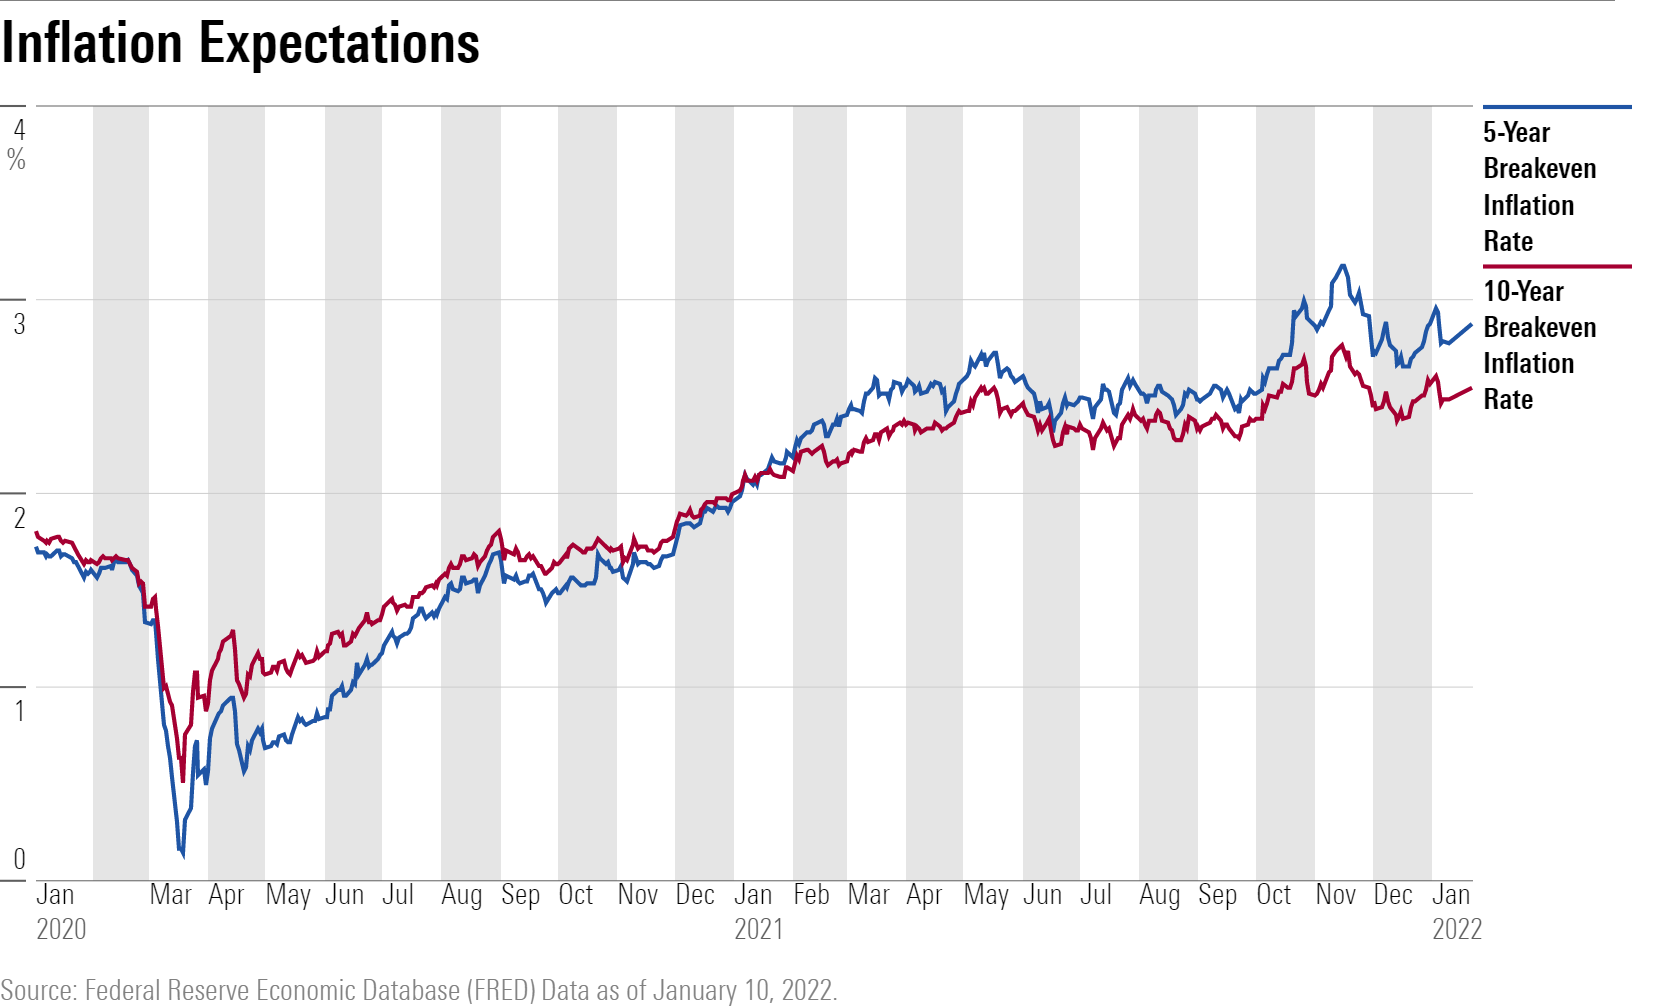
The annual inflation rate in the United States measures the percentage change in the Consumer Price Index (CPI) over a 12-month period, reflecting the pace at which the purchasing power of the US dollar declines. Historically, these rates have fluctuated from the double-digit "Great Inflation" of the late 1970s to the ultra-low levels of the 2010s and the significant post-pandemic surge seen in the early 2020s.
Inflation is a fundamental economic indicator that influences everything from the interest rates on your mortgage to the cost of a gallon of milk. For policymakers at the Federal Reserve, investors in the stock market, and everyday households, understanding the historical trajectory of annual inflation rates is essential for long-term financial planning. As of 2026, the US economy continues to navigate the long-term effects of the volatile 2021–2023 period, making a historical perspective more relevant than ever for understanding current fiscal conditions.
How the US Government Measures Annual Inflation
To understand annual inflation rates by year, one must first understand the primary metric used to calculate them: the Consumer Price Index (CPI). Managed by the Bureau of Labor Statistics (BLS), the CPI tracks the change in prices paid by urban consumers for a representative "basket" of goods and services.
The Market Basket of Goods
The BLS "market basket" is a collection of approximately 80,000 items across several categories. These categories are weighted based on how much the average consumer spends on them. The primary components include:
- Housing: Usually the largest component, accounting for over 30% of the index, including rent and owners' equivalent rent.
- Transportation: Costs associated with new and used vehicles, gasoline, and public transit.
- Food and Beverages: Both grocery costs ("food at home") and restaurant prices ("food away from home").
- Medical Care: Costs for prescription drugs, hospital services, and insurance premiums.
- Energy: A volatile but critical component covering electricity and fuel.
CPI-U vs. Core Inflation
When analyzing annual rates, economists often distinguish between Headline Inflation (CPI-U) and Core Inflation. CPI-U measures the price changes for all items in the basket. Core Inflation, however, excludes the food and energy sectors. Because food and energy prices are highly susceptible to external shocks—such as geopolitical conflicts affecting oil prices or weather events affecting crop yields—Core Inflation is often viewed as a more accurate measure of long-term underlying inflation trends.
A Historical Overview of US Inflation Rates (1970–2025)
The history of US inflation is not a steady line but a series of peaks and valleys influenced by war, technological shifts, and monetary policy. By examining the annual rates by year, we can see distinct eras of economic policy.
The Great Inflation Era (1970–1982)
The 1970s represented one of the most challenging periods for the US economy. This decade was defined by "stagflation"—a combination of stagnant economic growth and high inflation. Several factors contributed to this, including the abandonment of the gold standard in 1971 and the oil shocks of 1973 and 1979.
During this time, annual inflation rates frequently climbed above 10%. The peak occurred in 1980, when the annual rate hit a staggering 13.5%. It was only after Federal Reserve Chairman Paul Volcker aggressively raised interest rates to 20% that inflation was finally reigned in, albeit at the cost of a significant recession in the early 1980s.
The Great Moderation (1990–2020)
Following the volatility of the 70s and 80s, the US entered a period often called the "Great Moderation." During these decades, the Federal Reserve successfully maintained a target inflation rate of approximately 2%. This stability was supported by globalization, which lowered the cost of manufactured goods, and technological advancements that increased productivity.
Even during the Great Recession of 2008, inflation remained relatively low, with the US actually experiencing brief periods of deflation (negative inflation) in 2009. From 2010 to 2020, inflation averaged roughly 1.7%, often falling below the Federal Reserve's 2% goal.
The Post-Pandemic Surge (2021–2024)
The decade of stability ended abruptly following the COVID-19 pandemic. A combination of factors led to the highest inflation rates in 40 years:
- Supply Chain Disruptions: Global lockdowns shuttered factories and clogged shipping ports, creating a shortage of goods.
- Fiscal Stimulus: Trillions of dollars in government aid increased household savings and consumer demand.
- Energy Shocks: The 2022 invasion of Ukraine led to a spike in global oil and natural gas prices.
By June 2022, the 12-month inflation rate peaked at 9.1%. In response, the Federal Reserve initiated a series of aggressive interest rate hikes throughout 2022 and 2023 to cool the economy and bring the annual rate back toward the 2% target.
Annual Inflation Rates by Year: 1970 to 2025
The following table provides the average annual inflation rate for each year. These figures represent the percentage change in the CPI-U from the previous year.
| Year | Annual Inflation Rate (%) | Year | Annual Inflation Rate (%) |
|---|---|---|---|
| 1970 | 5.8% | 2000 | 3.4% |
| 1975 | 9.1% | 2005 | 3.4% |
| 1980 | 13.5% | 2010 | 1.6% |
| 1981 | 10.3% | 2015 | 0.1% |
| 1985 | 3.6% | 2018 | 2.4% |
| 1990 | 5.4% | 2019 | 1.8% |
| 1991 | 4.2% | 2020 | 1.2% |
| 1992 | 3.0% | 2021 | 4.7% |
| 1993 | 3.0% | 2022 | 8.0% |
| 1994 | 2.6% | 2023 | 4.1% |
| 1995 | 2.8% | 2024 | 3.1% (est.) |
| 1996 | 2.9% | 2025 | 2.4% (est.) |
Note: Data from 1970-2023 is based on official BLS historical records. 2024-2025 figures are based on consensus economic estimates as of early 2026.
Why High Inflation Matters for Your Finances
Inflation is often described as a "hidden tax" because it erodes the value of money sitting in a bank account. When the annual inflation rate is 3%, a hundred dollars today will only have the purchasing power of $97 next year.
Impact on Savings and Investments
For savers, high inflation is a significant hurdle. If your savings account offers a 1% interest rate but inflation is 4%, you are effectively losing 3% of your wealth each year. This is why investors often turn to assets that historically outpace inflation, such as:
- Equities (Stocks): Companies can often raise prices to match inflation, protecting their profit margins.
- Real Estate: Property values and rents typically increase alongside general price levels.
- Treasury Inflation-Protected Securities (TIPS): These are government bonds specifically designed to increase in value as the CPI rises.
Impact on Borrowing and Debt
Inflation has a complex relationship with debt. For existing borrowers with fixed-rate loans (like a 30-year fixed mortgage), high inflation can actually be beneficial. As wages rise with inflation, the "real" value of the fixed debt decreases, making it easier to pay off. However, for new borrowers, high inflation leads to higher interest rates, as the Federal Reserve raises the federal funds rate to combat rising prices. This makes car loans, mortgages, and credit card balances significantly more expensive.
The Role of the Federal Reserve in Managing Inflation
In the United States, the Federal Reserve has a "dual mandate": to promote maximum employment and maintain stable prices. Since 2012, "stable prices" has been formally defined as a 2% annual inflation rate.
Tools for Controlling Inflation
When the annual inflation rate exceeds the 2% target, the Fed uses "contractionary" monetary policy:
- Raising Interest Rates: By increasing the cost of borrowing, the Fed reduces consumer spending and business investment. This decrease in demand typically causes price growth to slow down.
- Quantitative Tightening: The Fed can reduce the supply of money in the economy by selling off its holdings of government bonds and mortgage-backed securities.
Conversely, if inflation is too low (as seen in the mid-2010s), the Fed may lower interest rates to encourage spending and prevent deflationary spirals, which can be even more damaging to an economy than moderate inflation.
Common Myths About Inflation
To navigate economic news effectively, it is important to debunk several common misconceptions regarding annual inflation rates:
- "Lowering inflation means prices go down." This is a common point of confusion. A decrease in the rate of inflation (e.g., going from 8% to 3%) is called disinflation. It means prices are still rising, just more slowly. For prices to actually drop, the economy must experience deflation, which is rare and often associated with severe economic depressions.
- "Printing money is the only cause of inflation." While an increase in the money supply is a major factor, "cost-push" inflation (rising costs of raw materials) and "demand-pull" inflation (too much demand for too few goods) are equally important drivers.
- "The government manipulates CPI data." While the methodology for calculating CPI has changed over the decades (such as the introduction of "hedonic adjustments" to account for improvements in product quality), these changes are transparently documented by the BLS. Most independent economists agree that while no index is perfect, the CPI remains a reliable gauge of price trends.
FAQs About US Inflation Rates
What was the highest annual inflation rate in US history?
The highest recorded annual inflation rate in the US occurred in 1917, during World War I, when it reached 17.8%. In the modern era (post-WWII), the peak was in 1980 at 13.5%.
How often is inflation data updated?
The Bureau of Labor Statistics releases the Consumer Price Index (CPI) report monthly, usually during the second week of the month. This report reflects the price changes for the previous month and provides the "trailing 12-month" annual rate that is most commonly cited in the news.
Is a 0% inflation rate the goal for the economy?
No. Most economists believe a small amount of inflation (around 2%) is healthy. It encourages consumers to spend and invest rather than hoarding cash, and it provides a "buffer" against deflation, which can lead to high unemployment and decreased production.
How does US inflation compare to other countries?
While the US experienced high inflation in 2021–2023, many other developed nations (particularly in Europe) saw even higher rates due to their greater dependence on imported natural gas. Historically, the US has maintained lower and more stable inflation rates than many emerging market economies.
What is the difference between CPI and PCE?
While the CPI is the most famous measure, the Federal Reserve actually prefers the Personal Consumption Expenditures (PCE) Price Index. The PCE is broader and more flexible, accounting for "substitution effects" (e.g., if beef prices rise, consumers might buy more chicken).
Strategic Recommendations for 2026
Given the historical context of US inflation rates, individuals should take proactive steps to protect their financial health. As of 2026, the era of "free money" (0% interest rates) appears to be over for the foreseeable future.
- Audit Your Savings: Ensure that your emergency fund is held in a high-yield savings account or money market fund. If your bank is still offering 0.01% interest while the annual inflation rate is 2.5% or higher, you are losing money every day.
- Consider Fixed-Rate Debt: If you are planning a major purchase, a fixed-rate loan protects you from future interest rate spikes if inflation begins to trend upward again.
- Diversify Your Portfolio: Maintain a mix of assets that perform differently in various inflationary environments. While stocks are generally good for long-term inflation protection, adding commodities or inflation-indexed bonds can provide a hedge during sudden price surges.
Disclaimer: This article provides historical economic data and general information for educational purposes. It does not constitute financial, investment, or legal advice. Please consult with a qualified financial advisor before making significant investment decisions.