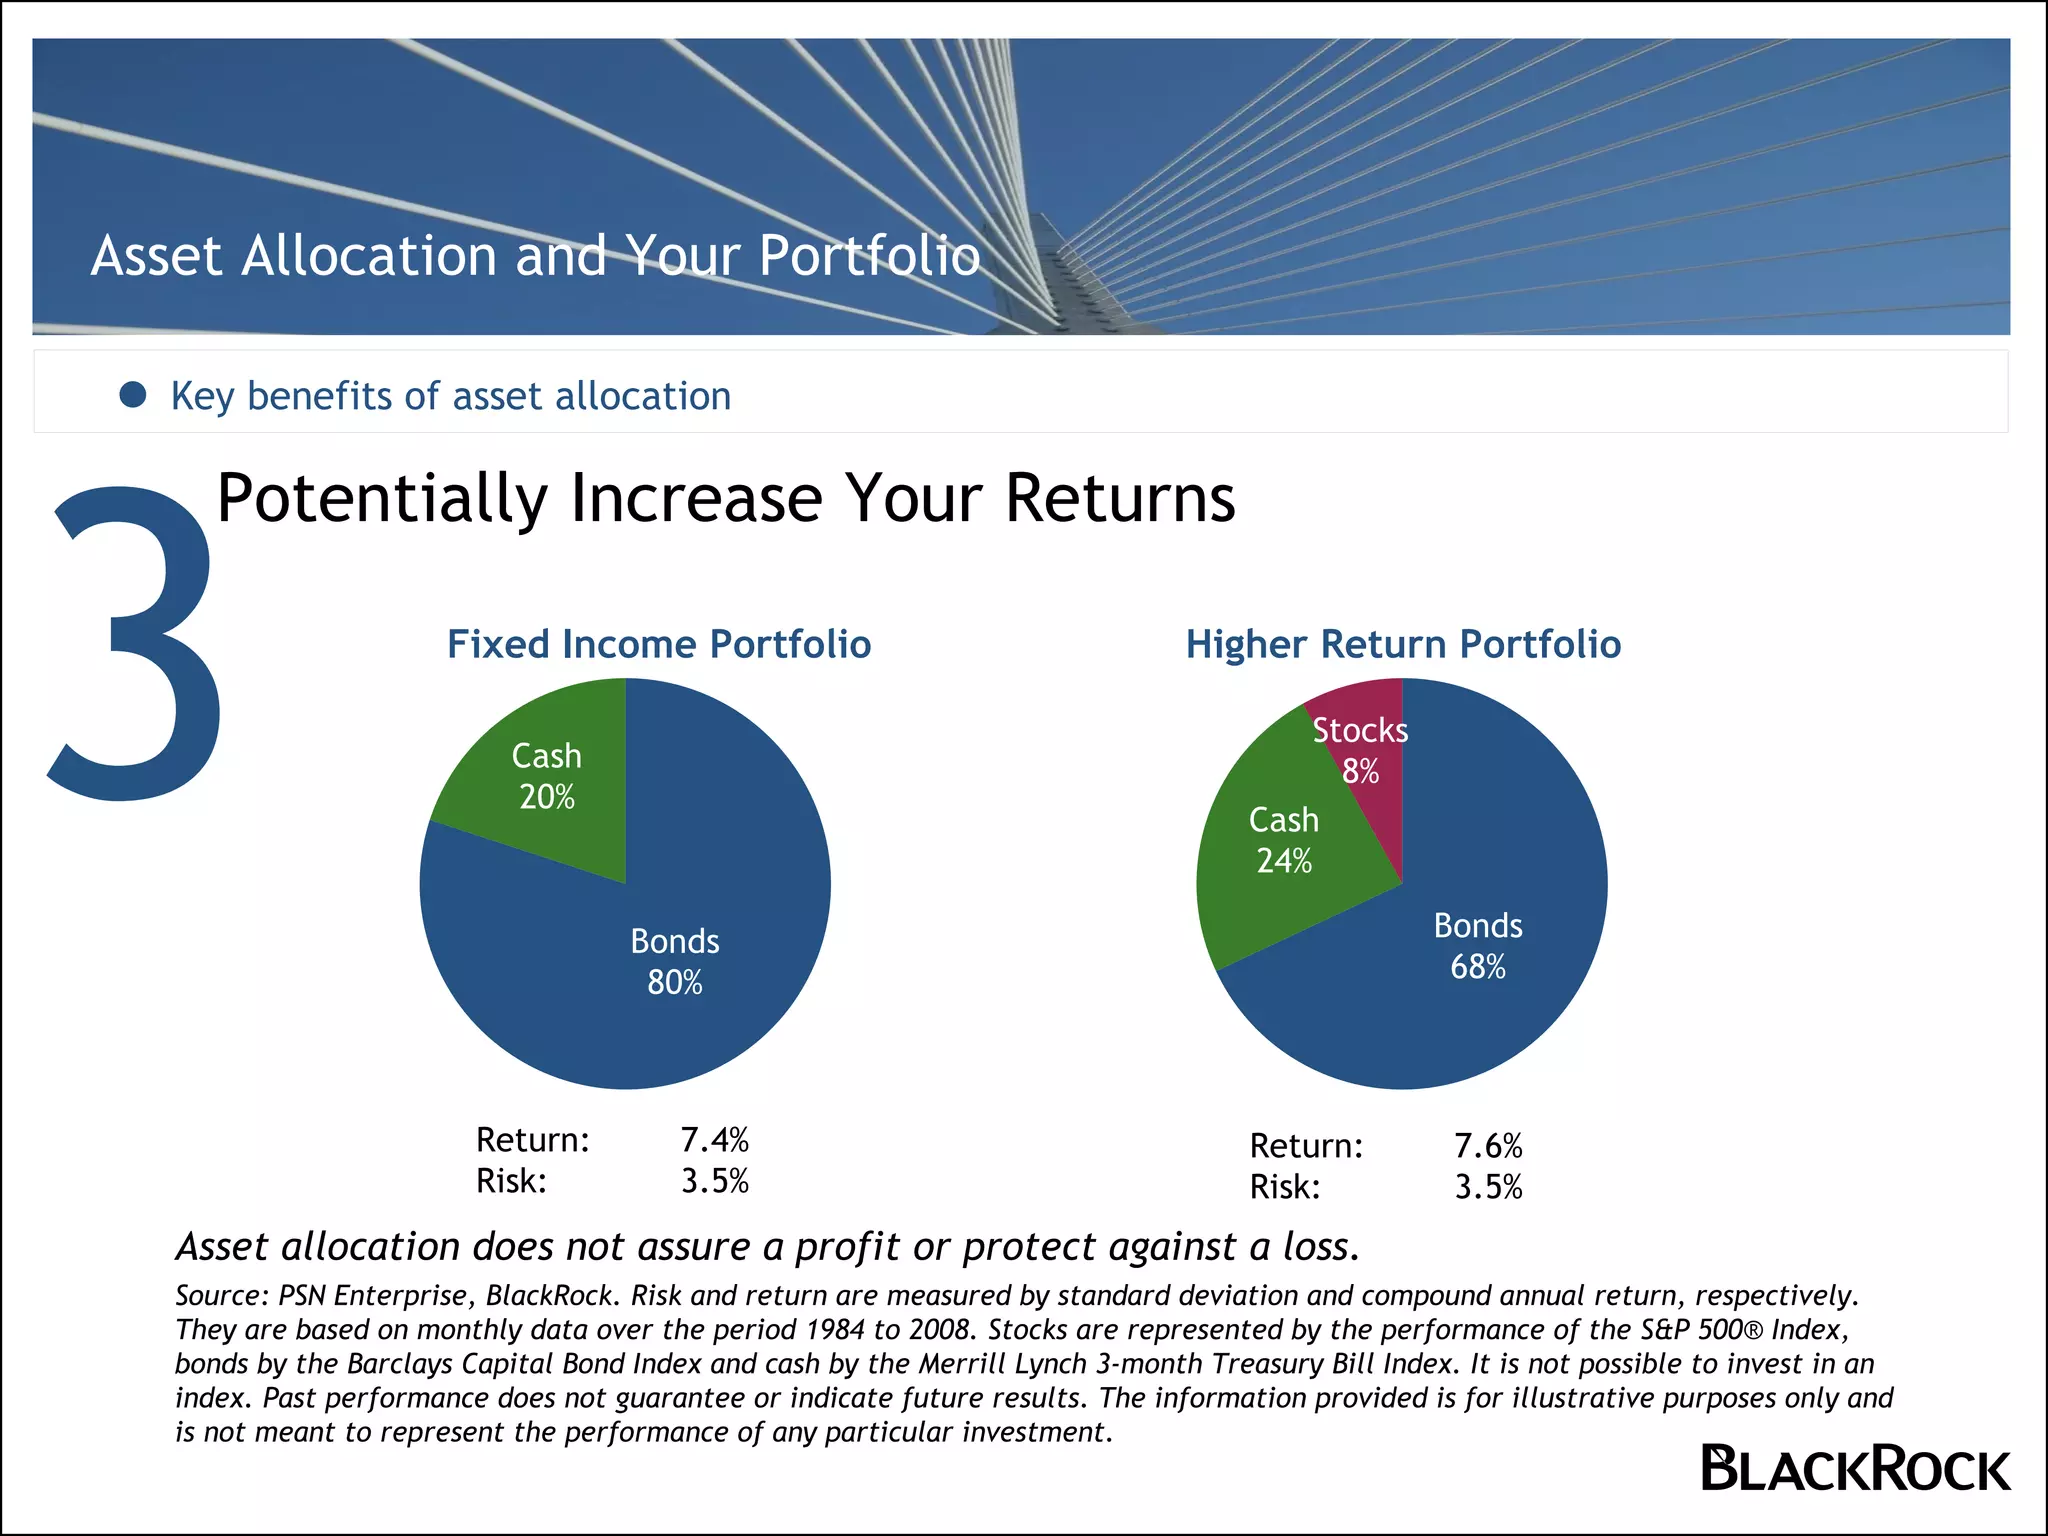
Asset allocation returns historical trends and variations demonstrate how diversifying capital across distinct asset classes like equities, fixed income, and cash equivalents shapes long-term wealth accumulation while managing portfolio volatility. Historical market data confirms that no single asset class dominates every economic cycle, making structured portfolio construction essential for balancing risk against return expectations.
Understanding Asset Allocation and Historical Performance
Asset allocation is the practice of dividing an investment portfolio among different asset categories, such as stocks, bonds, real estate, and cash. The foundational principle behind this strategy is that different asset classes respond differently to identical economic conditions. When equities experience a downturn, high-grade bonds or cash equivalents often hold their value or appreciate, cushioning the overall portfolio against catastrophic losses.
Examining historical market data over multi-decade periods reveals distinct patterns in how various asset mixes perform. Long-term studies consistently show that a portfolio's asset allocation—the specific percentage dedicated to stocks versus bonds—is the primary driver of portfolio return variability over time, often outweighing individual security selection or market timing.
To understand these dynamics, financial researchers rely on long-run capital market datasets spanning over a century. These datasets track nominal and inflation-adjusted (real) returns across market panics, world wars, inflationary spikes, and technological revolutions. The data demonstrates that while equities offer higher long-term growth potential, they demand significant psychological and financial tolerance for drawdown periods. Conversely, fixed income delivers predictable income streams and capital preservation but carries the risk of losing purchasing power during high-inflation regimes.
Historical Returns by Major Asset Class
Evaluating historical trends requires looking at the primary asset classes individually before examining how combinations of these assets perform. Each asset class carries a distinct risk-and-return profile shaped by structural economic factors.
Equities (Stocks)
Historically, domestic and international equities have generated the highest long-term nominal and real returns among major asset classes. Over the past century, large-cap domestic equities have delivered annualized real returns averaging roughly 6% to 7% above the rate of inflation. However, these returns do not arrive in a smooth line. Equities are subject to severe cyclical variations, including structural bear markets where values drop by 20% or more, and occasional systemic crashes.
Fixed Income (Bonds)
Government and corporate bonds provide lower long-term returns than stocks, historically averaging a real return of 2% to 3% above inflation. The primary function of fixed income within an asset allocation framework is capital preservation and income generation. During periods of equity market distress, high-quality government bonds frequently rally as investors seek safe havens, providing a vital negative correlation that stabilizes diversified portfolios.
Cash Equivalents and Inflation Hedges
Cash, Treasury bills, and short-term commercial paper offer safety of principal and immediate liquidity, but their historical real returns are often close to zero or slightly negative after accounting for taxes and inflation. Meanwhile, alternative asset classes like real estate and commodities exhibit varying historical trends, often serving as tactical inflation hedges rather than primary long-term return drivers.
Economic Regimes and Return Variations
Historical asset allocation returns are heavily influenced by the prevailing macroeconomic environment. Different economic regimes alter the correlation between stocks and bonds, directly impacting multi-asset portfolio performance.
Inflationary Regimes
During periods of high and rising inflation, traditional portfolios split between 60% stocks and 40% bonds often face simultaneous drawdowns. When inflation spikes, central banks typically raise interest rates, which depresses bond prices while compressing equity valuation multiples. Historical episodes, such as the stagflation era of the 1970s, demonstrate that standard asset allocations require exposure to commodities, real estate, or inflation-protected securities to maintain real purchasing power.
Deflationary and Recessionary Regimes
In economic downturns characterized by slowing growth and falling demand, central banks usually cut interest rates. This environment favors fixed-income assets, as existing bonds with higher coupon rates appreciate in value. Diversified asset allocation shines during these periods, because the gains in the bond allocation help offset the capital losses sustained in the equity portion of the portfolio.
Structural Market Shifts
Secular bull and bear markets in equities can last for fifteen to twenty years. For instance, the secular equity bear market spanning from 2000 to 2013 saw flat nominal returns for broad stock indexes, making tactical rebalancing and fixed-income returns critical for overall wealth preservation. Understanding these multi-year variations helps investors avoid abandoning a disciplined asset allocation strategy during prolonged consolidation phases.
Comparing Asset Allocation Strategies
Different investor risk profiles require distinct asset allocation models. The table below outlines common allocation models alongside their historical characteristics, volatility metrics, and risk-return trade-offs.
| Allocation Strategy | Typical Equity % | Typical Fixed Income % | Historical Return Profile | Volatility & Risk Level | Primary Use Case |
|---|---|---|---|---|---|
| Aggressive Growth | 80% – 90% | 10% – 20% | High long-term growth; significant short-term drawdowns. | High; prone to deep multi-year market corrections. | Long time horizons (20+ years); high risk tolerance. |
| Balanced (60/40) | 60% | 40% | Moderate growth with dampened volatility. | Medium; historical standard benchmark for multi-asset portfolios. | Medium-to-long time horizons; moderate risk tolerance. |
| Conservative Income | 30% | 70% | Lower growth focused on capital preservation and yield. | Low-to-Medium; minimal exposure to severe equity crashes. | Retirees or investors prioritizing capital stability over growth. |
Common Mistakes in Managing Asset Allocation
Investors analyzing historical asset allocation returns frequently fall into behavioral and technical traps that undermine their long-term financial outcomes.
- Chasing Past Performance: Modifying an asset allocation model based on the previous year's winning asset class often leads to buying high and selling low. Historical trends show that asset class leadership rotates cyclically.
- Neglecting Rebalancing: Over time, market movements alter a portfolio's original asset weights. Failing to periodically rebalance back to target percentages leads to unintended risk drift, leaving the portfolio overexposed to whichever asset class performed best recently.
- Ignoring Tax Implications: Rebalancing taxable accounts can trigger capital gains tax liabilities. Effective asset location—placing tax-inefficient assets like bonds in tax-advantaged accounts and tax-efficient equities in taxable accounts—is as critical as asset allocation.
- Underestimating Time Horizons: Adopting a conservative asset allocation too early can expose an investor to the silent risk of inflation eroding their purchasing power over a multi-decade retirement.
Frequently Asked Questions
What is the historical return of a classic 60/40 portfolio?
Over the long term spanning the past century, a traditional 60/40 portfolio composed of large-cap equities and intermediate government bonds has delivered an average annual nominal return of roughly 8% to 9%, translating to a real, inflation-adjusted return of approximately 5% to 6%. Actual annual results vary significantly based on entry points and prevailing interest rates.
Why do asset class correlations change over time?
Asset correlations are not fixed constants. They shift in response to macroeconomic shocks, monetary policy shifts, and inflation dynamics. For example, while stocks and bonds typically exhibit a negative correlation—meaning when stocks fall, bonds rise—they can become positively correlated during periods of persistent, high inflation when both asset types face downward pressure.
How often should an investor rebalance their asset allocation?
Most financial professionals recommend reviewing a portfolio annually or whenever asset weights drift by more than 5% from their target percentages. Regular rebalancing forces a disciplined process of trimming outperforming assets and buying underperforming ones, aligning with the core tenets of historical risk management.
Can historical asset allocation returns predict future performance?
No. Historical trends provide valuable insight into how asset classes behave across different economic cycles, but past performance does not guarantee future results. Changing structural factors, such as global demographic shifts, starting interest rate levels, and macroeconomic volatility, mean future returns may differ substantially from historical averages.
Next Actions for Portfolio Review
To apply historical asset allocation insights effectively, investors should audit their current portfolio weights against their personal risk tolerance and time horizon. Calculate the exact percentage exposed to equities, fixed income, and cash equivalents. Establish a written investment policy statement detailing target asset allocations, acceptable drift thresholds, and a scheduled rebalancing calendar to maintain discipline across all market cycles.