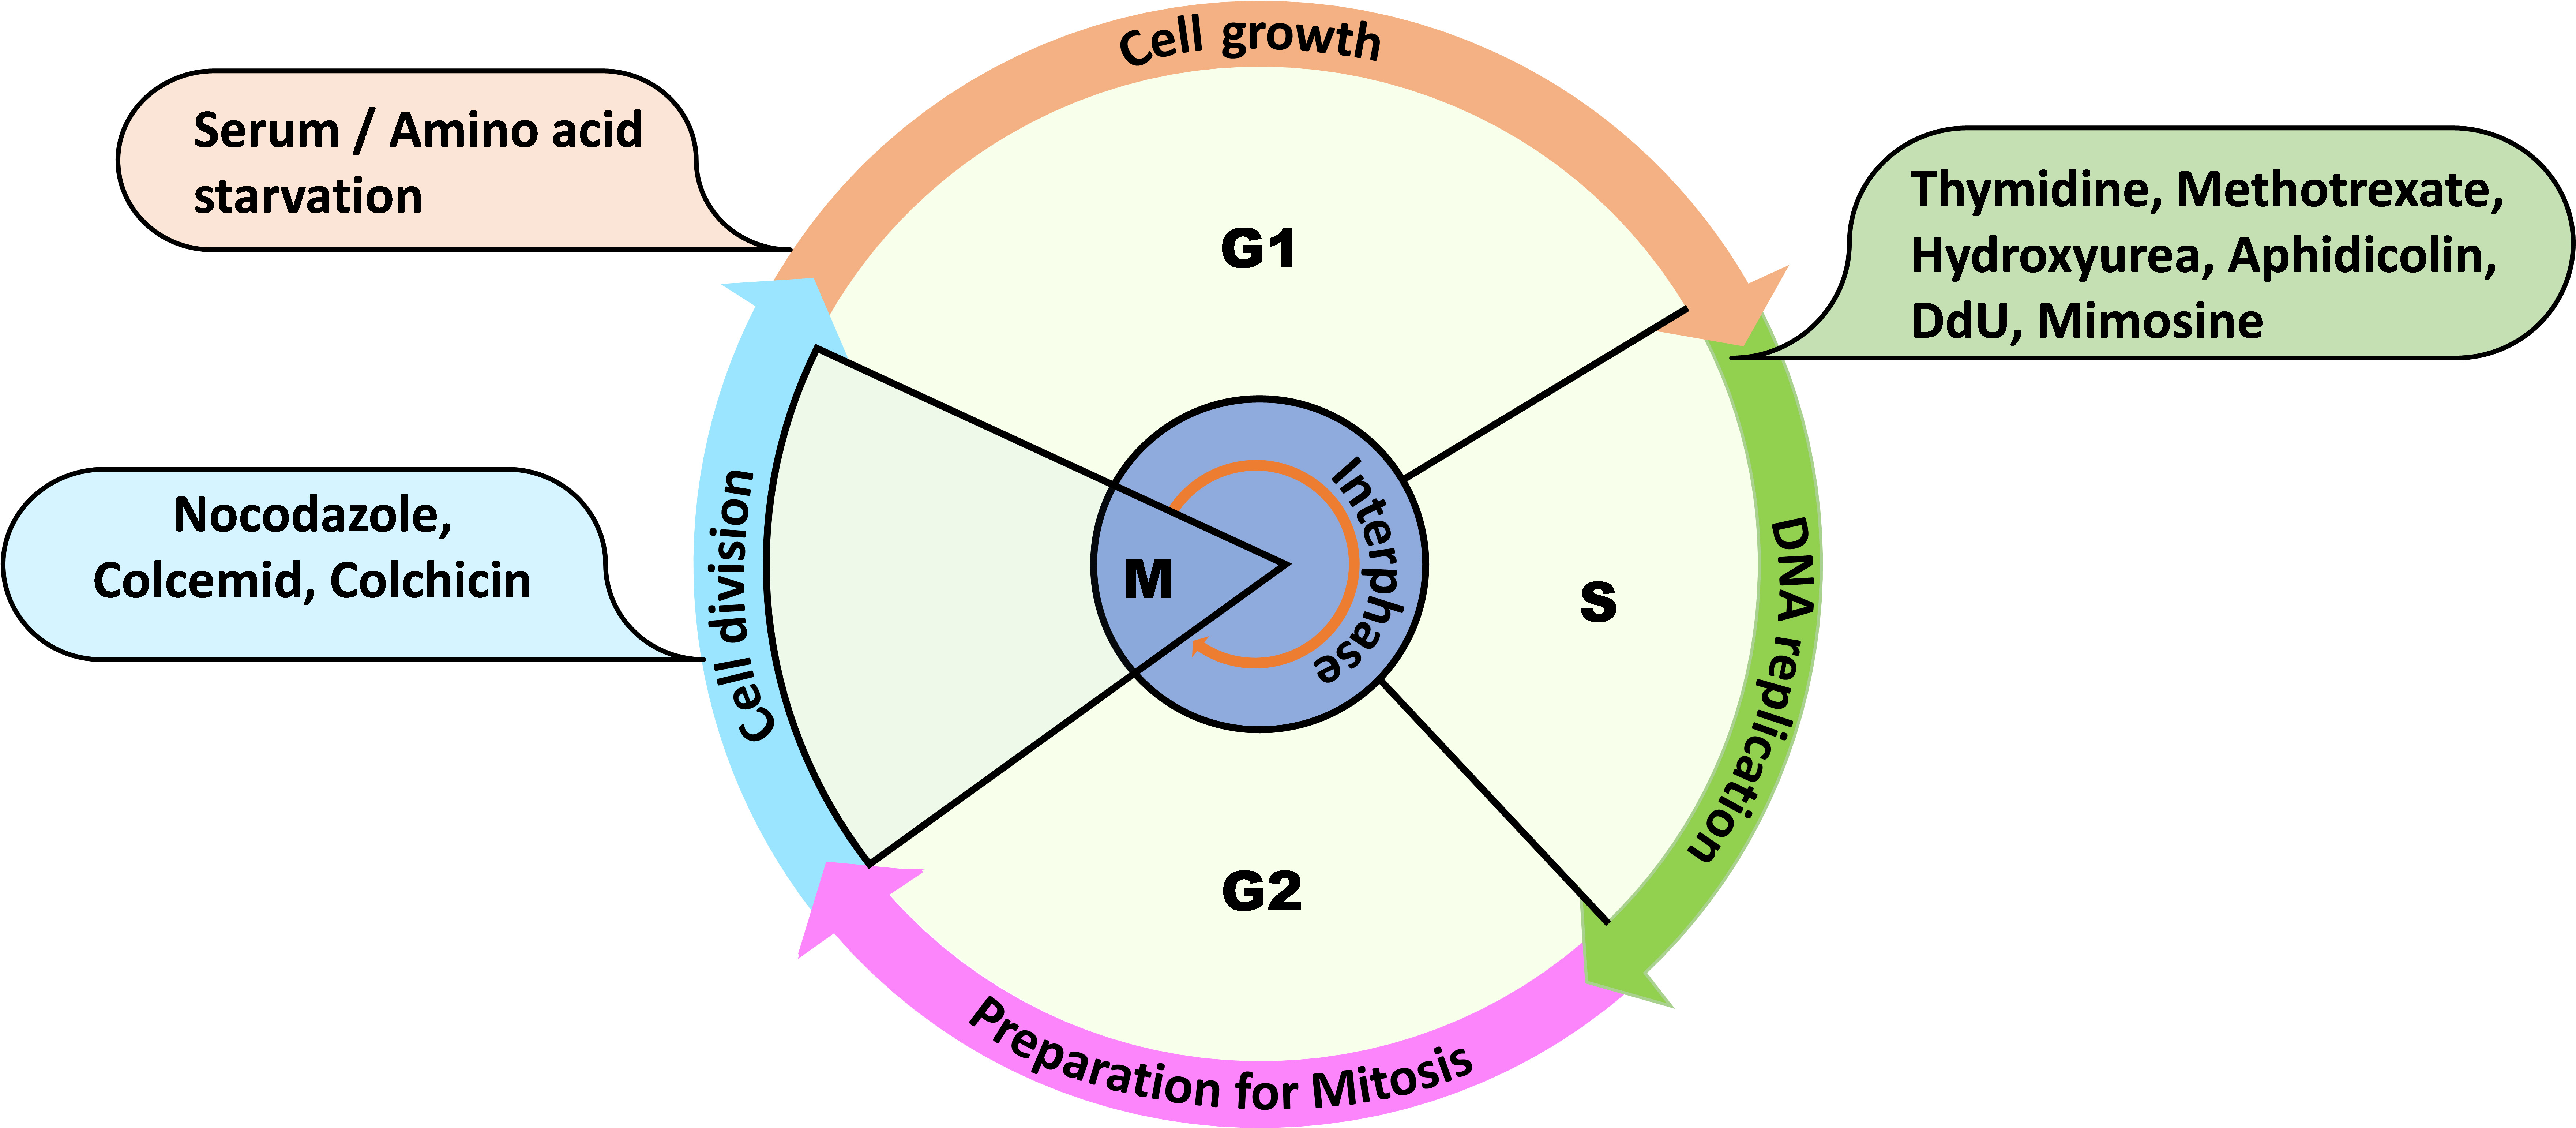
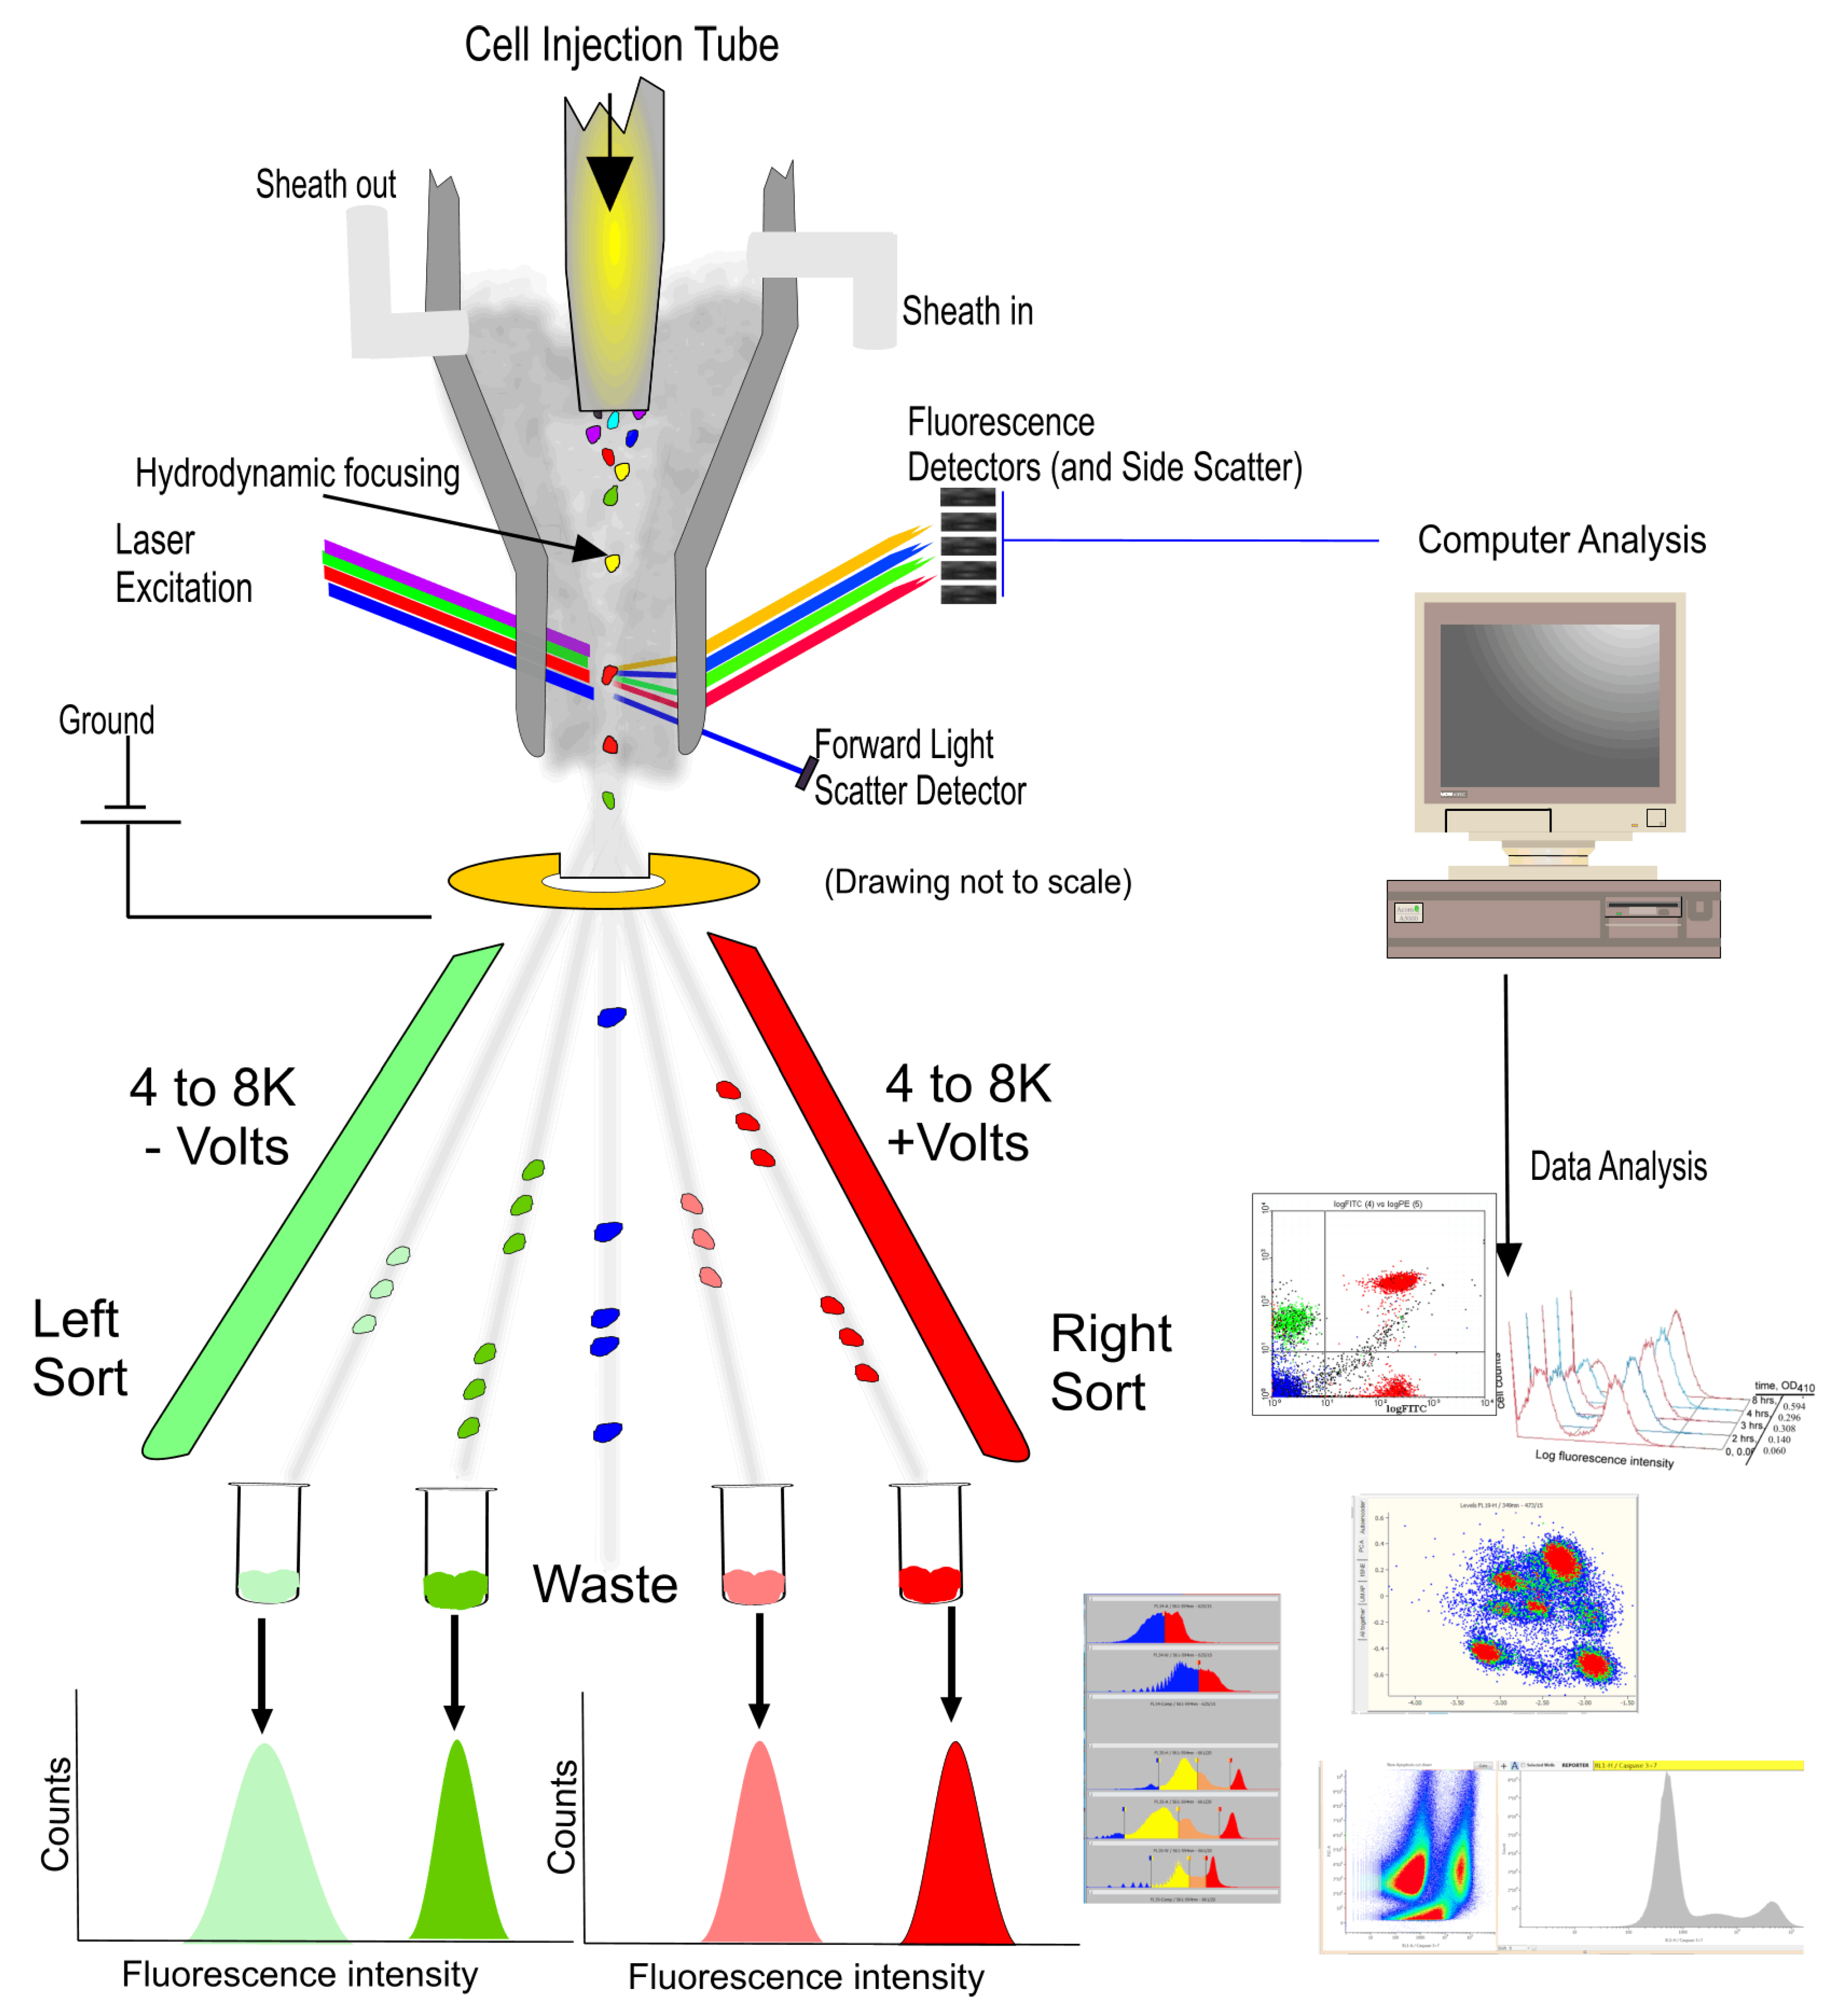
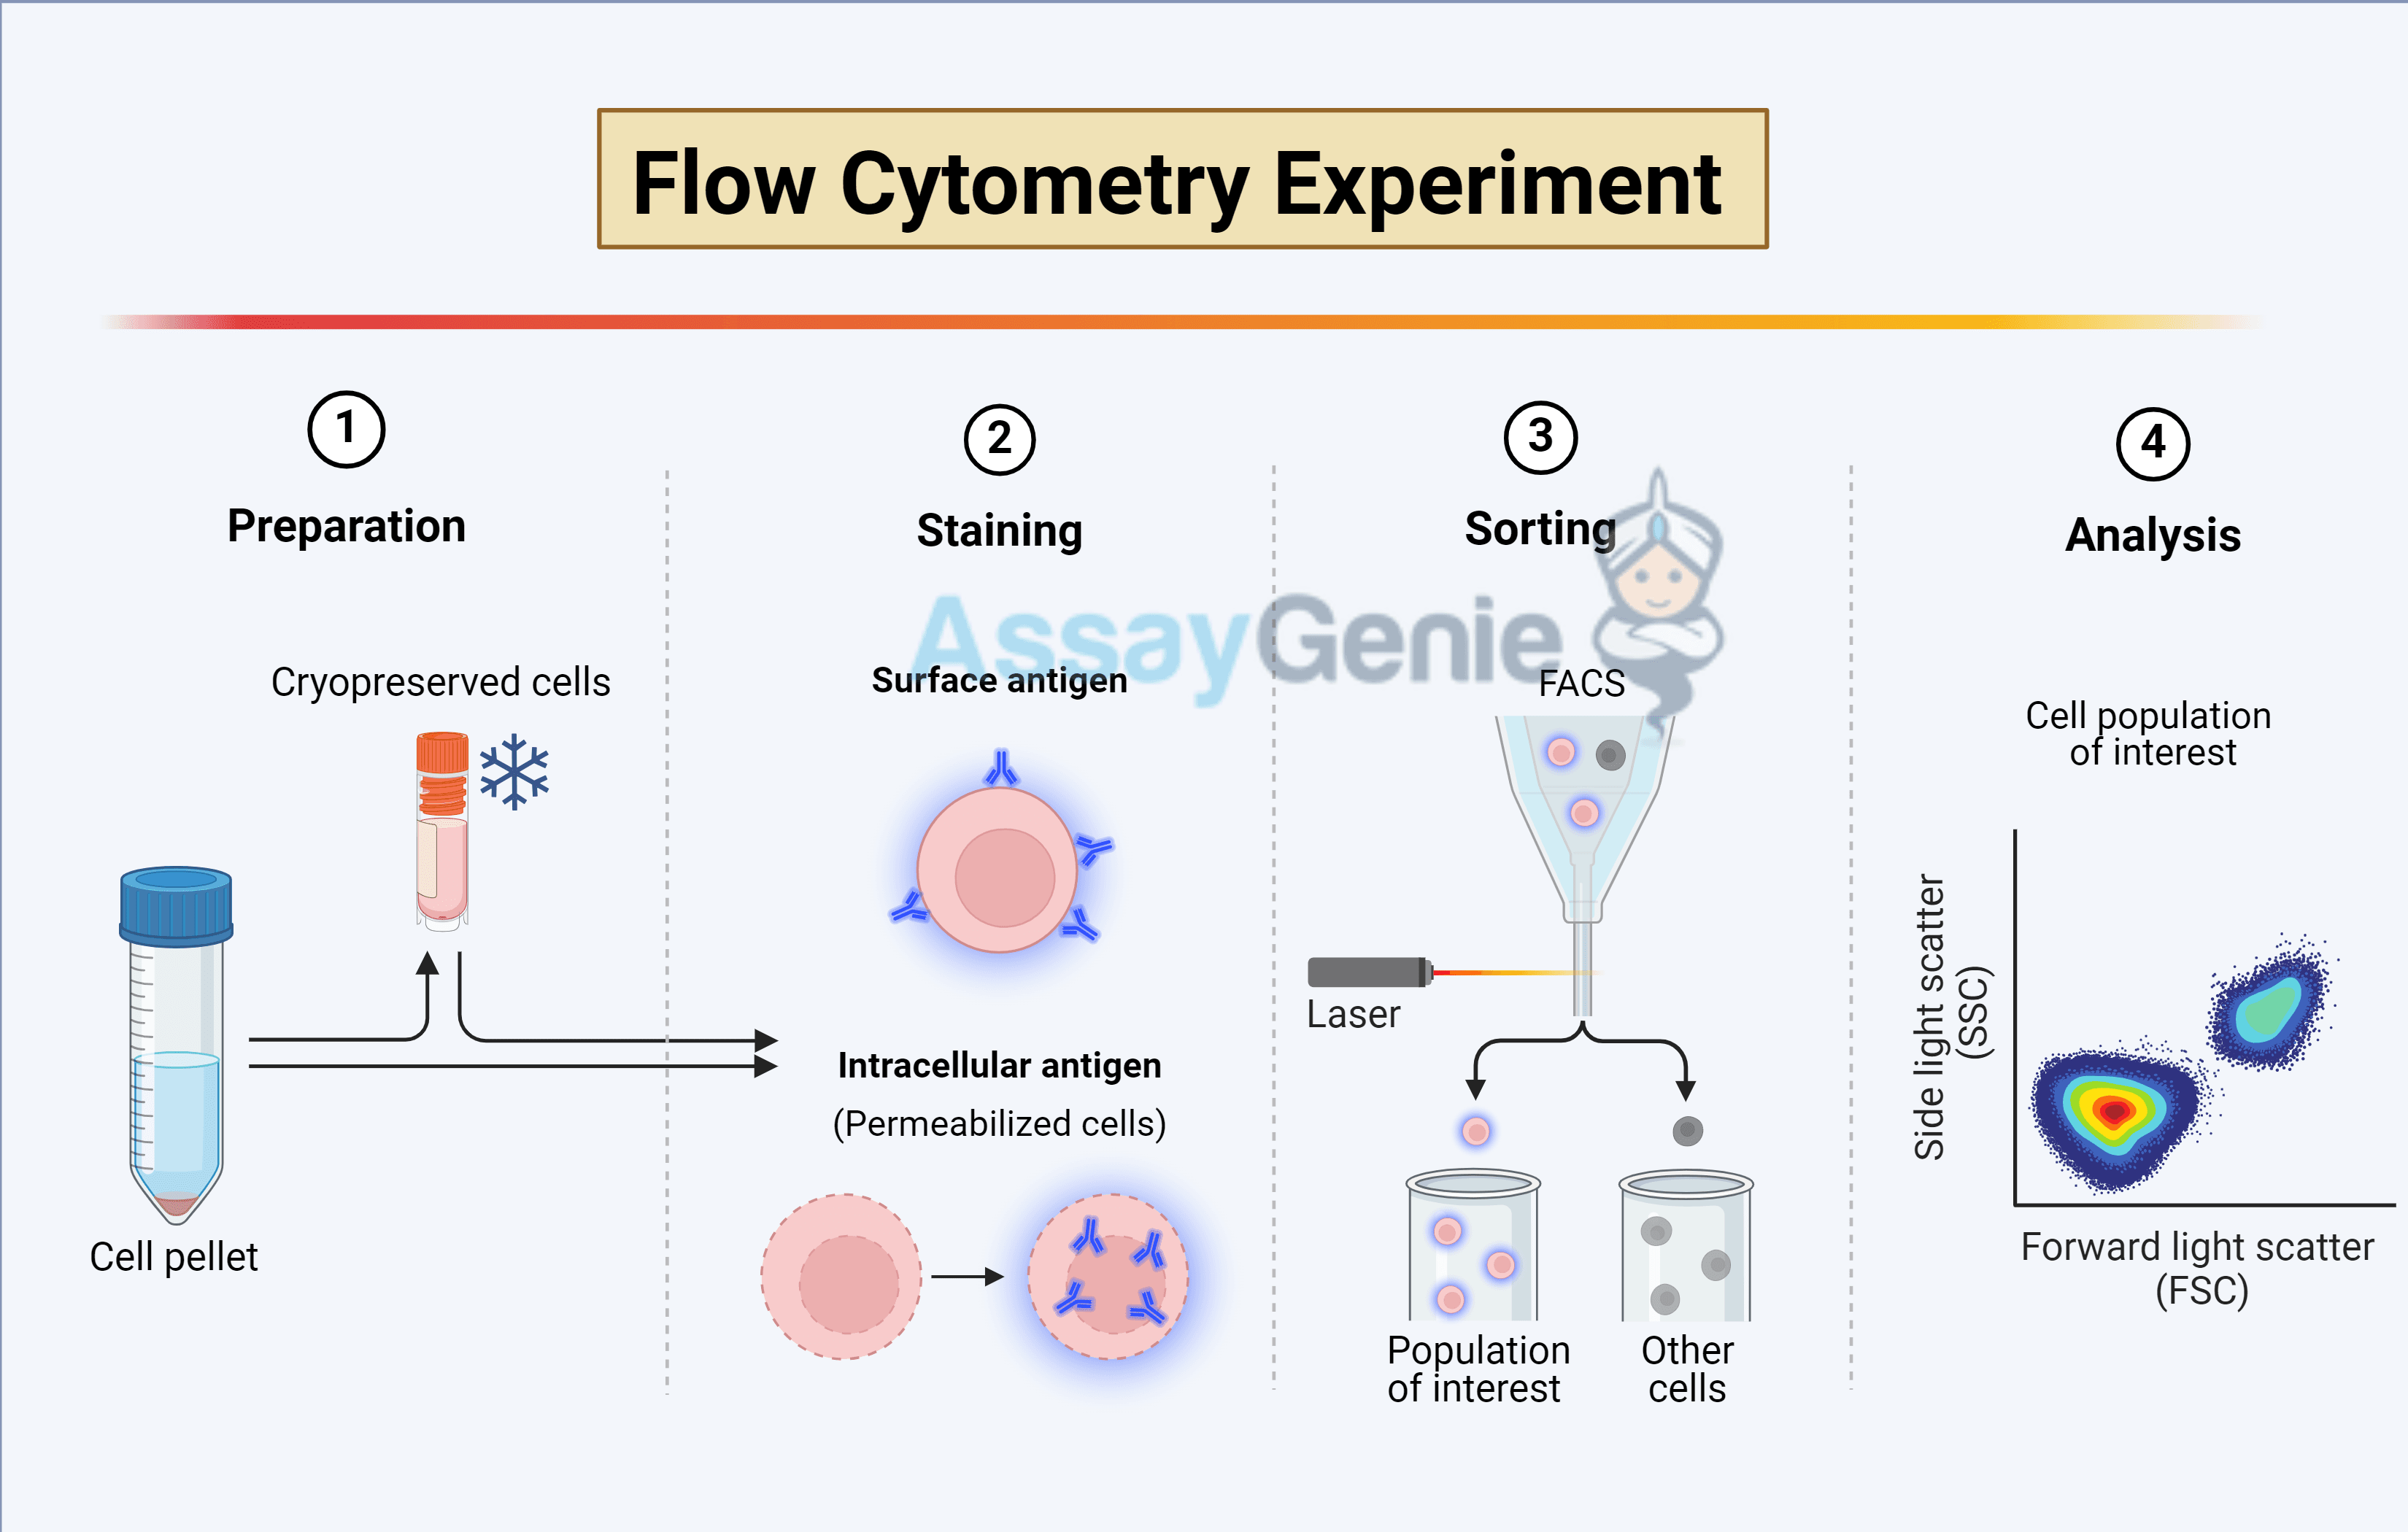
Analyzing the cell cycle by flow cytometry is a core laboratory technique used to quantify the DNA content of individual cells within a population. By employing fluorescent dyes that bind proportionally to DNA, researchers can distinguish between cells in the G0/G1, S, and G2/M phases based on their fluorescence intensity, providing critical insights into cell proliferation, health, and drug responses.
Theoretical Foundations of DNA Content Analysis
The cell cycle is an ordered series of events that leads to cell division. In a healthy, proliferating population, cells contain varying amounts of DNA depending on their current stage. Flow cytometry exploits this biochemical reality through stoichiometric staining. This means the amount of fluorescent dye bound to the cell is directly proportional to the amount of DNA present.
During the G0/G1 phase, cells possess a diploid (2n) DNA content. As cells progress into the S phase (Synthesis), they replicate their DNA, resulting in a fluorescence intensity that ranges between 2n and 4n. Once DNA replication is complete, cells enter the G2 phase and subsequent M phase (Mitosis), where they possess a doubled, tetraploid (4n) DNA content. Because G2 and M phase cells have the same amount of DNA, standard DNA staining cannot distinguish between them without additional markers such as Phospho-Histone H3.
By generating a histogram of fluorescence intensity, we observe two primary peaks: the first representing G0/G1 and the second, at double the intensity, representing G2/M. The area between these peaks represents the S-phase population. As of 2026, while automated algorithms have become highly sophisticated, the fundamental requirement remains a high-quality, single-cell suspension and precise stoichiometric binding.
Selection of Fluorescent DNA Dyes
The choice of fluorophore depends on the laser configuration of your flow cytometer, whether you require live or fixed cells, and whether you are performing multi-color panels.
Propidium Iodide (PI)
PI remains the most common dye for cell cycle analysis in fixed cells. It is an intercalating agent that binds to double-stranded nucleic acids. However, PI is not specific to DNA; it also binds to RNA. Consequently, samples must be treated with Ribonuclease (RNase) to ensure the signal strictly reflects DNA content. PI is excited by the 488 nm (blue) or 561 nm (yellow/green) lasers and emits in the red spectrum (617 nm).
DAPI and Hoechst 33342
DAPI is a blue-fluorescent dye that binds preferentially to AT-rich regions of the DNA minor groove. It is typically used for fixed cells and is excited by UV or 405 nm (violet) lasers. Hoechst 33342 is chemically similar but is cell-permeant, making it the gold standard for live-cell cycle analysis and side-population studies. These dyes generally provide lower coefficients of variation (CV) than PI, leading to sharper peaks.
Modern 2026 Alternatives
Recent advancements have popularized dyes like the Vybrant DyeCycle series. These are non-toxic, cell-permeable dyes that allow for cell cycle analysis on live samples without the need for fixation or RNase treatment. They are available for various laser lines (Violet, Blue, Green, and Orange), facilitating complex multi-color panels where the "standard" channels might be occupied by other markers.
Sample Preparation and Fixation Protocols
The accuracy of cell cycle analysis is highly dependent on sample preparation. The goal is to create a suspension of single nuclei or permeabilized cells that the dye can easily access.
The Ethanol Fixation Method
The most reliable method for long-term storage and sharp DNA profiles is cold 70% ethanol fixation. Ethanol dehydrates the cells and fixes the proteins while simultaneously permeabilizing the plasma and nuclear membranes.
- Harvesting: Collect cells and wash them in phosphate-buffered saline (PBS). Ensure the cells are in a single-cell suspension.
- Fixation: While vortexing the cell pellet gently, add ice-cold 70% ethanol dropwise. Adding the ethanol slowly prevents the formation of large cell clumps, which are difficult to resolve later.
- Incubation: Cells should be fixed for at least 2 hours at -20°C. In current 2026 laboratory standards, fixed cells can often be stored at -20°C for several weeks without significant degradation of the DNA profile.
- Rehydration: Before staining, ethanol must be washed away with PBS, as residual alcohol can interfere with dye binding and instrument performance.
Detergent-Based Permeabilization
For faster processing or when sensitive surface antigens must be preserved, researchers may use detergent-based buffers (e.g., Triton X-100). This "staining buffer" often contains the detergent, the DNA dye, and RNase in a single solution. While faster, this method is usually less stable than ethanol fixation and requires immediate acquisition.
The Critical Role of Doublet Discrimination
One of the most frequent errors in cell cycle analysis is the failure to exclude doublets—two G0/G1 cells (2n + 2n) passing through the laser so closely together that the instrument registers them as a single event with 4n DNA content. Without proper gating, these doublets will be incorrectly counted as G2/M phase cells, skewing the data.
To resolve this, flow cytometers use pulse processing. When a cell passes through the laser, it creates a pulse of light. We measure the Height (H), Area (A), and Width (W) of this pulse.
- A single G2/M cell (4n) is typically spherical and passes through the laser quickly.
- A doublet of two G0/G1 cells (2n+2n) is elongated and takes longer to pass through the laser.
By plotting DNA Area vs. DNA Width (or Height vs. Area), doublets can be identified as events with disproportionately high Width or Area relative to their Height. These must be gated out before analyzing the cell cycle histogram.
Data Acquisition and Quality Control
When acquiring data, the instrument settings are paramount. Unlike immunophenotyping, where "logarithmic" scales are used to visualize a wide range of brightness, cell cycle analysis must be performed on a linear scale. Since a G2 cell has exactly twice the DNA of a G1 cell, the linear scale allows the peaks to appear at mathematically predictable intervals (e.g., if G1 is at 200, G2 should be at 400).
Managing the Coefficient of Variation (CV)
The CV is a measure of the "width" or "sharpness" of the G0/G1 peak. A high CV (broad peak) makes it impossible to distinguish S-phase cells from the G1 or G2 populations. To achieve a low CV (ideally <5%):
- Run the sample at a low flow rate: This ensures the cells pass through the center of the laser beam (hydrodynamic focusing), leading to more uniform excitation.
- Ensure proper alignment: Modern 2026 digital cytometers often have automated alignment, but check the beads if peaks appear "fuzzy."
- Saturation: Ensure the dye concentration is high enough to saturate the DNA; otherwise, staining will be inconsistent.
Advanced Mathematical Modeling
While a simple histogram provides a visual representation, precise quantification requires mathematical modeling. This is because the S-phase distribution overlaps with the right tail of the G1 peak and the left tail of the G2 peak.
Software packages like FlowJo, ModFit LT, and FCS Express utilize algorithms such as the Dean-Jett-Fox or Watson Pragmatic models. These models apply Gaussian distributions to the G1 and G2/M peaks and use polynomial or spread-function curves to estimate the S-phase. When reporting data, it is essential to mention which model was used, as different algorithms can yield slightly different percentages for the S-phase population.
| Feature | Propidium Iodide (PI) | DAPI | Hoechst 33342 | Vybrant DyeCycle Violet |
|---|---|---|---|---|
| Cell Status | Fixed/Permeabilized | Fixed/Permeabilized | Live or Fixed | Live |
| Excitation (nm) | 488 or 561 | 355 or 405 | 355 or 405 | 405 |
| Emission (nm) | 617 (Red) | 460 (Blue) | 461 (Blue) | 440 (Blue) |
| RNase Required? | Yes | No | No | No |
| Common Use | Standard analysis | High-resolution fixed | Live sorting/Side pop | Multi-color panels |
| Mechanism | Intercalating | AT-selective groove | AT-selective groove | Minor groove binding |
Troubleshooting Common Issues
1. Broad G1 Peak (High CV)
This is usually caused by poor fixation, inconsistent staining, or a flow rate that is too high. If the CV exceeds 8%, the S-phase calculation becomes unreliable. Re-staining or running the sample at the lowest possible speed is recommended.
2. High "Sub-G1" Population
A peak appearing to the left of the G1 peak represents cells with less than 2n DNA. This is a classic hallmark of apoptosis, where DNA fragmentation leads to the loss of small DNA fragments during the washing steps, resulting in reduced fluorescence.
3. Shifted G2/M Peak
The G2/M peak should be exactly at double the mean of the G1 peak. If it is not (e.g., G1 is at 200 and G2 is at 380), it suggests non-stoichiometric staining. This often happens if the DNA dye concentration is too low or if the laser is misaligned.
4. Excessive Debris
Debris appears as events very close to the Y-axis. Excessive debris can interfere with the software's ability to fit the G1 peak correctly. This is often caused by over-vortexing fixed cells or using samples with high levels of cell death.
Incorporating Proliferation Markers (BrdU and EdU)
A limitation of standard DNA staining is that it provides a "snapshot" of the cell cycle but does not measure the rate of DNA synthesis. To address this, researchers use nucleotide analogs like BrdU (Bromodeoxyuridine) or EdU (5-ethynyl-2'-deoxyuridine).
Cells are pulsed with these analogs, which are incorporated into the DNA during the S-phase. BrdU requires DNA denaturation (using acid or heat) to allow antibody access, which can damage other fluorescent proteins in the sample. EdU, however, utilizes "click chemistry," which is much milder and faster. By combining EdU (to label active synthesis) with a DNA dye like PI or DAPI, you can distinguish between cells that are actively cycling and those that are stalled in the S-phase.
Multiparametric Cell Cycle Analysis
In 2026, it is common to combine DNA content analysis with other markers to achieve higher resolution.
- Cyclin Expression: Measuring Cyclins D, E, A, and B1 alongside DNA content allows for the precise sub-division of the cell cycle (e.g., distinguishing G1a from G1b).
- Phospho-Histone H3 (pH3): Histone H3 is phosphorylated only during mitosis. Combining a pH3 antibody with DNA staining allows for the definitive separation of G2 cells from M-phase cells.
- Ki-67: This is a protein expressed in all active phases of the cell cycle but absent in G0. This combination is vital for identifying quiescent cells in a population.
Frequently Asked Questions
Why do I need to use RNase with Propidium Iodide?
Propidium Iodide is a non-specific intercalating agent. It binds to any double-stranded nucleic acid, including RNA. Since cells contain significant amounts of RNA, failing to remove it with RNase will result in a much higher fluorescence signal that does not accurately reflect DNA content, leading to a "smeared" histogram where peaks cannot be distinguished.
Can I use Paraformaldehyde (PFA) instead of Ethanol for fixation?
Yes, but with caution. PFA creates protein-DNA crosslinks. While this is better for preserving some fluorescent proteins (like GFP), it often results in a higher CV (broader peaks) compared to ethanol. If you use PFA, you must follow it with a strong permeabilization step (like Triton X-100) to allow the DNA dye to enter the nucleus and bind efficiently.
How many cells do I need to acquire for an accurate cell cycle?
For a standard cell cycle distribution, acquiring at least 10,000 to 20,000 "single-cell" events is recommended. If you are looking for rare populations or specific effects in the S-phase, you may need to acquire 50,000 or more events to ensure statistical significance in the mathematical modeling.
Is it possible to analyze the cell cycle in tissue samples?
Yes, but the tissue must first be dissociated into a single-cell or single-nuclei suspension. For solid tissues, "Nuclei Isolation Buffers" (which include detergents and stabilizers) are often used to release the nuclei directly, which are then stained for DNA content. This avoids the debris and clumping common with whole-cell dissociation from tissue.
What is the "Side Population" in cell cycle analysis?
The Side Population (SP) is a group of cells that can actively efflux Hoechst 33342 dye via ABC transporters. These are often identified as stem cells or progenitors. This analysis requires very specific staining conditions (37°C incubation) and the use of a flow cytometer with a UV laser.
Next Actions for Successful Analysis
To ensure the highest quality cell cycle data, start by validating your fixation protocol. Perform a pilot study comparing ethanol fixation with your specific cell line to ensure the CV remains below 5%. Always include a "negative" or "control" sample—typically an untreated, healthy population—to set your linear voltages. Finally, utilize doublet discrimination in every single run, as ignoring this step is the most common cause of published data errors in flow cytometry.