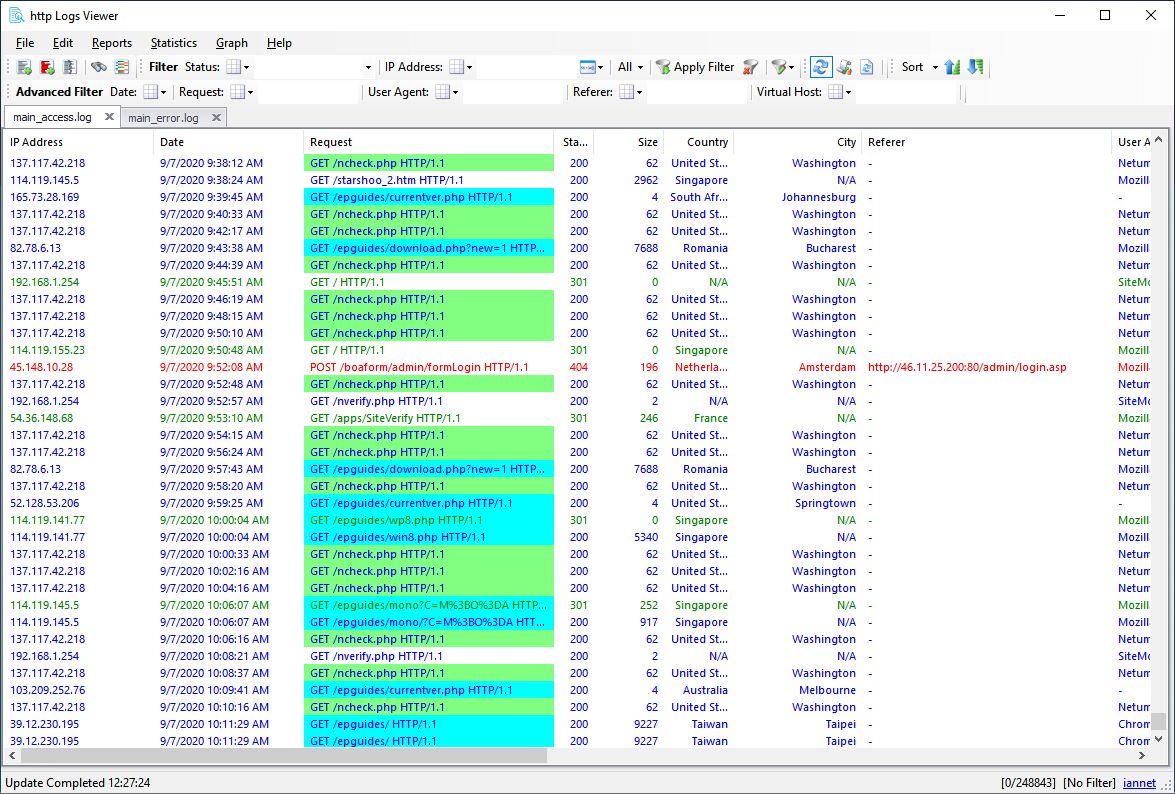
Free Apache log analyzers range from lightweight terminal tools like GoAccess to comprehensive stacks like ELK. Choosing the right one depends on whether you need real-time visualization, historical trend reporting, or centralized security auditing. While free tools offer significant cost savings, they often require manual configuration and higher server resource overhead.
The Apache HTTP Server remains a cornerstone of web infrastructure in 2026. Every request made to an Apache server leaves a footprint in the access.log, while every error or warning is captured in the error.log. Without a proper analyzer, these files are merely massive collections of text that are nearly impossible to interpret manually. Analyzing these logs is essential for identifying malicious traffic patterns, optimizing website performance, and understanding user behavior without relying solely on client-side scripts like JavaScript-based analytics.
Understanding Apache Log Formats and the Need for Analyzers
Before selecting a tool, it is critical to understand what these analyzers are processing. Apache typically uses two primary log formats: the Common Log Format (CLF) and the Combined Log Format. The latter is more popular because it includes the "Referer" and "User-Agent" fields, which are vital for SEO and security audits.
A raw log entry usually contains the client IP address, the timestamp, the HTTP request method (GET, POST), the requested URL, the status code (e.g., 200, 404, 500), and the size of the object returned. In a high-traffic environment, a single server can generate gigabytes of these logs daily. Free analyzers help transform this raw data into actionable insights, but they vary significantly in how they handle data ingestion, processing speed, and visualization.
GoAccess: The Real-Time Powerhouse
GoAccess is widely considered the gold standard for lightweight, real-time Apache log analysis in 2026. It is an open-source interactive log analyzer that runs in a terminal or through a web browser. Written in C, it is exceptionally fast and has a minimal memory footprint.
Key Features of GoAccess
GoAccess excels because it provides a dashboard that updates in real-time. For system administrators who need to monitor a server during a traffic spike or a suspected DDoS attack, GoAccess offers immediate visibility. It parses logs on the fly and generates an HTML report that can be served via a built-in WebSocket server. This allows you to see visitors, requested files, 404 errors, and host information as it happens.
Trade-offs of GoAccess
The primary trade-off with GoAccess is its lack of long-term historical data persistence by default. While you can save reports to a file, GoAccess is designed more for "at-the-moment" or daily analysis rather than multi-year trend tracking. Additionally, while the terminal interface is powerful, it has a learning curve for those who are not comfortable with command-line environments.
AWStats: The Reliable Classic
AWStats (Advanced Web Statistics) is a veteran in the log analysis space. It is a Perl-based tool that processes logs and generates static HTML reports. Despite its age, it remains highly relevant in 2026 because of its stability and the depth of its reporting on search engine crawlers and bot activity.
The Strength of AWStats
AWStats is particularly effective for small to medium-sized websites that do not need real-time updates but require a comprehensive daily summary. It is excellent at distinguishing between human visitors and automated bots—a feature that is increasingly important as AI-driven crawlers become more prevalent. It provides detailed tables on visit duration, exit pages, and HTTP status codes, helping webmasters identify broken links and SEO opportunities.
Trade-offs of AWStats
The most significant drawback of AWStats is its processing speed. Because it is written in Perl, it can be slow when processing exceptionally large log files (multi-gigabyte files). Furthermore, its user interface feels dated compared to modern web applications. Since it generates static pages, the data is only as fresh as the last time the update script was run via a cron job.
The ELK Stack and OpenSearch: Enterprise-Grade Depth
For organizations with high traffic or multiple servers, the ELK Stack (Elasticsearch, Logstash, and Kibana) or its fork, OpenSearch, represents the most powerful free (open-source) option. This is not just a log analyzer but a complete data pipeline and visualization ecosystem.
How the ELK Stack Functions
In this setup, Filebeat or Logstash acts as the shipper, collecting logs from the Apache server and sending them to Elasticsearch (the database). Kibana then provides a highly customizable web interface where you can build complex dashboards, search for specific IP addresses across millions of records, and set up alerts for specific conditions (like a sudden surge in 500-level errors).
Trade-offs of ELK
The "cost" of this free software is the significant technical overhead. Setting up a full ELK stack requires substantial RAM and CPU resources—far more than a simple instance of GoAccess. It also demands a high level of expertise to configure the mappings and index patterns correctly. For a single small website, ELK is usually overkill, but for a distributed network of Apache servers, it is the only way to achieve a unified view of the logs.
Analog: The Lightweight Speed King
If your primary goal is speed and you do not care about a modern graphical interface, Analog is a notable mention. It is designed to be the fastest log analyzer in existence.
Why Use Analog?
Analog is ideal for legacy systems or environments where server resources are extremely constrained. It focuses on providing a text-based summary of the most important metrics, such as most-visited pages and peak traffic hours. It is often used in conjunction with "Report Magic" to make the outputs slightly more visually appealing.
Trade-offs of Analog
The development of Analog has slowed significantly compared to GoAccess. It lacks support for many modern web technologies and log formats without extensive manual configuration. The output is rudimentary, and it does not provide the interactive features found in modern competitors.
Comparison of Free Apache Log Analyzers
The following table summarizes the key differences between the most popular free options available in 2026.
| Feature | GoAccess | AWStats | ELK Stack / OpenSearch | Analog |
|---|---|---|---|---|
| Primary Interface | Terminal / Web (HTML) | Web (Static HTML) | Web (Kibana Dashboard) | Text / Static HTML |
| Update Frequency | Real-time | Batch (Cron job) | Real-time / Near Real-time | Batch |
| Resource Usage | Very Low | Moderate | Very High | Extremely Low |
| Setup Complexity | Low | Moderate | High | Low |
| Historical Data | Limited | Excellent | Exceptional | Good |
| Best For | Troubleshooting & Devs | SEO & Webmasters | Enterprises & Security Ops | Legacy/Low-resource systems |
Technical Trade-offs and Considerations
When choosing a free analyzer, you must balance three competing priorities: accuracy, performance, and usability.
1. Privacy and Data Sovereignty
One of the biggest advantages of using a local Apache log analyzer over a service like Google Analytics is privacy. In 2026, data regulations like GDPR and CCPA have become even more stringent. By processing logs on your own infrastructure, you ensure that user IP addresses and browsing habits never leave your server. However, this places the burden of data security on you. If you are using ELK, you must ensure that your Elasticsearch instance is properly secured and not exposed to the public internet.
2. Log Rotation Conflicts
A common technical hurdle is the interaction between the analyzer and the server's log rotation policy (e.g., logrotate). If Apache rotates and compresses logs every midnight, your analyzer must be configured to process the log before it is moved, or it must be able to read from compressed .gz files. GoAccess and AWStats handle this relatively well, but misconfiguration can lead to gaps in your data.
3. DNS Lookup Latency
Many analyzers offer a feature to perform reverse DNS lookups to resolve IP addresses into hostnames (e.g., identifying that a visitor is from a specific ISP). While this provides better context, it can drastically slow down the processing of logs because each unique IP requires a network request. Most experts recommend keeping DNS lookups disabled during initial processing and only enabling them for specific troubleshooting sessions.
Security Auditing and Bot Detection
A major reason to use a dedicated log analyzer in 2026 is security. Apache logs are the first place to look for signs of a SQL injection attempt, cross-site scripting (XSS), or brute-force attacks on login pages.
- Identifying Malicious Patterns: Tools like GoAccess allow you to sort by "404 Not Found" requests. A high volume of 404s from a single IP often indicates a bot scanning your server for known vulnerabilities (e.g., looking for
/wp-adminor.envfiles). - Rate Limiting: By analyzing the frequency of requests per IP, you can identify "noisy" clients and implement rate limiting at the firewall or Apache level using
mod_ratelimitormod_evasive. - User-Agent Spoofing: Modern free analyzers are better at detecting spoofed User-Agents. If a log entry claims to be "Googlebot" but the IP address does not belong to Google’s verified ranges, AWStats or ELK can help flag this discrepancy.
Prerequisites for Successful Implementation
Regardless of the tool you choose, certain server-side configurations are necessary to get the most out of your logs:
- Combined Log Format: Ensure your Apache configuration (
httpd.conforapache2.conf) is set to use thecombinedformat rather thancommon. - Date and Time Synchronization: Use NTP (Network Time Protocol) to ensure your server clock is accurate. If you are analyzing logs from multiple servers, their timestamps must match for the data to be coherent.
- Storage Space: Log files can grow rapidly. Ensure your
/var/logpartition has enough space, or offload logs to a dedicated storage volume. - Permissions: The user running the analyzer must have read access to the log files. Often, logs are owned by
rootoradm, so you may need to adjust permissions or run the analyzer with appropriate privileges.
Frequently Asked Questions
Is GoAccess better than AWStats?
It depends on your goal. If you need to see what is happening on your server right now to fix a performance issue, GoAccess is superior. If you want to see a monthly report of how many visitors you had and which countries they came from for a business report, AWStats is often easier to manage and provides more "out-of-the-box" historical context.
Can I run these analyzers on Windows?
Most of these tools are designed for Linux/Unix environments. While you can run AWStats (via Perl) and the ELK stack on Windows, GoAccess is best used on Windows via the Windows Subsystem for Linux (WSL). For a native Windows Apache environment, the configuration is often more complex.
Do free log analyzers slow down my website?
If you run the analyzer on the same server that hosts your website, it will consume some CPU and RAM. GoAccess and Analog have a negligible impact. However, the ELK stack is resource-heavy and can slow down your site if your server doesn't have sufficient overhead. The best practice for high-traffic sites is to ship logs to a separate "logging server" for analysis.
How do log analyzers handle GDPR compliance?
Unlike client-side cookies, logs naturally contain IP addresses, which are considered personal data under GDPR. To stay compliant, many users configure their analyzers to "anonymize" the last octet of the IP address (e.g., changing 192.168.1.5 to 192.168.1.0) during processing so that the data can still be used for geographic analysis without identifying specific individuals.
Why not just use Google Analytics?
Google Analytics (or similar tools) only tracks users who execute JavaScript. It cannot see server-side errors, bot attacks, image hotlinking, or requests from users with ad-blockers. Apache log analysis provides a 100% accurate view of every request the server received, making it indispensable for technical health and security.
Final Recommendation
For the vast majority of users in 2026, GoAccess is the best starting point. Its balance of real-time speed, ease of installation, and modern visualization makes it the most practical choice for developers and system administrators. If you find that you need to analyze massive amounts of data across multiple servers and have the hardware to support it, transitioning to the ELK Stack (or OpenSearch) is the logical next step. For those who prefer a "set it and forget it" historical report for a single site, AWStats remains a reliable, time-tested option.