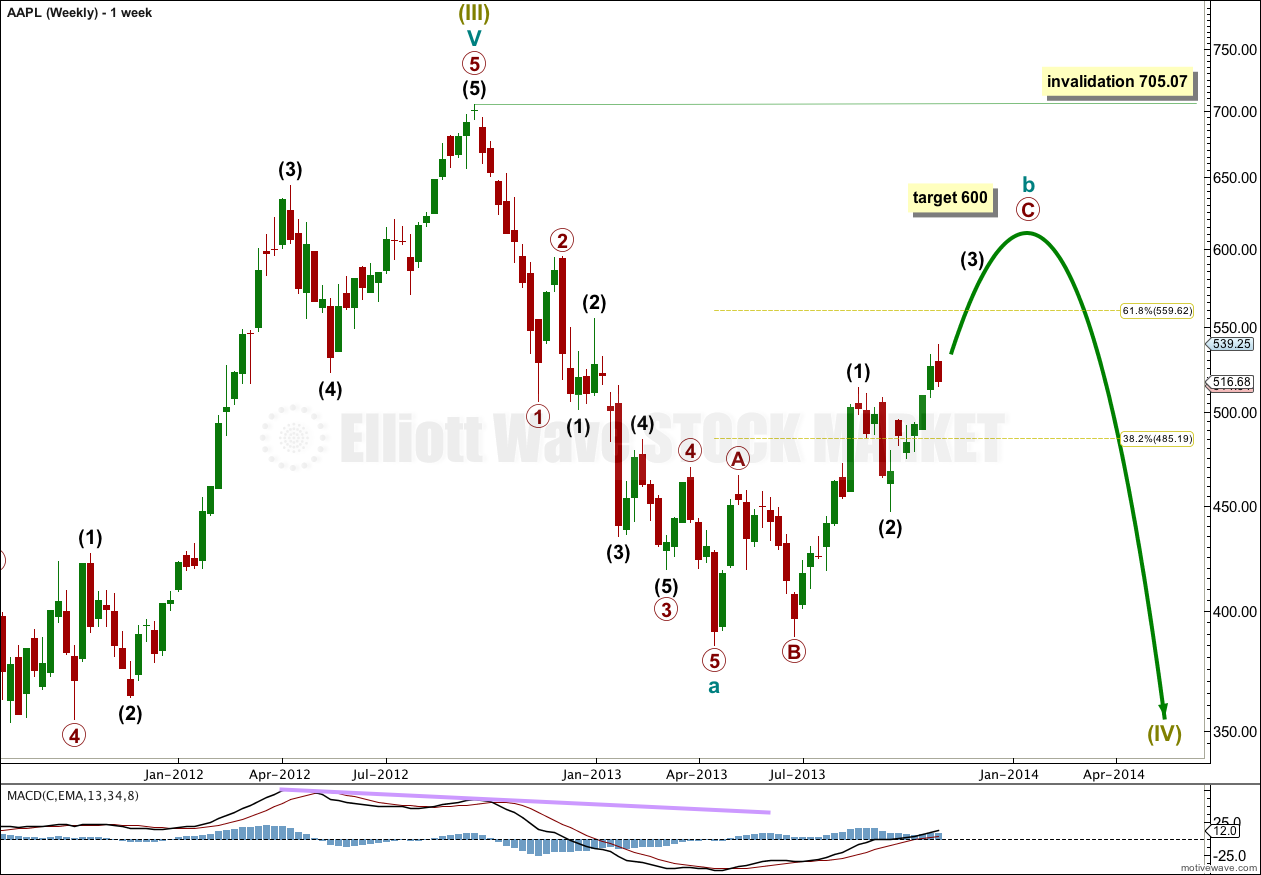
Apple technical analysis involves evaluating historical price action, trading volume, and statistical trends to forecast the future price movements of Apple Inc. (AAPL) stock. By analyzing chart patterns, moving averages, and momentum indicators rather than the company's fundamental financial health, traders aim to identify optimal entry and exit points, manage risk, and capitalize on short-to-medium-term market sentiment.
Understanding the Role of Technical Analysis in Stock Trading
Technical analysis operates on the core belief that market participants’ emotions and collective behavior are reflected in price movements over time. Unlike fundamental analysis, which examines Apple’s quarterly revenue, product cycle success, or supply chain efficiency, technical analysis assumes that all relevant information is already "priced in."
For an investor or trader, the primary goal is not to determine if Apple is a "good company" in terms of its business model, but rather to determine if the stock's current price trend is favorable for a long or short position. By applying mathematical models to historical data, traders identify support levels (price floors where buying interest is strong) and resistance levels (price ceilings where selling interest increases) to make data-driven decisions rather than emotional ones.
Core Indicators for Analyzing AAPL Price Trends
When performing a technical analysis on Apple, professional traders often employ a "confluence" approach, using multiple indicators to validate a signal. Relying on a single indicator often leads to "false breakouts," where the stock moves briefly in one direction before reversing.
Moving Averages (MA)
Moving averages smooth out price data to create a single flowing line, making it easier to identify the direction of the trend.
- 50-Day Moving Average (MA50): Used to identify intermediate-term trends. If the AAPL share price is trading consistently above the 50-day MA, the trend is generally considered bullish.
- 200-Day Moving Average (MA200): Often regarded as the "line in the sand" for long-term investors. A stock staying above the 200-day MA is typically viewed as being in a long-term uptrend.
- The "Golden Cross": A significant bullish signal that occurs when the 50-day MA crosses above the 200-day MA, suggesting upward momentum. Conversely, a "Death Cross" (50-day crossing below 200-day) signals a potential long-term downturn.
Relative Strength Index (RSI)
The RSI is a momentum oscillator that measures the speed and change of price movements on a scale of 0 to 100.
- Overbought (Above 70): Suggests that the stock may have risen too quickly and could be due for a pullback or consolidation.
- Oversold (Below 30): Suggests that the stock may be undervalued in the short term and could be poised for a bounce.
Volume Analysis
Volume is the number of shares traded in a given period. It serves as the "fuel" for price movements. A significant price increase accompanied by high volume confirms the trend’s strength, whereas a price increase on low volume often indicates a lack of conviction, suggesting that the move may not be sustainable.
Comparative Technical Indicators
The following table summarizes common indicators used by analysts to evaluate Apple’s market position:
| Indicator | Primary Purpose | Signal Interpretation |
|---|---|---|
| Moving Averages | Trend identification | Above = Bullish; Below = Bearish |
| RSI (14-day) | Momentum measurement | >70 = Overbought; <30 = Oversold |
| MACD | Trend reversals | Crossover of lines indicates momentum shift |
| Bollinger Bands | Volatility tracking | Touches outer bands suggest potential reversal |
| Volume (OBV) | Trend confirmation | High volume confirms price moves |
Identifying Support and Resistance Levels
Support and resistance are psychological barriers that represent the collective memory of the market. Because Apple is one of the most widely traded stocks globally, these levels are often reinforced by high-frequency trading algorithms and institutional investors.
- Support: These are price levels where previous buying activity was strong enough to overcome selling pressure. If Apple’s stock price drops toward a historical support level, technical analysts watch for "buy-side" volume, indicating that institutional investors are stepping in to accumulate shares.
- Resistance: These are price levels where selling pressure historically exceeds buying interest. If AAPL struggles to break through a resistance level, it may indicate that the market feels the stock is temporarily overvalued or that sellers are taking profits.
When a resistance level is broken with significant volume, it often becomes a new support level. This transition is known as "polarity," and it is a key concept in developing high-probability trade setups.
Practical Steps for Conducting Your Own Analysis
To begin your technical analysis of Apple, you must use a reliable charting platform—such as TradingView, Thinkorswim, or Bloomberg Terminal—which provides real-time data and drawing tools.
- Set Your Timeframe: Decide if you are a day trader (intraday charts), a swing trader (daily/weekly charts), or a long-term investor (monthly charts).
- Clean Your Chart: Start with a "clean" price chart (candlestick format). Add your 50-day and 200-day moving averages to establish the macro trend.
- Draw Trendlines: Connect the lows of an uptrend or the highs of a downtrend. A trendline that connects three or more points is considered more valid and reliable than one connecting only two.
- Check Momentum: Add the RSI indicator to the bottom of the chart to see if the current price move is overextended.
- Look for Patterns: Identify classic chart patterns such as "Head and Shoulders" (reversal), "Bull Flags" (continuation), or "Double Bottoms" (reversal).
- Verify with Volume: Always ensure that your identified breakout or reversal is backed by a spike in trading volume.
Avoiding Common Analytical Pitfalls
The primary danger in technical analysis is "confirmation bias," where an analyst looks only for data that supports their pre-existing belief about the stock. It is critical to look for evidence that contradicts your view. If you are bullish on Apple, look specifically for reasons why the stock might fail to reach your target price.
Another common mistake is "over-analysis." Adding too many indicators to a single chart can lead to "analysis paralysis," where conflicting signals make it impossible to execute a trade. Stick to a small, consistent set of indicators that you understand deeply.
Finally, remember that technical analysis is a game of probabilities, not certainties. Even the most perfect chart setup can fail due to unexpected macroeconomic news, such as changes in interest rates or supply chain disruptions, which are "fundamental" factors that can override technical signals instantly.
Frequently Asked Questions
1. Does technical analysis work for a blue-chip stock like Apple? Yes. Because Apple has high liquidity and a massive number of daily trades, the stock tends to respect technical patterns more reliably than small-cap stocks, which can be easily manipulated by low volume.
2. Should I ignore fundamental analysis entirely? No. While pure technical traders ignore fundamentals, most successful investors use technical analysis to find when to buy, while using fundamental analysis to decide what to buy.
3. What is the best timeframe for analyzing Apple? It depends on your goal. Day traders use 5-minute or 15-minute charts. Swing traders typically prefer daily charts, as they provide the most reliable signals for moves that last several days or weeks.
4. Can I use technical analysis to predict Apple's earnings impact? Technical analysis is not designed to predict the outcome of earnings reports, as these events represent "black swan" shocks that disrupt price trends. Many traders prefer to stay flat (avoid positions) during earnings announcements.
5. How do I know if an indicator signal is a "false breakout"? A false breakout often lacks volume support. If the price breaks through resistance but volume remains flat or decreases, there is a high probability that the breakout is artificial and the price will revert.
6. Are there specific patterns common to Apple? Apple frequently exhibits "mean reversion" patterns, where the stock price pulls back to its 50-day or 200-day moving average after an extended rally. Traders often use these moving averages as entry points for "buy the dip" strategies.
Strategic Recommendations
For those looking to incorporate technical analysis into their Apple stock strategy, start by monitoring the interaction between the price and the 200-day moving average. For long-term holders, any approach to this line is often viewed as a historical buying opportunity. For active traders, focus on "breakouts" of previous all-time highs, but ensure they are validated by a surge in volume.
Always define your risk before entering a trade. Use "stop-loss" orders based on technical support levels to ensure that if the price action moves against your hypothesis, you can exit the position with a predefined, manageable loss. Technical analysis is a skill developed through consistent practice and discipline; maintain a trading journal to track why you entered a position and what the technical indicator was telling you at that moment.