Understanding Apple Inc.'s financial statements involves navigating the standardized reports filed with the U.S. Securities and Exchange Commission (SEC), primarily through the Form 10-K and Form 10-Q. These documents reveal how the company generates revenue through its diverse hardware and services ecosystem, manages its massive cash reserves, and allocates capital to research, development, and shareholder returns.
Understanding the Regulatory Landscape: The SEC Filings
To analyze Apple's performance, investors and analysts rely on the mandatory disclosures required by the U.S. Securities and Exchange Commission. The most critical document is the Form 10-K, an annual report that provides a comprehensive overview of the company's business and financial condition. Unlike the glossy annual reports intended for marketing purposes, the 10-K is a strictly regulated document containing audited financial statements, a detailed discussion of risk factors, and legal proceedings.
In addition to the annual 10-K, Apple files Form 10-Q reports quarterly. These provide a snapshot of the company's interim financial results, allowing stakeholders to track short-term trends in product demand, supply chain efficiency, and currency fluctuations. For immediate material events, such as a major acquisition or a change in executive leadership, Apple files a Form 8-K. Together, these documents form the bedrock of transparent financial analysis.
The Three Pillars of Financial Statements
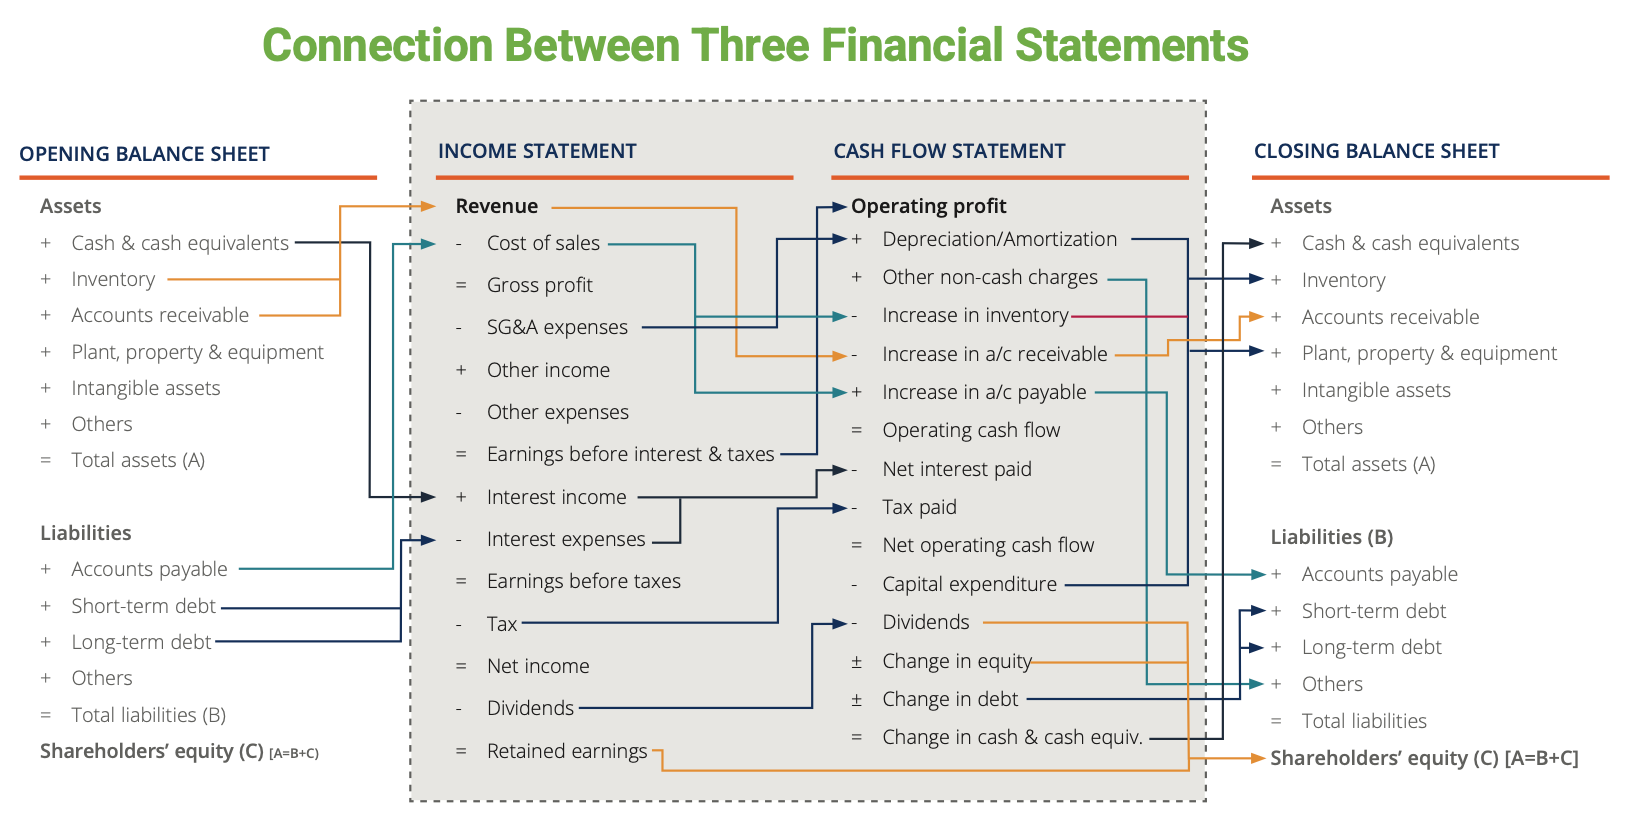
Every financial analysis of Apple begins with the three primary statements: the Balance Sheet, the Income Statement, and the Cash Flow Statement. Each provides a different perspective on the company’s health.
1. The Income Statement (Statement of Operations)
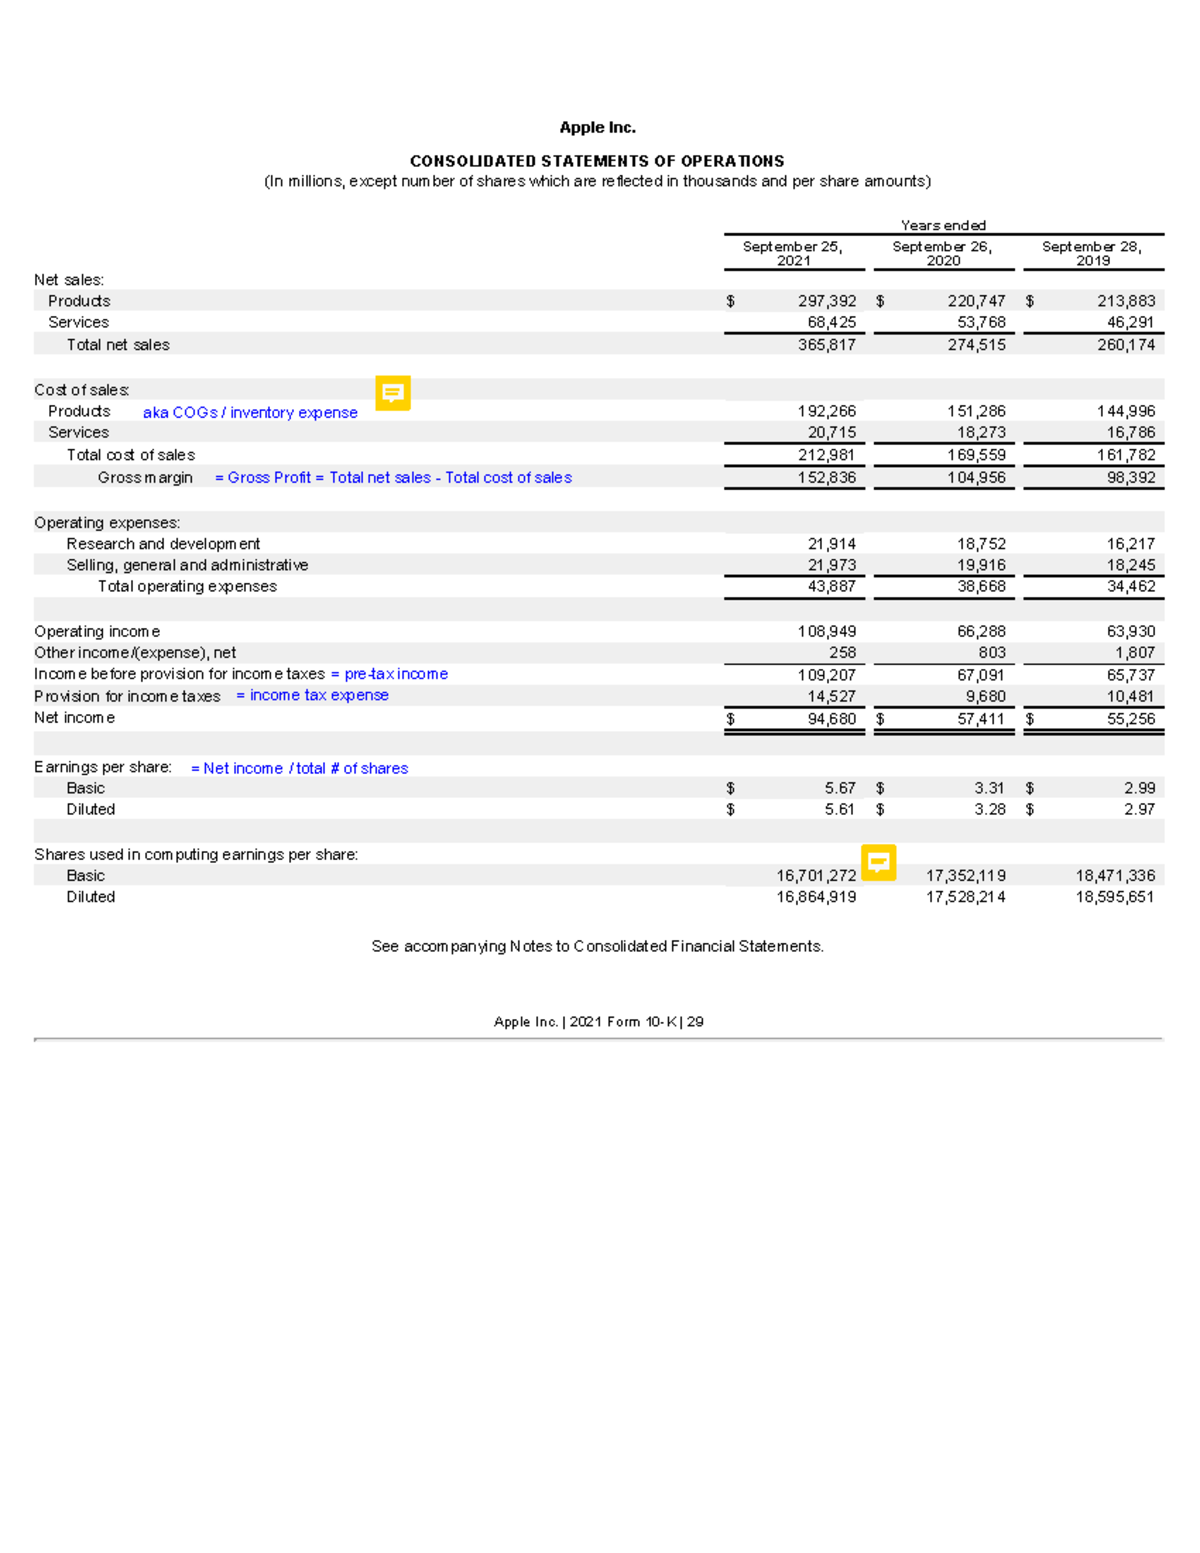
The Income Statement reveals Apple’s profitability over a specific period. It starts with Total Net Sales—the total dollar amount of products and services sold—and subtracts the Cost of Sales (COGS) to arrive at Gross Margin. This margin is a critical metric for analysts, as it reflects the company’s ability to command premium pricing for products like the iPhone, Mac, and Apple Watch.
Below the gross profit line, the statement lists Operating Expenses, including Research and Development (R&D) and Selling, General, and Administrative (SG&A) costs. By subtracting these from the gross profit, we arrive at Operating Income, which demonstrates the efficiency of Apple’s core business model before interest and taxes are considered.
2. The Balance Sheet
The Balance Sheet provides a "snapshot" of Apple’s financial position at a single point in time, organized by the accounting equation: Assets = Liabilities + Shareholders' Equity.
- Assets: These are categorized as current (cash, marketable securities, accounts receivable, and inventory) and non-current (property, plant, and equipment, and intangible assets).
- Liabilities: These include current obligations like accounts payable and accrued expenses, as well as long-term debt and deferred revenue.
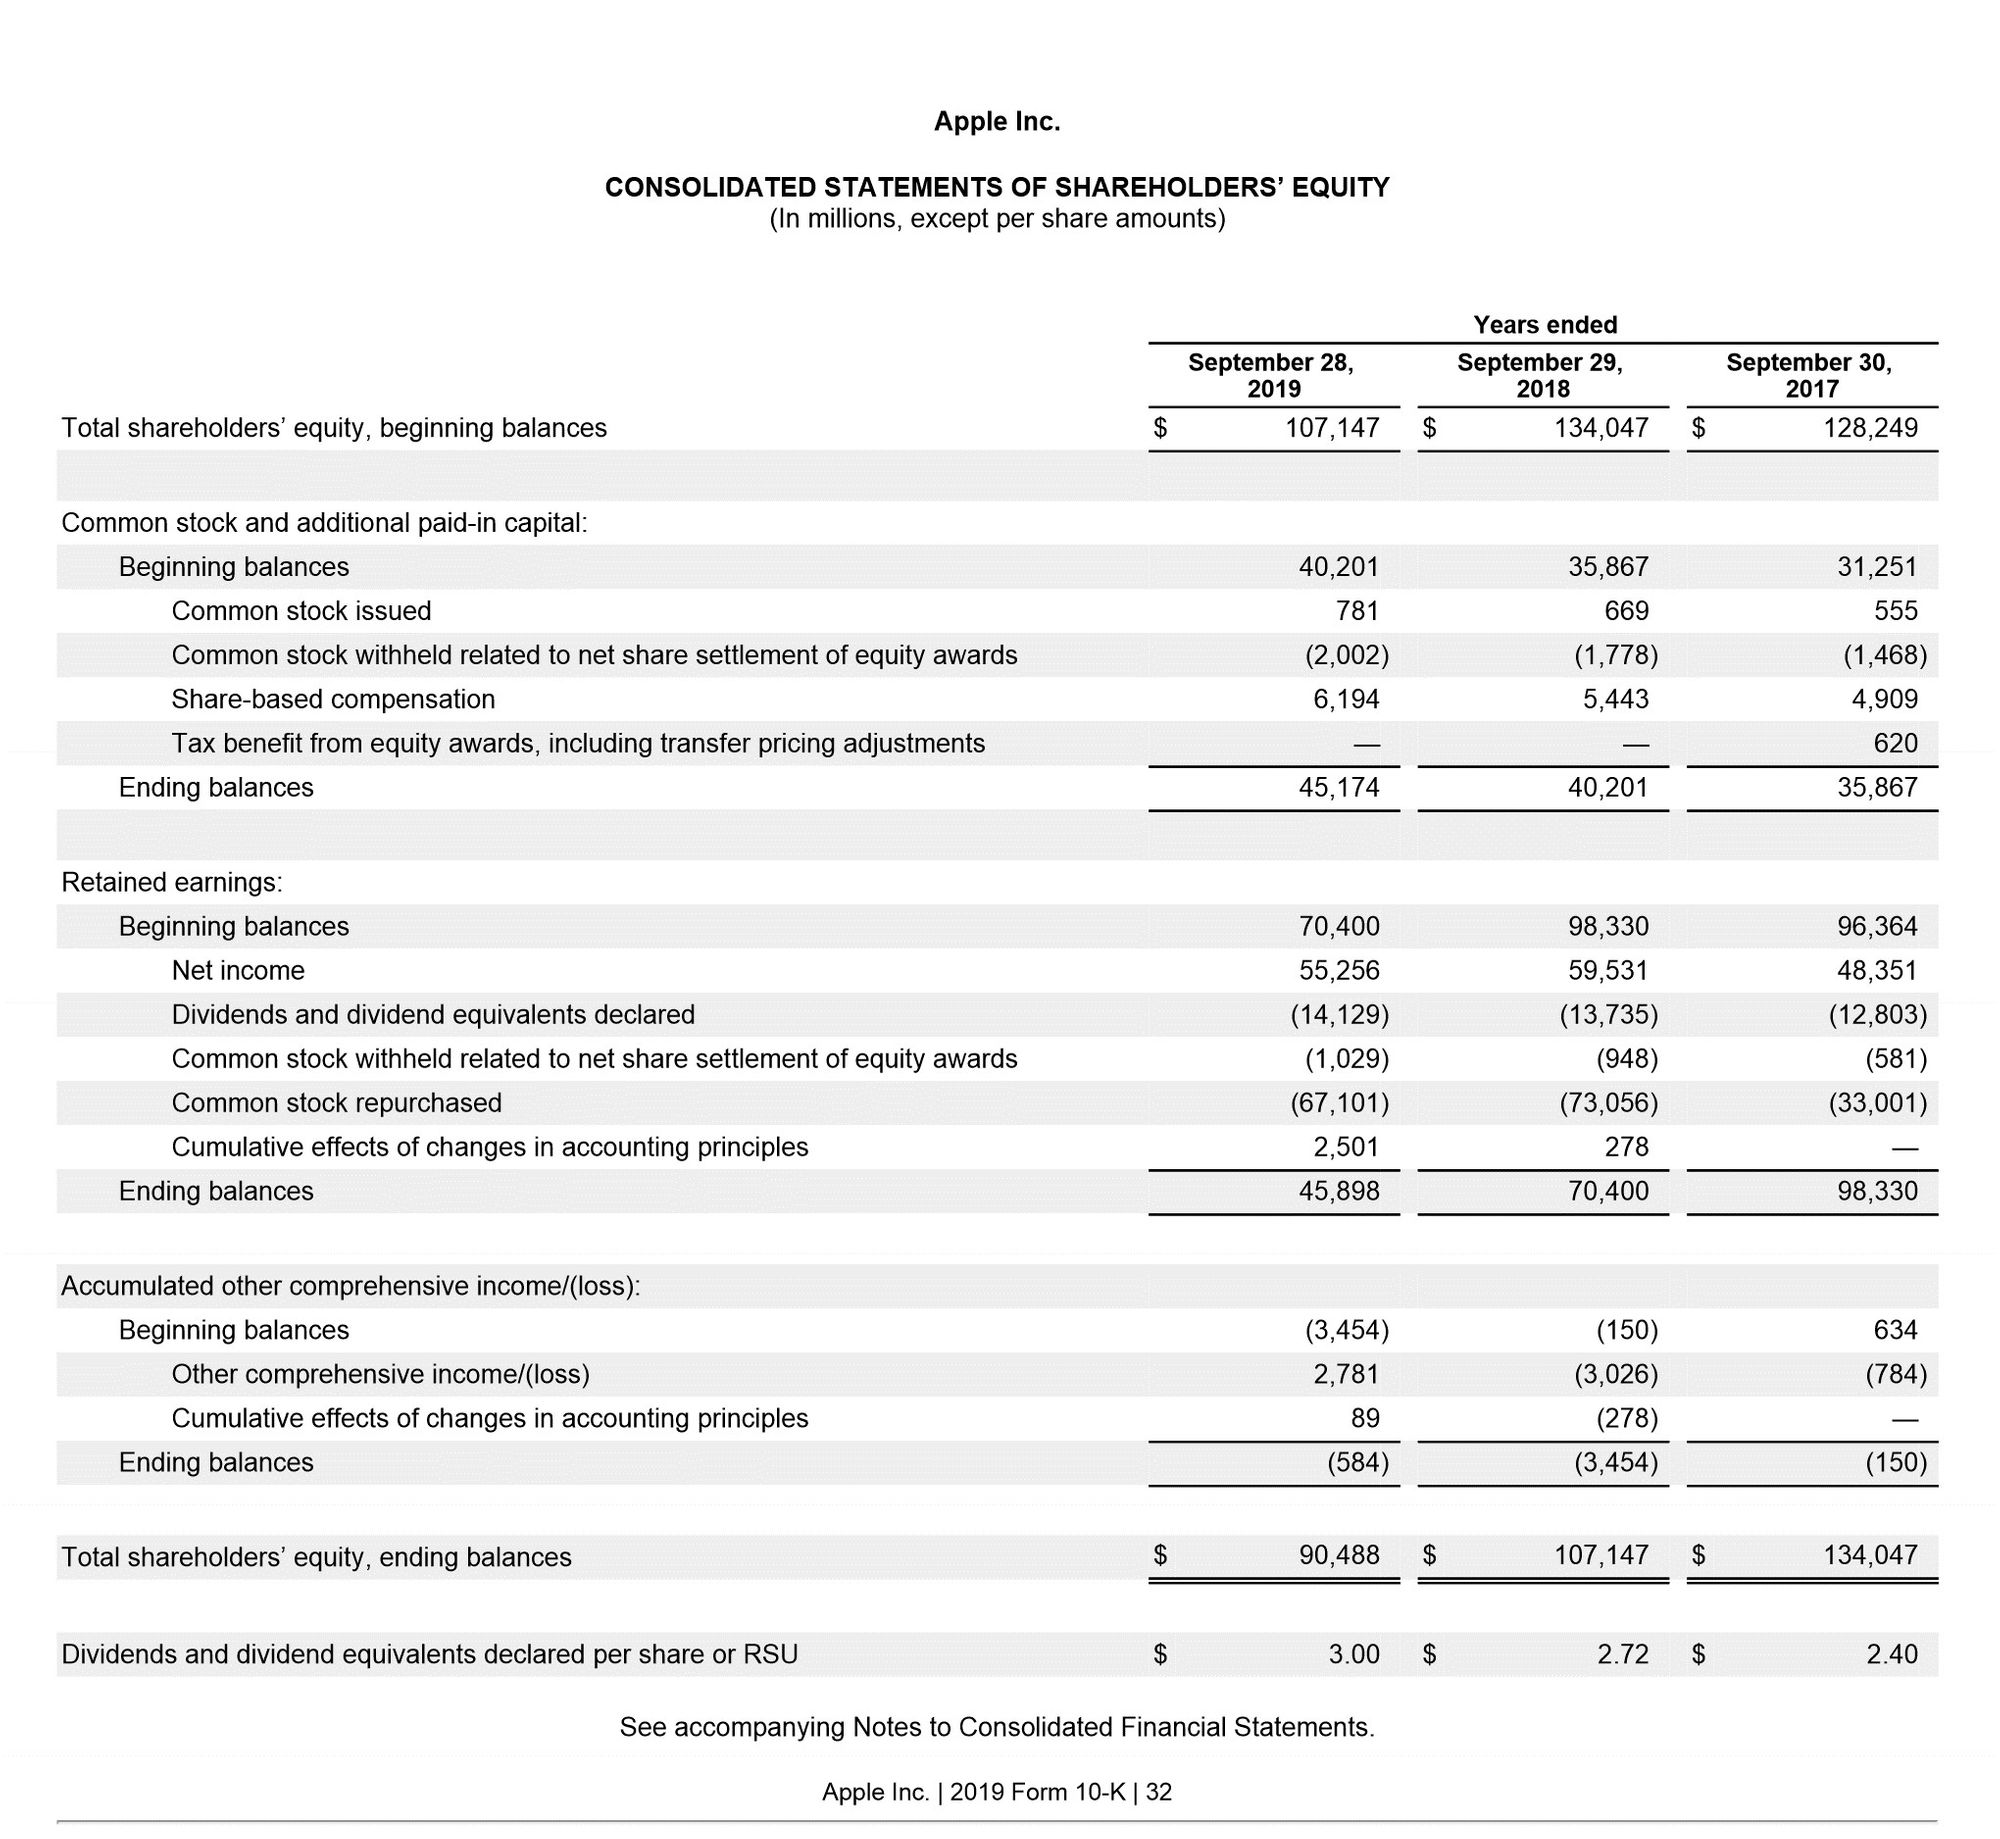
- Shareholders' Equity: This represents the net value belonging to the owners of the company after all liabilities have been paid off.
3. The Cash Flow Statement
Perhaps the most scrutinized document for Apple investors is the Cash Flow Statement. It reconciles the net income to the actual cash generated by the business. It is divided into three sections:
- Operating Activities: Cash generated from daily business operations.
- Investing Activities: Cash used for capital expenditures (CapEx), such as building data centers or purchasing manufacturing equipment, and the buying/selling of marketable securities.
- Financing Activities: Cash flows related to debt issuance, dividend payments, and, most notably for Apple, aggressive share repurchase programs.
Key Financial Metrics and Ratios
When evaluating these statements, seasoned analysts look for specific indicators that define Apple’s unique market position.
Gross Margin Trends
Apple maintains a high gross margin by controlling its hardware, software, and silicon design. When reviewing statements, analysts look at the shift between "Products" and "Services" margins. As the Services segment (App Store, iCloud, Music, Apple Pay) continues to grow, it often exerts a different pressure on total gross margin compared to the more volatile hardware cycles.
Operating Leverage
Apple’s ability to scale revenue faster than its operating expenses is a hallmark of its maturity. Investors analyze the Operating Margin to see if Apple is successfully managing its R&D spend—which remains high as the company explores new product categories—while maintaining cost discipline in SG&A.
Capital Allocation Strategy
Apple is known for its "net cash neutral" goal. The Cash Flow Statement is the primary tool to track how Apple achieves this. By reviewing "Cash used for dividends" and "Cash used for repurchases of common stock," an investor can determine how the company balances returning value to shareholders versus reinvesting in the business through acquisitions or internal innovation.
Comparison Table: Key Financial Components
| Component | Primary Purpose | Analyst Focus |
|---|---|---|
| Net Sales | Revenue generation measurement | Year-over-year growth rates |
| Gross Margin | Cost efficiency of sales | Pricing power and production costs |
| Cash & Cash Equivalents | Liquidity and solvency | Ability to fund operations and R&D |
| Long-Term Debt | Capital structure | Leverage ratios and interest coverage |
| Operating Cash Flow | Core business vitality | Self-funding capability |
| Share Repurchases | Capital return policy | Impact on Earnings Per Share (EPS) |
The Role of Segment Reporting
Apple breaks down its financial performance by geographic region and product category. Understanding these segments is vital for diagnosing regional economic health and product lifecycle performance.
Product Segments
- iPhone: Historically the largest revenue driver; analysts track unit growth and average selling price (ASP).
- Services: Includes subscriptions and digital content. This segment generally carries higher margins than hardware.
- Wearables, Home, and Accessories: Represents the ecosystem integration strategy, such as Apple Watch and AirPods.
- Mac and iPad: Often driven by enterprise demand and educational cycles.
Geographic Segments
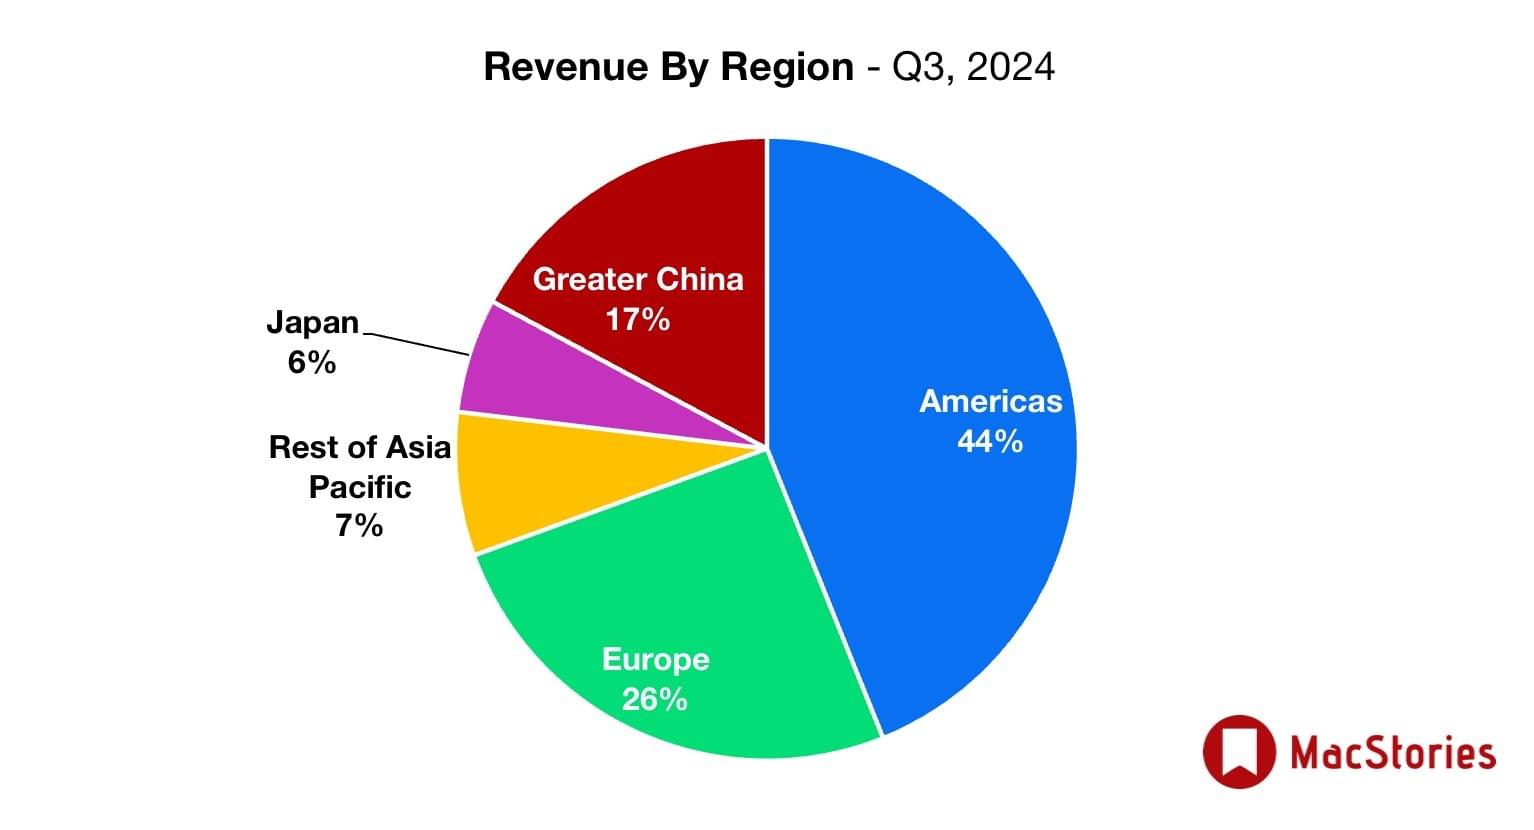
Apple reports performance across the Americas, Europe, Greater China, Japan, and the Rest of Asia Pacific. By comparing these segments, an investor can determine if geopolitical tensions or regional economic downturns are disproportionately affecting specific markets, which is a frequent topic in the "Management’s Discussion and Analysis" (MD&A) section of the 10-K.
Common Pitfalls for New Analysts
Analyzing a company the size of Apple presents specific challenges. One common mistake is over-focusing on a single quarter's revenue without considering the seasonal nature of Apple’s product launches. Apple’s fiscal year often results in the December quarter being the most significant due to holiday sales.
Another mistake is ignoring the deferred revenue line. Because Apple often bundles software and services with hardware, they cannot recognize all revenue immediately. Understanding how this balance sheet item converts to the income statement is essential for predicting future earnings quality.
Furthermore, investors must pay attention to Foreign Exchange (FX) impact. As a global company, Apple’s reported earnings are heavily influenced by the strength or weakness of the U.S. dollar against currencies like the Euro, Yen, and Yuan. Apple usually addresses these impacts in its quarterly conference call transcripts and the MD&A section of its filings.
How to Access Apple’s Financial Reports
Apple publishes all its regulatory filings on its dedicated investor relations website. Users do not need special access or subscriptions to view these documents.
- Navigate to the Apple Investor Relations website.
- Locate the "SEC Filings" section.
- Filter by document type (e.g., 10-K for annual, 10-Q for quarterly).
- Download the document in PDF or XBRL (eXtensible Business Reporting Language) format.
XBRL is particularly useful for advanced users, as it allows for the extraction of data directly into spreadsheet software for custom modeling and historical trend analysis.
Frequently Asked Questions (FAQ)
Where can I find the most recent Apple financial data?
The most reliable source is the SEC EDGAR database or the Apple Investor Relations portal. These sites provide the official, audited filings directly from the company.
Does Apple pay a dividend?
Yes. Apple has a long-standing capital return program that includes regular cash dividends. Details on the dividend payout ratio and history are found in the "Management’s Discussion and Analysis" and the "Cash Flow from Financing Activities" sections of their reports.
What is the difference between "Cash" and "Marketable Securities"?
On Apple’s balance sheet, "Cash" refers to liquid funds in bank accounts. "Marketable Securities" are highly liquid investments (like government bonds) that Apple holds to earn interest on its excess capital. These are considered highly liquid and are included when calculating Apple’s total "liquidity" position.
How do I analyze Apple’s R&D effectiveness?
R&D effectiveness is difficult to quantify directly from the income statement. However, analysts typically compare the growth in R&D expenses against the growth in new product categories or the expansion of the Services ecosystem to see if the investment is yielding long-term revenue diversification.
Is Apple’s debt a cause for concern?
Apple manages a significant amount of long-term debt, but its massive cash position and strong operating cash flow allow it to maintain a robust interest coverage ratio. Analysts generally view this debt as a tool to optimize capital structure rather than a sign of financial distress.
Final Recommendation
To gain a comprehensive understanding of Apple’s financial health, begin by reading the "Management’s Discussion and Analysis of Financial Condition and Results of Operations" (MD&A) in the most recent 10-K. This section provides the narrative behind the numbers, offering insights into the strategic reasons for growth or decline. After reading the MD&A, verify the trends by reviewing the primary statements, specifically looking for changes in operating cash flow and capital expenditure. Always cross-reference the annual report with the most recent 10-Q to ensure your analysis accounts for the latest market conditions.
Disclaimer: This guide is for educational purposes only and does not constitute financial, investment, or legal advice. Always consult with a qualified professional before making investment decisions based on financial filings.