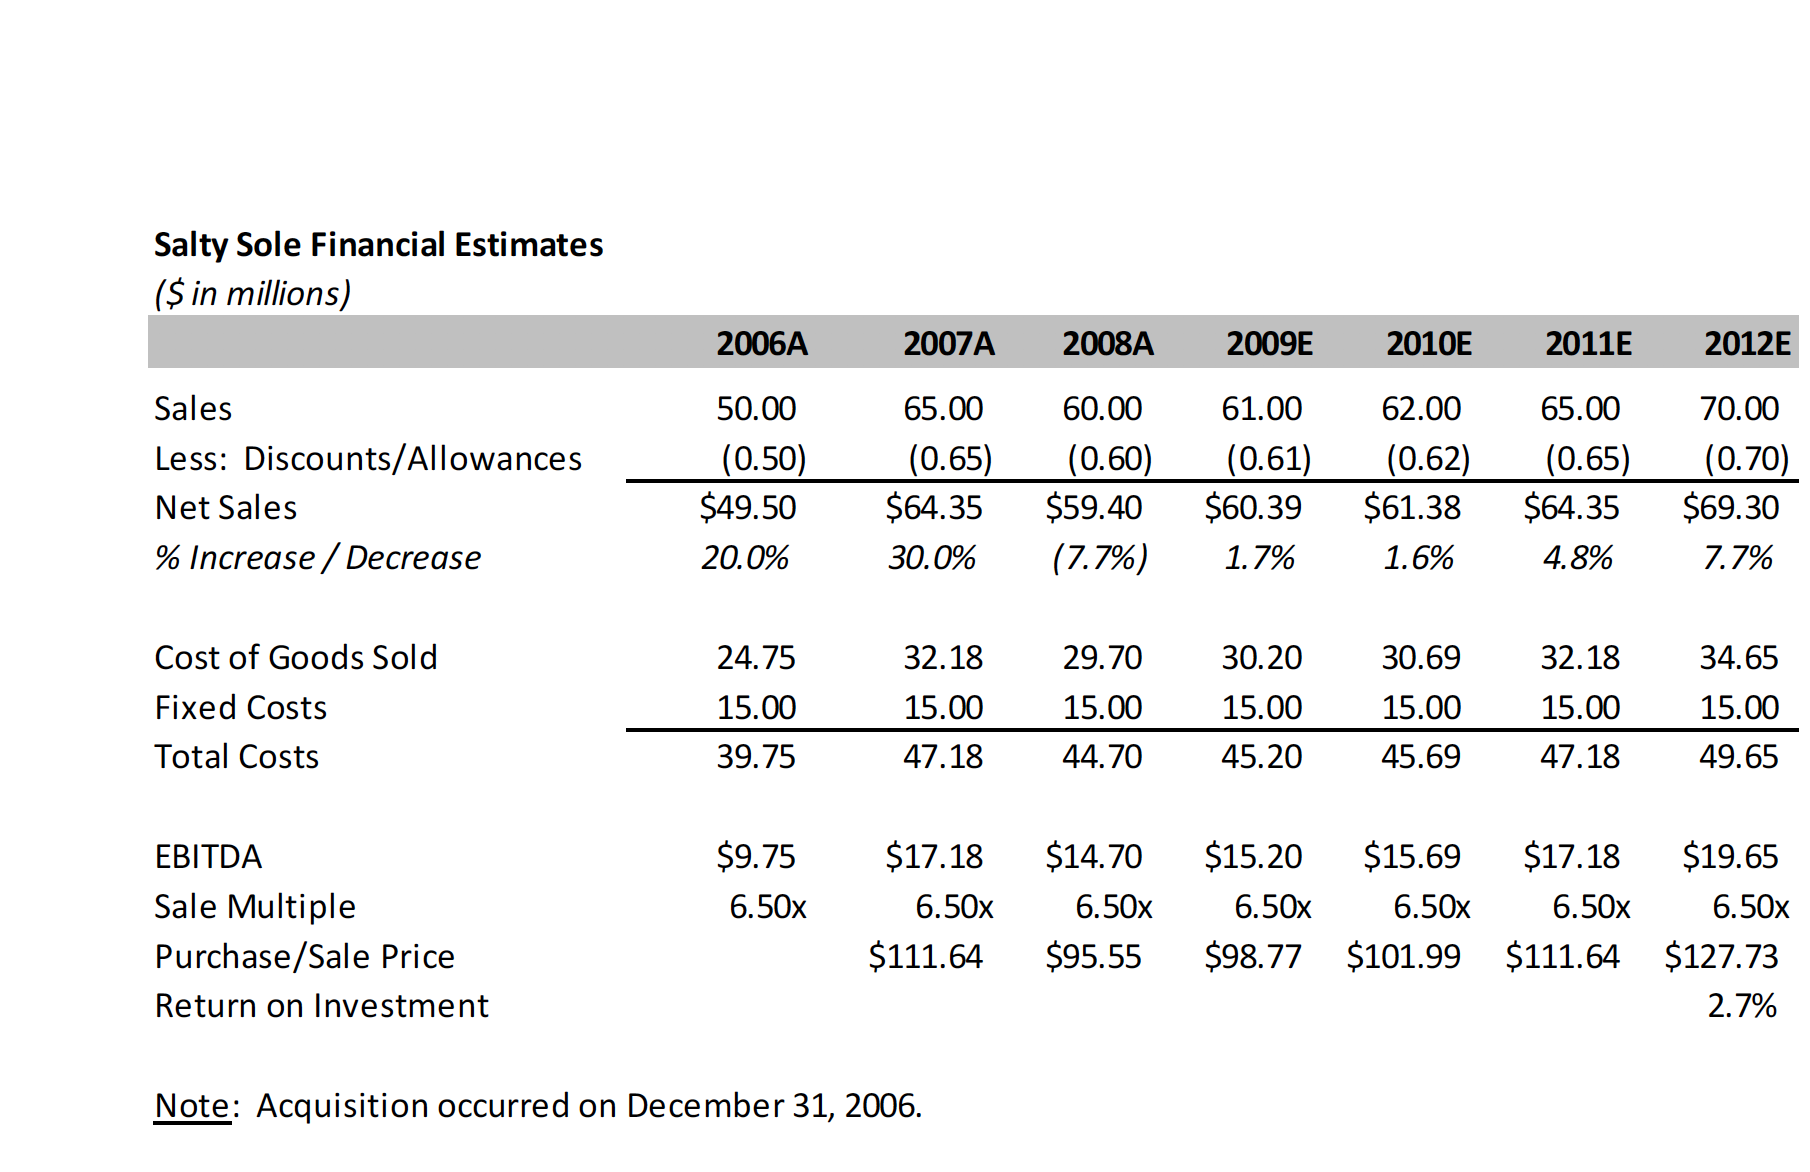
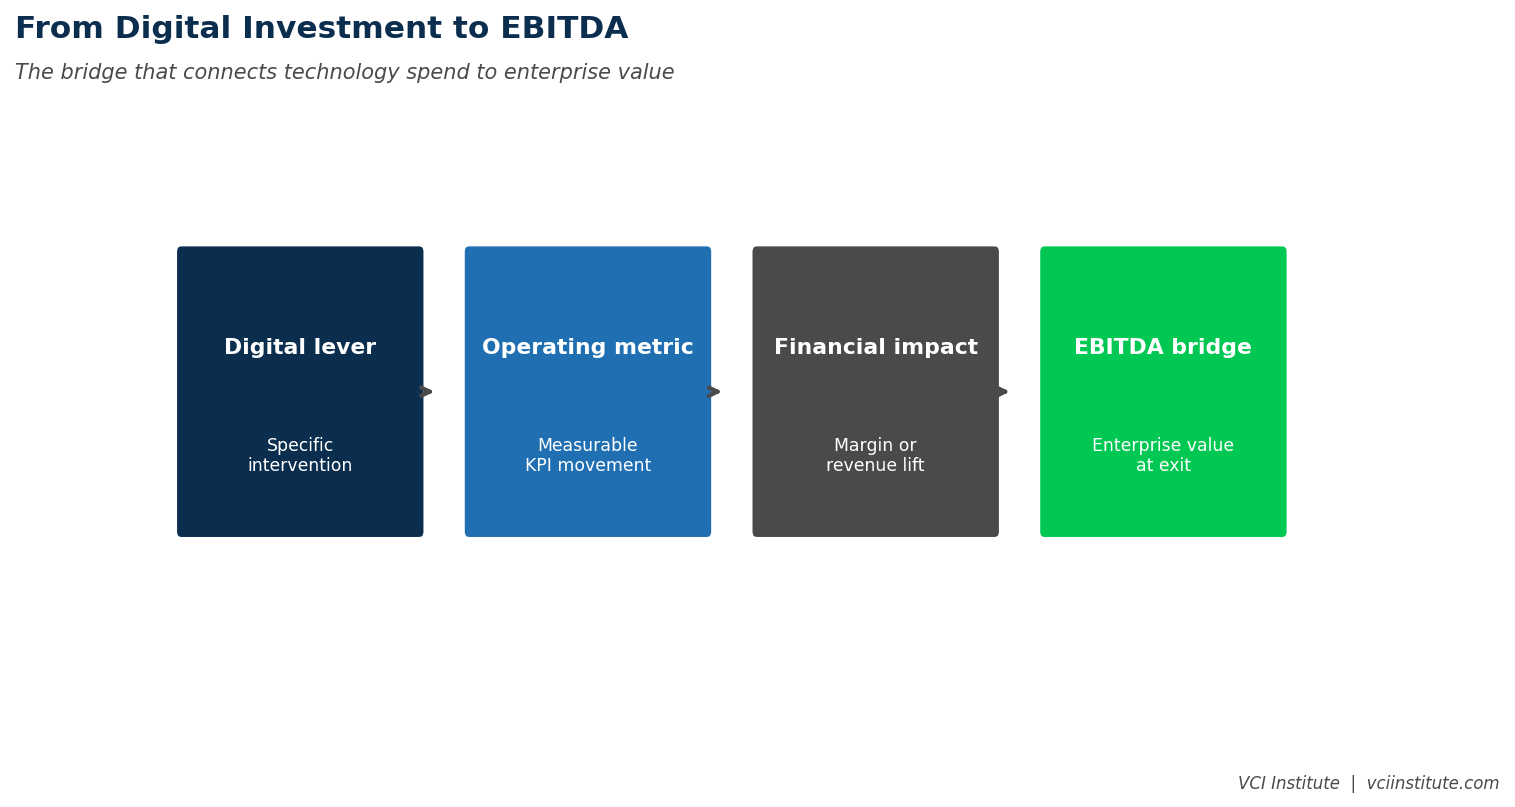
The Enterprise Value to EBITDA (EV/EBITDA) ratio is a cornerstone valuation metric used to determine the fair market value of a business by comparing its total acquisition cost to its operational cash flow. In practice, a "rule" for this ratio is not a single fixed number, but rather a benchmark range adjusted for industry growth, capital structure, and economic cycles.
Understanding the Components of EV/EBITDA
To apply a practical rule for EV/EBITDA, one must first deconstruct the two core components: Enterprise Value (EV) and Earnings Before Interest, Taxes, Depreciation, and Amortization (EBITDA).
Enterprise Value serves as a theoretical takeover price. It is calculated by taking the market capitalization of a company, adding its total debt, subtracting cash and cash equivalents, and accounting for minority interests or preferred shares. Essentially, it represents what an acquirer would pay to purchase the entire company, including the assumption of its debt obligations.
EBITDA acts as a proxy for operational cash flow. By stripping away the impacts of financing decisions (interest), government mandates (taxes), and accounting treatments of long-term assets (depreciation and amortization), EBITDA provides a clean view of a company's ability to generate cash from its core business operations. The ratio, therefore, allows investors to compare the valuation of different companies regardless of their capital structure or tax jurisdictions.
The Myth of the "Universal" Multiple
A common mistake among novice investors is searching for a universal "good" multiple—such as 8x or 10x—to apply to every business. In the financial markets of 2026, no such universal rule exists. Valuation is context-dependent. A tech startup in the software-as-a-service (SaaS) sector may trade at 20x EBITDA because of high projected growth rates, while a mature utility company may trade at 6x due to limited growth prospects and high capital requirements.
The "practical" rule is to use the Peer Group Median as your baseline. By identifying a set of comparable companies—those with similar business models, market capitalization, and geographic exposure—you can establish a baseline valuation range. If your target company trades significantly above the median of its peers, you must identify a "valuation premium" driver, such as superior profit margins, a competitive moat (like intellectual property), or industry-leading growth rates.
Industry-Specific Benchmarking
Industry characteristics heavily influence what constitutes a "fair" multiple. Capital-intensive industries often see lower multiples because a large portion of EBITDA must be reinvested into equipment and infrastructure. Conversely, asset-light businesses often command higher multiples due to their ability to scale without heavy capital expenditure.
| Industry Sector | Typical EV/EBITDA Range | Primary Drivers of Variance |
|---|---|---|
| Technology (SaaS) | 12x – 25x | Recurring revenue, scalability |
| Consumer Staples | 8x – 14x | Brand loyalty, stable demand |
| Energy/Oil & Gas | 5x – 9x | Commodity prices, reserve life |
| Healthcare/Biotech | 10x – 18x | R&D pipeline, patent exclusivity |
| Retail/Brick-and-Mortar | 4x – 8x | Foot traffic, inventory turnover |
Prerequisites for Accurate Ratio Analysis
Before relying on an EV/EBITDA ratio for investment or divestment decisions, you must ensure the data is normalized. Financial statements can be distorted by one-time events, accounting adjustments, or aggressive reporting.
- Normalized EBITDA: Adjust for non-recurring expenses such as litigation costs, restructuring charges, or unusual inventory write-downs. The goal is to see what the company generates in a "steady state."
- Consistent Capitalization: Ensure the Enterprise Value calculation includes all relevant debt equivalents, such as pension liabilities or long-term lease obligations (now largely captured under IFRS 16 and ASC 842 standards).
- Currency and Geographic Alignment: If comparing international companies, ensure all data is adjusted for currency fluctuations and local accounting standards.
Step-by-Step Execution of an EV/EBITDA Valuation
To perform a professional-grade valuation, follow these systematic steps to avoid common calculation errors:
Step 1: Gather Inputs Obtain the most recent balance sheet and income statement. Ensure you have the current stock price and total shares outstanding to calculate market capitalization.
Step 2: Calculate Enterprise Value Sum the market cap and total debt. Subtract the cash and cash equivalents reported on the balance sheet. Verify whether the company has minority interest or preferred stock that should be added back.
Step 3: Determine EBITDA Locate the Operating Income (EBIT) and add back Depreciation and Amortization. Ensure no other non-cash charges are buried in operating expenses that warrant an adjustment.
Step 4: Determine the Peer Multiple Identify at least 5–10 publicly traded companies that operate in the same niche. Calculate their EV/EBITDA ratios. Filter out outliers that have recently undergone a merger, restructuring, or bankruptcy, as these will skew the median.
Step 5: Apply the Multiple Multiply the target company’s EBITDA by the median peer multiple. This gives you an "implied enterprise value." Compare this to the company's current market value to determine if the target is undervalued or overvalued.
Common Mistakes and Troubleshooting
One of the most frequent errors is comparing "apples to oranges." For example, comparing a company with high debt to a company with zero debt using EV/EBITDA is technically sound due to the nature of the ratio, but you must account for the risk profile. A highly leveraged company with a high EV/EBITDA ratio may be closer to insolvency than its peers, even if the math suggests it is "fairly valued."
Another common failure point is the "Value Trap." A company may appear cheap (a low EV/EBITDA ratio) because the market expects its EBITDA to decline significantly in the future. Always cross-reference the ratio with revenue growth forecasts and margins. If the ratio is low, ask: "Is the market anticipating a secular decline in this business?"
Limitations of the Metric
While EV/EBITDA is highly effective, it is not a complete valuation toolkit. It fails to account for:
- Capital Expenditures (CapEx): Because it uses EBITDA rather than Free Cash Flow, it ignores the cost of maintaining the assets that generate the cash.
- Working Capital Requirements: A company that requires massive inventory investment to operate may look cheap on an EBITDA basis but actually be cash-starved.
- Non-Operating Assets: The ratio does not explicitly account for the value of real estate or non-core investments held by the firm.
Investors should always use EV/EBITDA in conjunction with Discounted Cash Flow (DCF) analysis and Price-to-Earnings (P/E) ratios to gain a holistic view of the company’s health.
Frequently Asked Questions
What does a high EV/EBITDA ratio mean? A high ratio typically suggests the market expects the company to grow its earnings rapidly in the future. Investors are willing to pay a premium for the company's anticipated ability to generate higher cash flows.
When is EV/EBITDA not appropriate to use? It is generally not suitable for companies with negative earnings or highly cyclical businesses where EBITDA is currently at an artificial peak or trough. In such cases, revenue-based multiples or asset-based valuation methods are preferred.
How does debt influence the EV/EBITDA ratio? Debt is included in the Enterprise Value (the numerator). As a company takes on more debt, its EV rises, which increases the EV/EBITDA ratio, assuming EBITDA remains constant. This naturally reflects the increased risk inherent in a highly levered firm.
Why add back depreciation and amortization? These are non-cash expenses. By adding them back, analysts can compare companies with different asset bases. A company that owns all its buildings has high depreciation, while a company that leases them does not; adding back depreciation removes this distortion.
What is a "good" EV/EBITDA ratio in 2026? There is no single number. However, across the S&P 500, a median range of 10x to 14x has historically served as a broad market baseline. Always check the specific sector median to avoid making investment errors based on inaccurate generalities.
Does EV/EBITDA account for taxes? No, it specifically excludes taxes. This makes it an excellent tool for comparing companies across different tax jurisdictions or those that have differing levels of tax-loss carryforwards.
Professional Recommendation
For your next analysis, start by establishing the "peer median" for your specific sub-sector. Do not rely on market-wide averages. Calculate the target company’s normalized EBITDA by stripping out at least two years of non-recurring events. Finally, perform a sensitivity analysis: calculate the implied value using a 10% lower and 10% higher multiple than the peer median to create a "valuation band." This range approach provides a safer margin for error than relying on a single, static number.