New Relic offers a SaaS-first, unified observability platform with usage-based pricing, making it ideal for teams seeking rapid deployment, extensive OpenTelemetry support, and flexible data ingestion. Cisco AppDynamics provides deep business transaction correlation, robust hybrid and on-premises deployment options, and tight integration with the Cisco enterprise ecosystem, catering primarily to large enterprises with complex compliance requirements.
Selecting between Application Performance Monitoring (APM) and full-stack observability platforms requires evaluating how each vendor handles telemetry data, system architecture, pricing metrics, and root-cause analysis. Both New Relic and Cisco AppDynamics have evolved from traditional APM solutions into comprehensive observability platforms, yet their underlying philosophies, pricing models, and deployment architectures target different enterprise needs.
Core Architectures and Deployment Models
Understanding the deployment architecture of an observability platform is essential for technical leadership, as it impacts data governance, network overhead, and administrative maintenance.
| Cisco AppDynamics | New Relic |
|---|---|
| [Hybrid / On-Prem / SaaS]- Enterprise Controllers- Bytecode Agent Diagnostics- Strict Network Governance | [Pure Cloud-Native SaaS]- Telemetry Data Platform (TDP)- OpenTelemetry Native Ingestion- Universal Agent & Open Ingest |
Cisco AppDynamics Architecture
Cisco AppDynamics is built around an architecture designed for high-security environments and enterprise governance. It uses a tiered system comprising language-specific application agents, machine agents, database agents, and an orchestration module known as the Controller.
AppDynamics provides two main deployment architectures:
- SaaS Controller: Hosted and managed by Cisco, allowing teams to offload platform operations while retaining control over agent installations.
- On-Premises Controller: Self-hosted within a private data center or private cloud instance. This option allows organizations with strict data residency policies, such as financial institutions or government entities, to keep all telemetry data within their network perimeter.
AppDynamics agents perform heavy local processing and bytecode instrumentation. They map execution flows locally before transmitting structured data back to the Controller, minimizing data transfer volume over the network.
New Relic Architecture
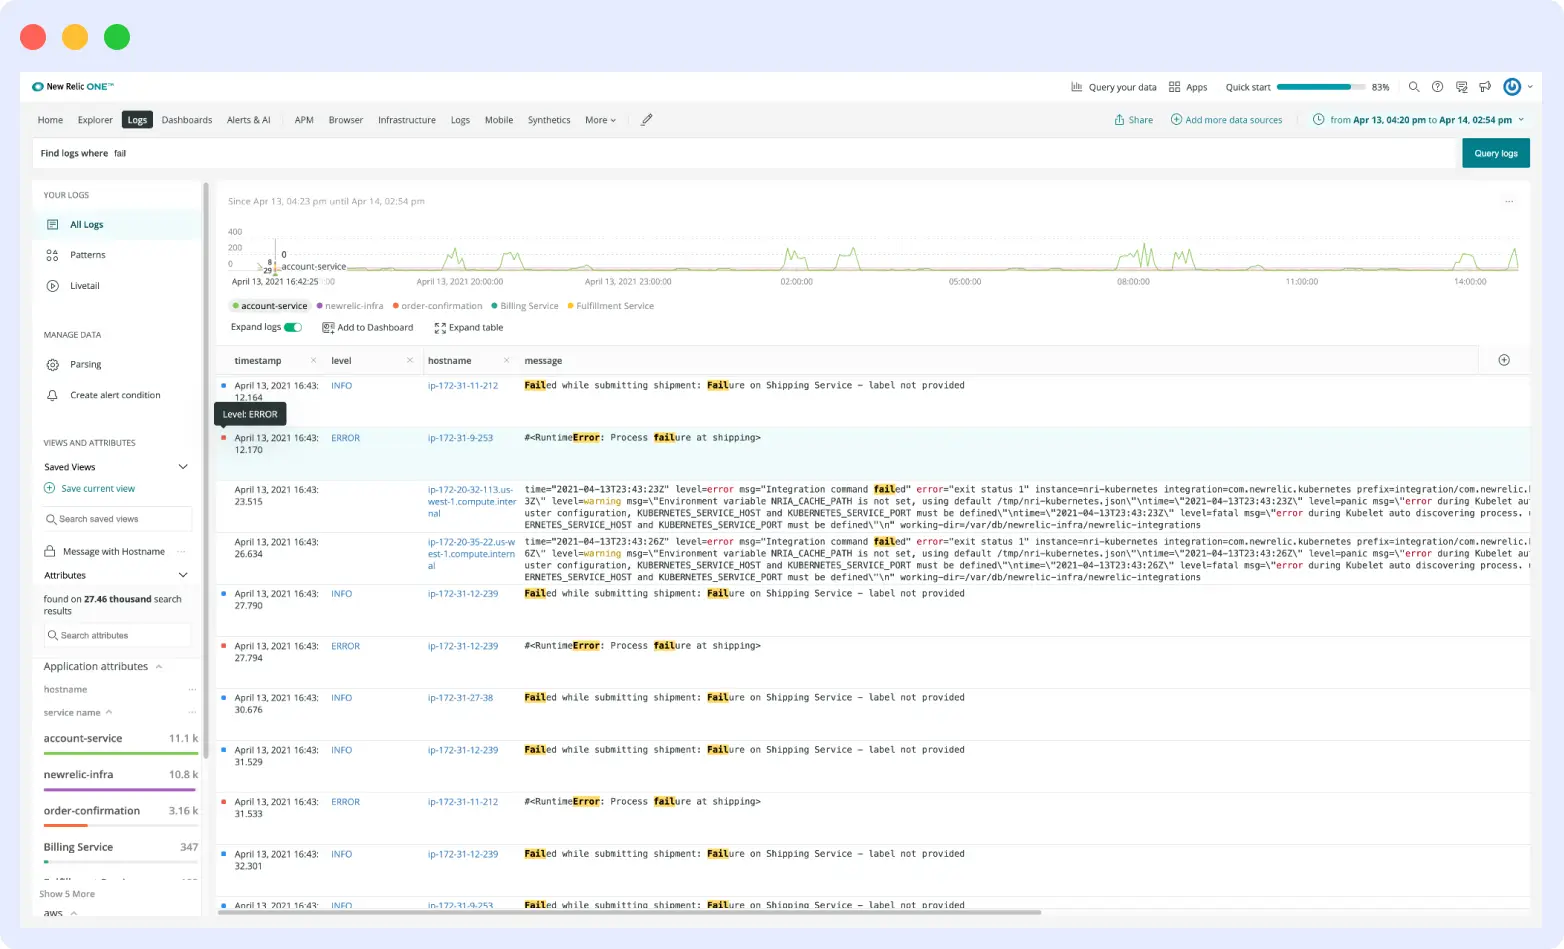
New Relic operates exclusively as a cloud-native Software-as-a-Service (SaaS) platform, centered around its Telemetry Data Platform (TDP). Instead of requiring complex controller management, New Relic ingests raw metrics, events, logs, and traces (MELT data) directly into a high-throughput, multi-tenant database using the custom NRDB query engine.
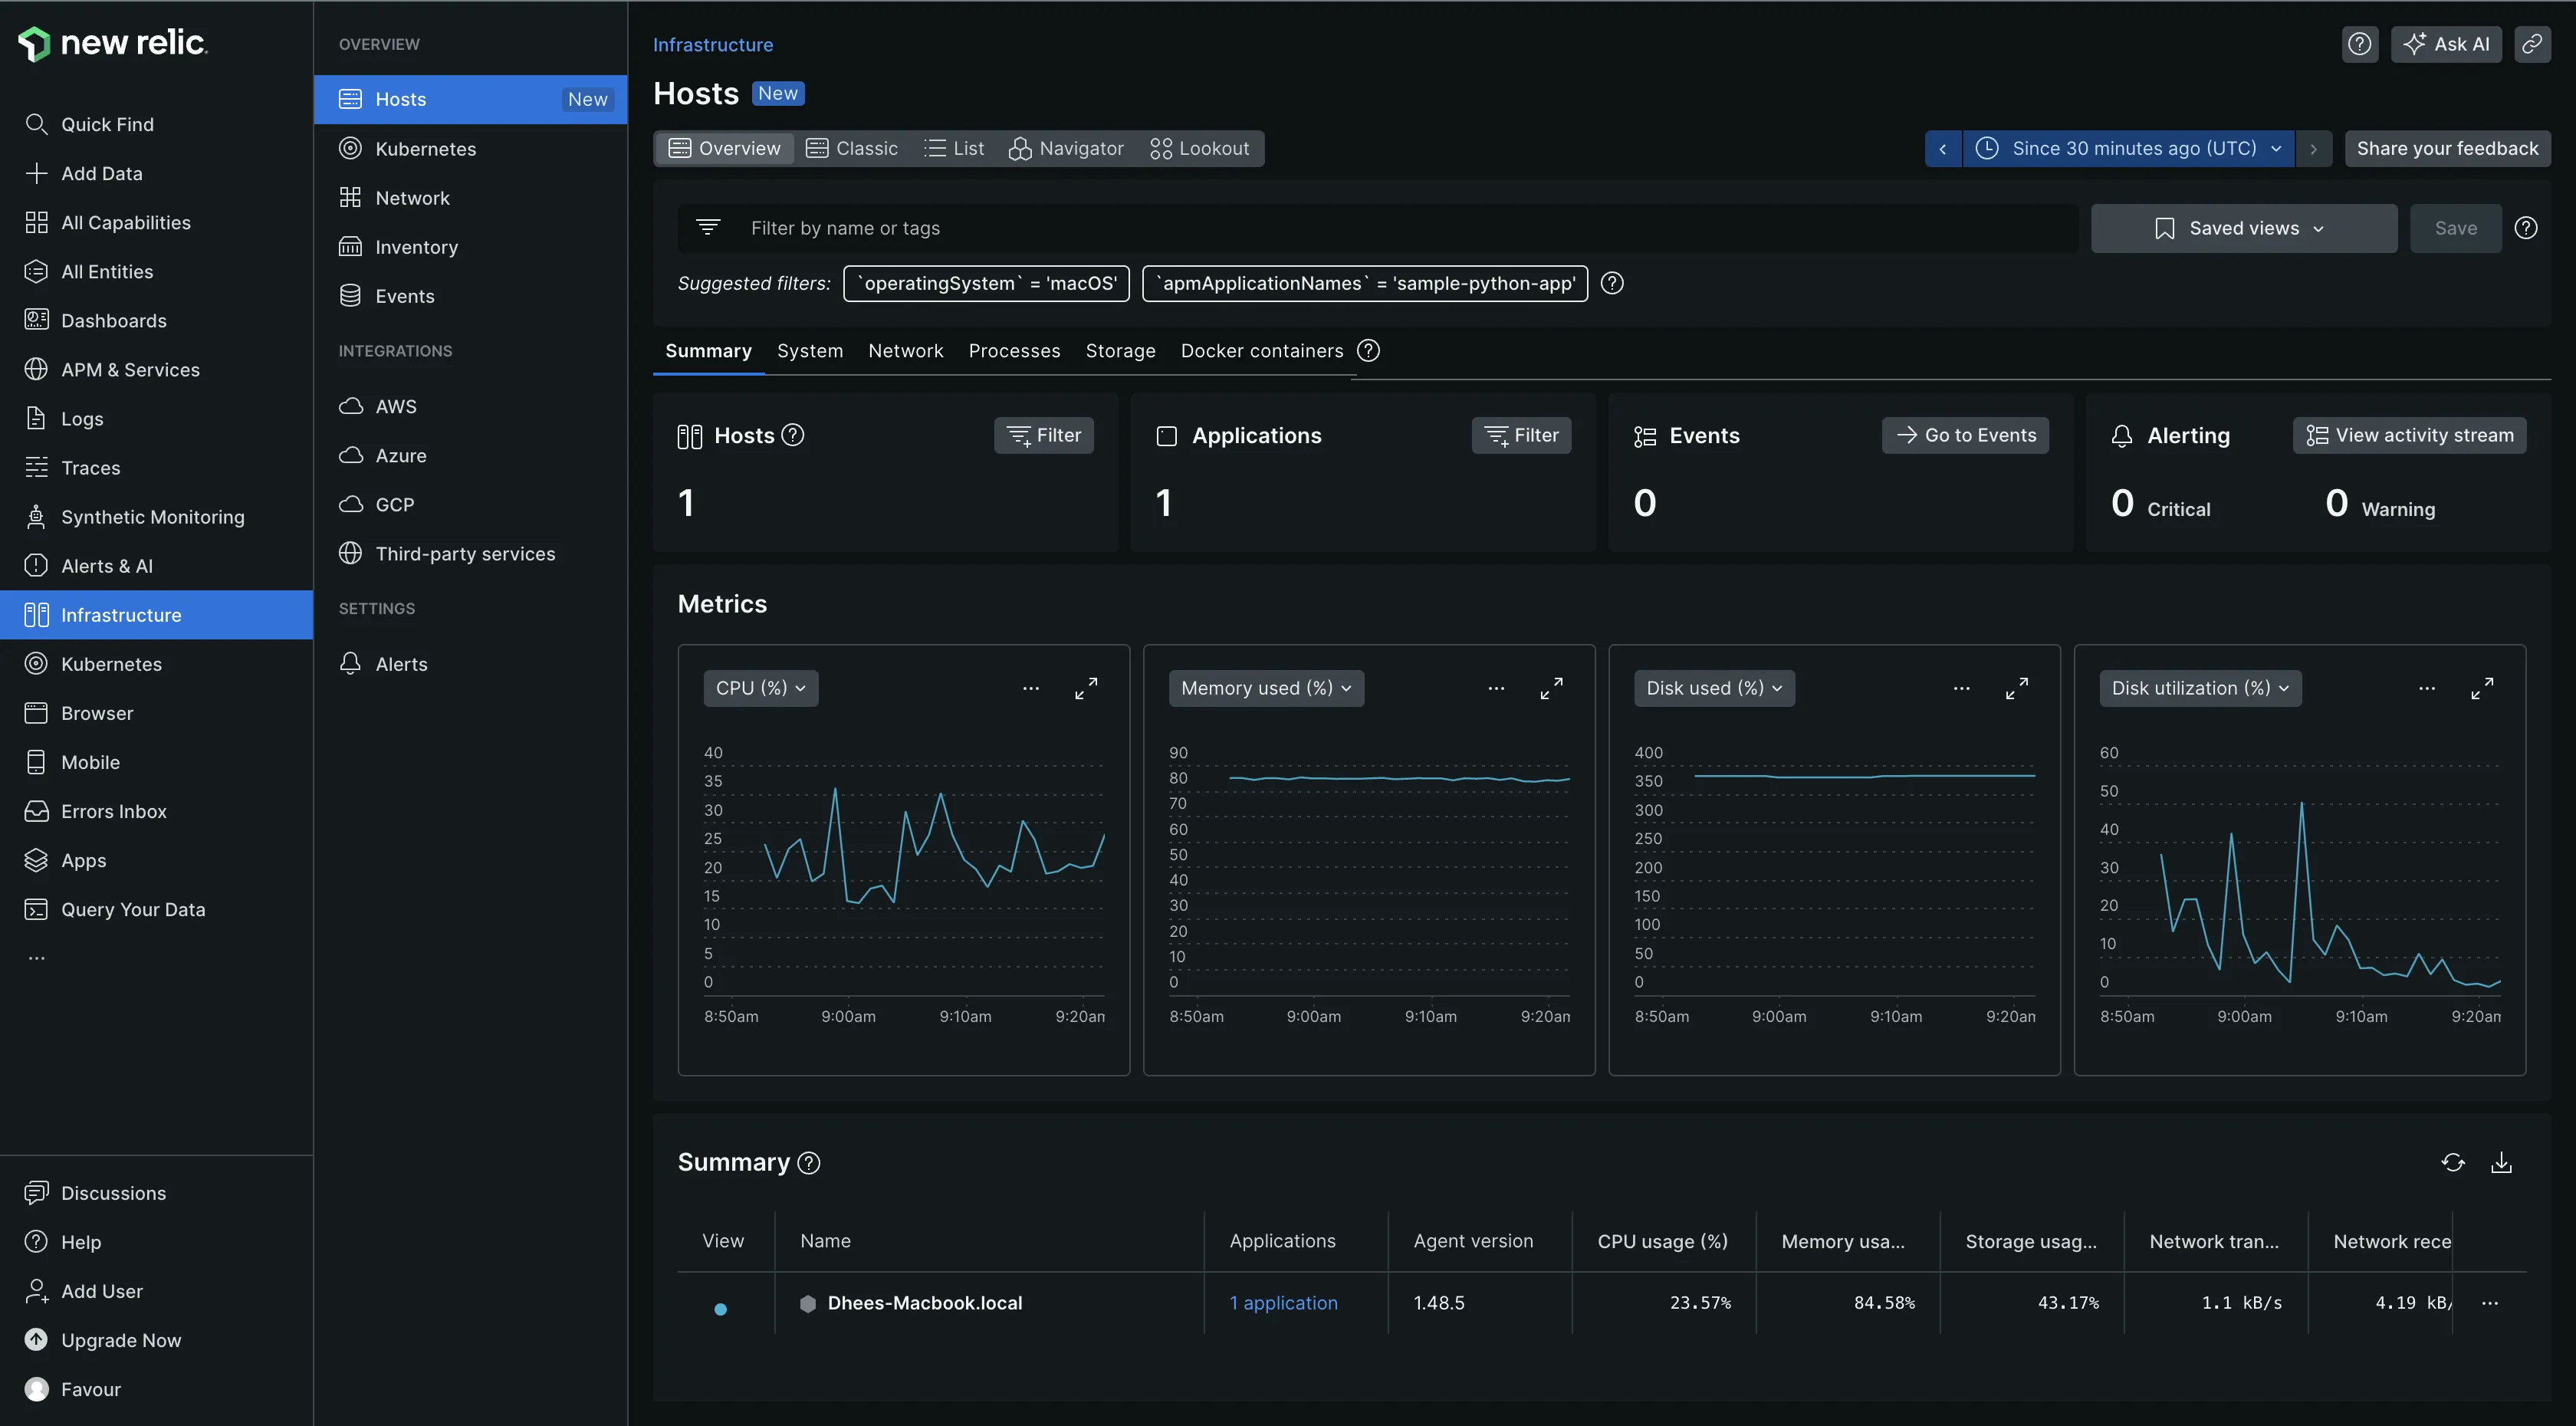
New Relic has shifted toward standardizing on OpenTelemetry, allowing engineering teams to use open-source collector agents or the unified New Relic Infrastructure Agent. Because processing occurs primarily in the New Relic cloud, deployment requires installing lightweight agents or configuring data pipelines without needing local controller maintenance.
Key Feature Comparison
Evaluating APM solutions requires looking beyond basic uptime checks. Modern operations teams rely on deep transaction tracing, infrastructure monitoring, user experience analytics, and machine-learning-driven root-cause analysis.
Application Performance Monitoring (APM) & Transaction Tracing
- AppDynamics (Business Transactions): AppDynamics categorizes performance using Business Transactions (BTs). Rather than monitoring isolated code calls, AppDynamics automatically discovers and tracks user journeys—such as a user placing an order or logging into a portal—across microservices, legacy monoliths, and third-party APIs. It baseline performance for each BT automatically, triggering alerts when a transaction strays outside normal latency bounds.
- New Relic (Distributed Tracing & APM): New Relic provides continuous thread profiling and distributed tracing out of the box. It correlates application traces directly with infrastructure logs and network events. While New Relic allows custom transaction naming and key transaction tagging, it focuses on providing an end-to-end trace view across microservice topologies using OpenTelemetry or native language agents (Java, .NET, Node.js, Python, Go, Ruby, PHP).
Infrastructure and Network Observability
- AppDynamics: Infrastructure monitoring in AppDynamics focuses on server metrics, container health, and database performance. Through its integration into the broader Cisco ecosystem—specifically alongside solutions like Cisco ThousandEyes and Cisco Intersight—AppDynamics bridges application code with network path analysis, routing degradation, and hardware metrics.
- New Relic: New Relic Infrastructure offers unified monitoring for cloud-native stacks, including Kubernetes clusters, serverless functions (AWS Lambda), host virtual machines, and physical hardware. Using a single agent, it continuously collects host-level metrics and correlates them with application code changes without requiring additional plugin configurations.
Real User Monitoring (RUM) and Digital Experience Monitoring (DEM)
- AppDynamics: AppDynamics Digital Experience Monitoring includes Browser Real User Monitoring, Mobile RUM, and Synthetic Monitoring. It maps end-user performance back to server-side Business Transactions, allowing teams to determine whether a slow checkout flow originates from a client-side JavaScript error or a backend database lock.
- New Relic: New Relic Browser and Mobile offer session replay, crash analytics, single-page application (SPA) performance tracking, and core web vitals measurement. New Relic Synthetics allows automated API testing and browser scripting from multiple global locations to detect performance regressions before users are affected.
AI, Anomaly Detection, and Root Cause Analysis
- AppDynamics: AppDynamics uses dynamic baselining. It automatically calculates rolling statistical baselines (daily, weekly, monthly) for every metric, preventing alert fatigue by notifying engineers only when performance deviates significantly from historical patterns. Its automated diagnostics take deep-dive thread dumps when errors occur.
- New Relic: New Relic includes New Relic AI (formerly Applied Intelligence), which aggregates alerts, suppresses noise, correlates events across disparate services, and suggests potential root causes based on topology mapping. The platform leverages machine learning to detect anomalies across massive telemetry volumes in near real-time.
Pricing and Total Cost of Ownership (TCO)
Pricing models differ significantly between the two platforms. Misaligning software architecture with a vendor's pricing model can lead to unexpected budget overruns.
| Cisco AppDynamics | New Relic |
|---|---|
| Host & Core-Based Licensing- Price per CPU Core / Host- Predictable Enterprise Costs- Tiered Feature Editions | Consumption-Based Pricing- Price per GB Data Ingest- Price per Full-Stack User Seat- Free Ingestion Tier Included |
New Relic Pricing Structure
New Relic uses a consumption-based pricing model that scales across two main factors:
- Data Ingest: Charged per gigabyte (GB) of data sent to the Telemetry Data Platform beyond the free monthly tier (which typically includes 100 GB/month free).
- User Seats: Charged per provisioned user per month across tiered user roles:
- Basic Users: Free, limited access to dashboards.
- Core Users: Mid-tier price for developers who need code-level insights and log analysis.
- Full-Stack Admin Users: Higher-tier monthly cost for engineers requiring complete platform management, querying, and alert configuration.
TCO Impact: Consumption pricing provides low barriers to entry and cost control for smaller teams. However, high-volume log ingestion or trace payloads require careful data sampling configuration to manage monthly costs.
AppDynamics Pricing Structure
AppDynamics uses a host-based and core-based enterprise licensing model. Pricing is organized into subscription tiers per monitored CPU core or host agent:
- Infrastructure Monitoring Edition: Basic host and container metrics.
- Premium Edition: Standard APM, infrastructure monitoring, and database diagnostics.
- Enterprise Edition: Includes advanced APM, Business Transaction diagnostics, Real User Monitoring, and business outcome correlation.
TCO Impact: AppDynamics offers predictable annual expenses because pricing is bound to server infrastructure counts rather than total data ingestion volume. However, high initial entry costs can make it less accessible for smaller projects or fast-growing startups.
Technical Comparison Matrix
| Feature / Dimension | Cisco AppDynamics | New Relic |
|---|---|---|
| Primary Target Market | Large Enterprise, Finance, Legacy/Hybrid IT | Mid-Market, Enterprise, Cloud-Native Startups |
| Deployment Options | SaaS, Hybrid, On-Premises | SaaS-Only |
| Primary Pricing Metric | Per Host / CPU Core (Tiered Editions) | Ingested Data (per GB) + User Seats |
| OpenTelemetry Support | Integrated via Cisco Observability Platform | Native, primary open ingestion standard |
| Business Context | Automated Business Transaction (BT) discovery | Custom Attributes, NRQL-based business dashboards |
| Data Query Language | AppDynamics Query Language (ADQL) | New Relic Query Language (NRQL) |
| Network Path Monitoring | Integrated via Cisco ThousandEyes | Synthetics and third-party integrations |
| Dynamic Baselining | Native, continuous statistical baselining | AI-driven anomaly detection and alert correlation |
| Setup Complexity | Higher (Requires Controller & Agent config) | Lower (Quick agent or OTel collector setup) |
Ecosystem and Enterprise Integrations
Integrating an observability solution into an existing DevOps infrastructure, ITSM pipeline, and CI/CD workflow is critical for maintaining operational momentum.
Cisco Ecosystem Synergies
AppDynamics integrates deeply into Cisco's broader enterprise portfolio:
- Cisco ThousandEyes: Integrates network routing and Internet performance analytics directly alongside application trace data.
- Cisco Intersight: Connects application performance requirements with underlying compute, storage, and virtualization resources.
- Splunk Integration: Following Cisco's acquisition of Splunk, data sharing and cross-platform analytics between AppDynamics and Splunk provide unified security and operations logging.
New Relic Open Ecosystem
New Relic prioritizes platform flexibility and integration with modern open-source toolchains:
- OpenTelemetry Native: Accepts data directly from OTel SDKs without requiring proprietary agent wrappers.
- Extensive Integrations: Features over 500 pre-built quickstarts and integrations for platforms like Kubernetes, AWS, Google Cloud, Azure, PagerDuty, Terraform, and Slack.
- GraphQL APIs: Exposes platform operations, configuration management, and dashboard-as-code deployments through flexible APIs.
When to Choose Which Platform
Selecting between these platforms depends on your operational environment, data control policies, and administrative resources.
| Choose Cisco AppDynamics If: | Choose New Relic If: |
|---|---|
| - Require On-Premises Control- Heavy Cisco Infrastructure- Complex Business Tracing- Predictable Host-Based TCO | - Prefer Pure SaaS Platform- Standardized on OpenTelemetry- Need Fast Time-to-Value- Usage-Based Ingest Pricing |
Choose AppDynamics If:
- Strict Data Compliance Requirements Exist: Your organization must host all monitoring controllers and trace data on-premises or within isolated private clouds due to regulatory constraints.
- You Rely on Complex Business Workflows: You need automatic mapping and monitoring of end-to-end "Business Transactions" across heterogenous microservices, mainframes, and enterprise software (like SAP).
- You Invest Heavily in Cisco Infrastructure: Your IT infrastructure relies on Cisco network devices, ThousandEyes, or Intersight, making a unified vendor stack advantageous.
- Predictable Annual Budgeting is Required: You prefer fixed per-host licensing models that remain stable regardless of log spike volume or high-frequency tracing data.
Choose New Relic If:
- You Want a Cloud-Native, All-in-One SaaS Platform: You prefer a fully managed cloud service without operational overhead for controllers or storage backends.
- Your Team Enforces OpenTelemetry Standards: You are building open-source-first telemetry architecture and want native ingestion without proprietary lock-in.
- Rapid Onboarding is a Priority: Engineering teams need instant self-service access, simple agent configurations, and flexible dashboards out of the box.
- Variable Ingestion Fits Your Cost Structure: You want to start small using a free ingestion tier and pay only for the volume of telemetry data and user seats consumed.
Frequently Asked Questions
What is the primary difference between AppDynamics and New Relic?
The main difference lies in their deployment models, architecture, and pricing. AppDynamics is tailored for complex enterprise setups, offering both SaaS and on-premises controller options alongside predictable per-host licensing focused on Business Transaction mapping. New Relic is a pure SaaS observability platform using consumption-based pricing (data ingest per GB plus user seats) that emphasizes rapid deployment and native OpenTelemetry support.
Can AppDynamics be deployed completely on-premises?
Yes. Cisco AppDynamics provides an On-Premises Controller option, allowing organizations to run the platform entirely within their private data centers. This ensures that telemetry, diagnostic data, and system logs never leave the internal corporate network, satisfying strict data sovereignty requirements.
Does New Relic support OpenTelemetry natively?
Yes. New Relic treats OpenTelemetry as a first-class standard. Applications instrumented with OpenTelemetry SDKs or collectors can send metrics, traces, and logs directly into New Relic's Telemetry Data Platform without requiring proprietary New Relic APM agents.
How does New Relic's consumption pricing work compared to AppDynamics' host licensing?
New Relic charges based on the volume of telemetry data ingested (in GB per month beyond any free allocations) and the number of active user seats accessing the platform. AppDynamics traditionally charges a predictable subscription fee per monitored host agent, container node, or CPU core, regardless of the overall telemetry volume generated by those hosts.
How do both platforms handle anomaly detection and alerting?
AppDynamics uses automated statistical baselining that continuously computes rolling normal performance metrics for every Business Transaction, triggering alerts when latency or error rates breach historical standards. New Relic utilizes New Relic AI, combining machine learning anomaly detection with automated alert correlation to reduce noise across logs, events, and infrastructure metrics.
Next Steps and Implementation Recommendations
To evaluate which observability platform best fits your organization:
- Audit Telemetry Volumes: Calculate your average monthly log ingestion rates, trace samples, and system metric counts to project costs under New Relic's consumption model versus AppDynamics' host-based licensing.
- Assess Regulatory Boundaries: Determine whether your industry requires on-premises data storage. If cloud ingestion is prohibited, Cisco AppDynamics is the viable choice between the two.
- Execute a Targeted Proof-of-Concept (PoC): Deploy agents from both vendors on identical test environments handling representative production workloads. Evaluate time-to-dashboard, automated transaction discovery, and real-time query speeds (ADQL vs. NRQL).
- Standardize Instrumentation: Adopt OpenTelemetry standards where possible to preserve telemetry flexibility regardless of your final vendor choice.