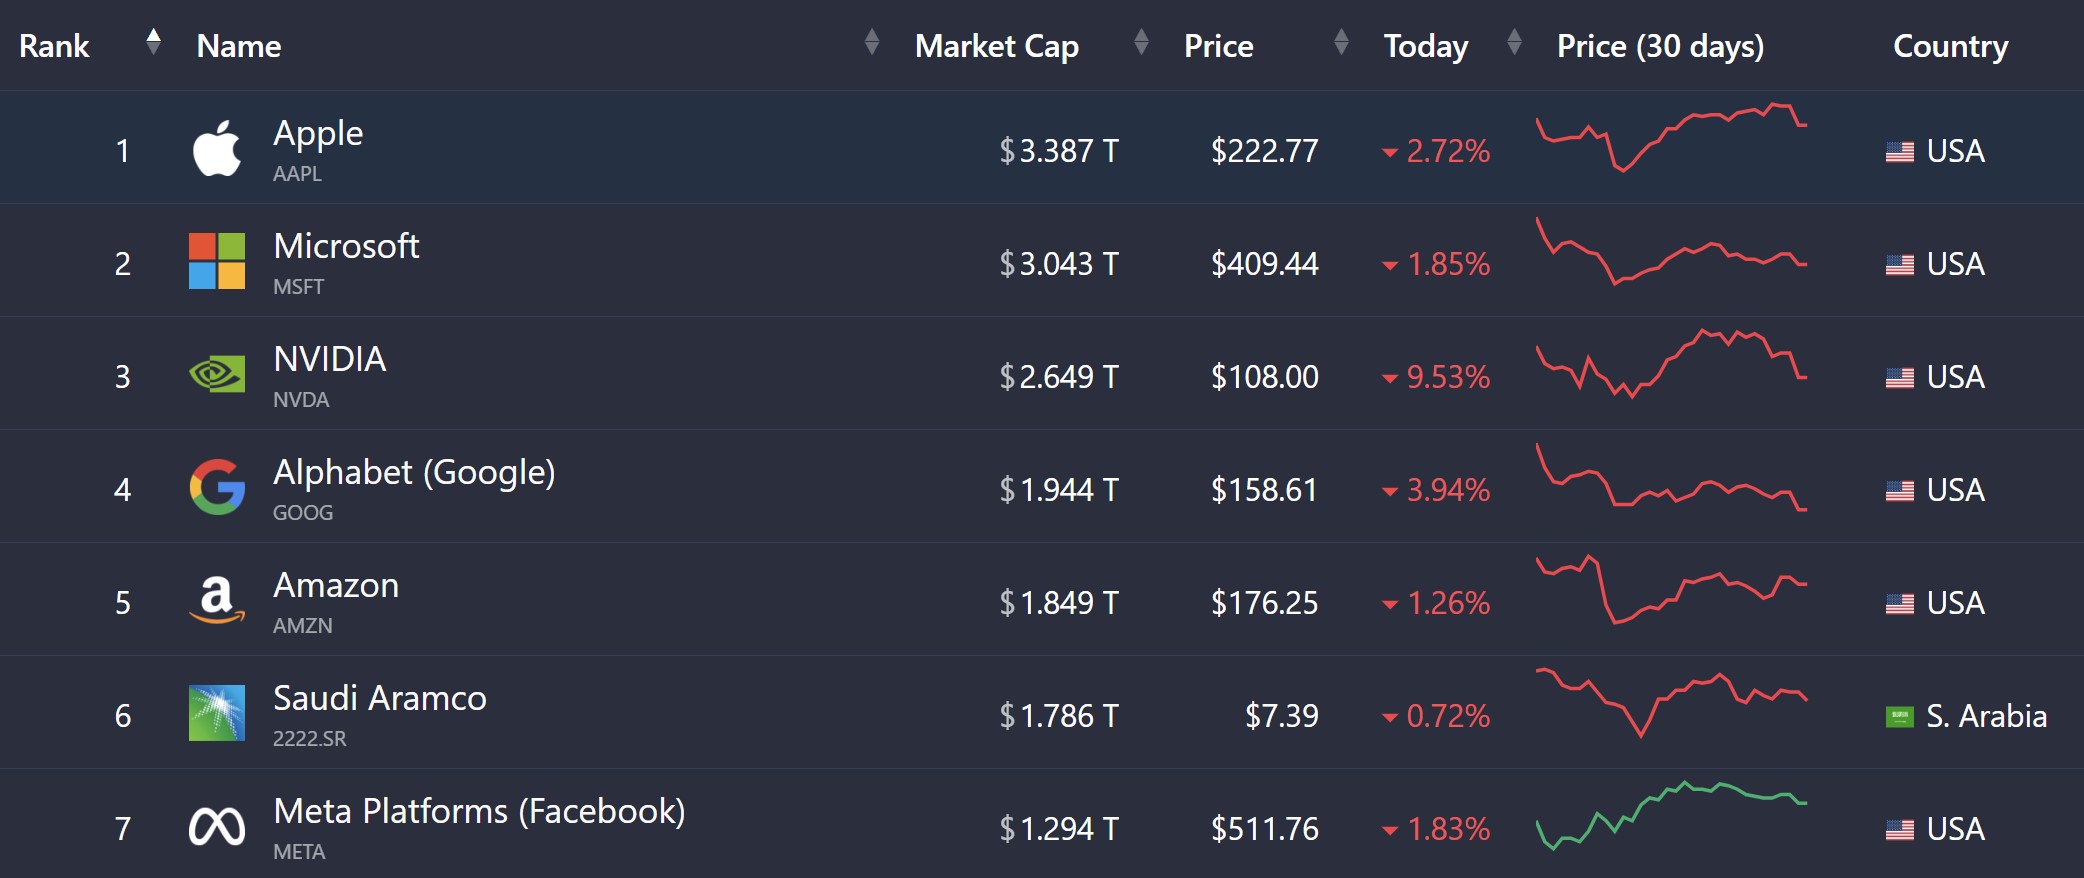
Apple and Microsoft represent the premier valuation benchmarks in global public equity markets, each surpassing multi-trillion-dollar market capitalizations. Their valuations are sustained by fundamentally distinct strategic rationales: Apple leverages a vertically integrated hardware, software, and services consumer ecosystem, while Microsoft drives enterprise transformation through cloud infrastructure, B2B software subscriptions, and hyper-scale artificial intelligence.
The Multi-Trillion-Dollar Milestones: Historical Valuation Trajectories
The evolution of market capitalization for both Apple Inc. (NASDAQ: AAPL) and Microsoft Corporation (NASDAQ: MSFT) illustrates how fundamental business model shifts trigger long-term market re-ratings. Understanding these historical milestones provides key context for evaluating their current equity valuations.
| Year | Apple (AAPL) Valuation Milestone | Microsoft (MSFT) Valuation Milestone |
|---|---|---|
| 2018 | Reaches $1 Trillion (August) | Surpasses $800 Billion |
| 2019 | Sustains $1 Trillion Mark | Reaches $1 Trillion (April) |
| 2020 | Reaches $2 Trillion (August) | Surpasses $1.6 Trillion |
| 2021 | Approaches $3 Trillion Peak | Reaches $2 Trillion (June) |
| 2023/24 | Reaches/Sustains $3 Trillion | Reaches/Sustains $3 Trillion |
Apple’s Transition: From Hardware Manufacturer to Ecosystem Monolith
Apple became the first publicly traded U.S. company to reach a $1 trillion market capitalization in August 2018, subsequently crossing $2 trillion in August 2020 and touching $3 trillion in mid-2023. Historically valued as a cyclical consumer hardware maker, Apple achieved multiple expansion when equity markets began pricing the company as a recurring revenue platform.
The primary driver of this shift was the deliberate expansion of its Services division—comprising the App Store, iCloud, Apple Pay, Apple Music, and subscription bundles. By monetizing an active installed base of over 2 billion devices, Apple established high-margin, predictable cash flows that insulated its valuation from annual hardware upgrade cycles.
Microsoft’s Turnaround: From PC Desktop Monopolist to Cloud and AI Titan
Microsoft’s valuation journey follows a different strategic arc. After struggling with flat market capitalization during the mobile computing era of the 2000s, the appointment of Satya Nadella as CEO in 2014 initiated a historical corporate turnaround. Nadella shifted Microsoft away from a Windows-centric focus toward a "mobile-first, cloud-first" paradigm.
Microsoft reached its $1 trillion milestone in April 2019, hit $2 trillion in June 2021, and joined Apple in the $3 trillion club by early 2024. This growth was catalyzed by the rapid scaling of Microsoft Azure in enterprise cloud infrastructure, the conversion of legacy perpetual software licenses into recurring Microsoft 365 Software-as-a-Service (SaaS) subscriptions, and early strategic commitments to generative AI compute architecture.
Strategic Rationale: Deconstructing Core Business Engines
Evaluating the strategic rationale behind these valuations requires examining how each organization creates, captures, and retains economic value across global markets.
- Strategic Value Creation
- Apple Inc. (AAPL): Consumer Ecosystem Engine
- Proprietary Silicon
- Hardware-Software Lock-in
- 2B+ Active Device Base
- High-Margin Consumer Services
- Microsoft Corp. (MSFT): Enterprise Cloud Engine
- Azure Hyperscale Infra
- B2B SaaS Subscriptions
- Commercial Enterprise Sales
- Generative AI & Copilot
- Apple Inc. (AAPL): Consumer Ecosystem Engine
Apple’s Integrated Consumer Ecosystem Play
Apple’s market capitalization is supported by tight vertical integration. Unlike competitors that rely on third-party operating systems or commodity hardware components, Apple controls the complete technology stack:
- Custom Silicon Architecture: Designing in-house A-series and M-series chips gives Apple a performance-per-watt advantage, optimizes supply chain costs, and enables hardware features that software-only competitors cannot match.
- High Switching Costs and Hardware Lock-in: iOS, macOS, watchOS, and iPadOS create mutual interoperability. Features like AirDrop, iMessage, Continuity, and shared iCloud storage raise customer switching costs, generating high retention rates across hardware replacement cycles.
- High-Margin Monetization of the Installed Base: As hardware penetration reaches maturity in developed markets, Apple expands gross margins by selling digital services to existing users. Apple’s Services segment consistently operates at gross margins exceeding 70%, nearly double the gross margin of its physical hardware products.
Microsoft’s Enterprise Cloud, SaaS, and AI Infrastructure Engine
Microsoft’s strategic rationale relies on commercial enterprise lock-in, organizational workflow integration, and infrastructure scale:
- Commercial Cloud Dominance: Azure functions as a key engine of Microsoft’s top-line growth. As enterprises migrate workloads from on-premises data centers to public cloud environments, Azure captures long-term, multi-year consumption commitments.
- Deep Enterprise Distribution Channels: Microsoft maintains long-standing relationships with corporate IT departments through Enterprise Agreements (EAs). This distribution infrastructure allows Microsoft to bundle new offerings—such as Teams, security suites, and Copilot features—into existing Microsoft 365 licensing tiers (e.g., E3 and E5), maximizing net dollar retention rates.
- First-Mover Advantage in Enterprise AI: Through its multi-billion-dollar partnership with OpenAI and heavy capital expenditure in AI compute infrastructure, Microsoft integrated generative artificial intelligence across its product portfolio. Monetizing AI both at the infrastructure layer (Azure OpenAI Service) and the application layer (Microsoft 365 Copilot) provides a secondary vector for per-seat revenue expansion.
Comparative Analysis: Financial Metrics and Strategic Indicators
The following matrix compares the operational characteristics, capital allocation strategies, and financial profiles that underpin the valuation models of both tech giants.
| Financial & Strategic Metric | Apple Inc. (AAPL) | Microsoft Corporation (MSFT) |
|---|---|---|
| Primary Revenue Driver | Premium Consumer Hardware (iPhone, Mac, Wearables) & Consumer Services | B2B Commercial Cloud (Azure), Enterprise SaaS (Office 365), and Productivity |
| Target Audience Focus | Consumer End-Users (with growing enterprise device deployment) | Commercial Enterprises, Small/Medium Businesses, Developers, and Public Sector |
| Monetization Model | High-ASP Hardware Sales + Recurring Consumer Subscriptions & App Store Take-Rates | Per-Seat Monthly/Annual SaaS Subscriptions + Cloud Consumption (IaaS/PaaS) |
| Blended Gross Margins | Typically ~44% – 46% (Hardware ~36-38%, Services ~70-74%) | Typically ~68% – 70% (Driven by software-heavy product mix) |
| Capital Allocation Priority | Aggressive Share Repurchases (Buybacks) + Modest Dividend Growth | Balanced Mix of CapEx (Data Centers/AI), Strategic M&A, Dividends, & Buybacks |
| Artificial Intelligence Strategy | On-Device Processing ("Apple Intelligence"), Silicon Efficiency, Privacy Focus | Cloud-Hosted Large Language Models, Generative Copilot Integration, Azure Infrastructure |
| Primary Economic Moat | Ecosystem Brand Loyalty, Proprietary Hardware/Silicon, Consumer Switching Costs | Enterprise Workflow Lock-in, High Switching Costs, Distribution Channel Scalability |
| Key Regulatory Risk | Antitrust oversight on App Store commissions and developer restrictions | Antitrust scrutiny on software bundling, cloud licensing terms, and AI alliances |
Capital Allocation Strategies: Share Repurchases vs. Growth Investments
A major factor supporting the valuations of both firms is how they deploy their substantial operating cash flows. However, their capital allocation playbooks reflect their strategic priorities.
Apple’s Capital Return Playbook: The Buyback Engine
Apple utilizes a capital allocation policy centered on returning excess capital to shareholders, primarily through share repurchases.
Apple Capital Allocation Paradigm
- Operating Cash Flows
- Target Net Cash Neutrality
- Aggressive Share Buybacks
- EPS Expansion & Floor on Valuation
Share Count Reduction: Apple has repurchased hundreds of billions of dollars of its own common stock over the past decade, retiring a significant percentage of its outstanding shares. This continuous reduction in share count artificially boosts earnings per share (EPS), even during periods of modest net income growth.
Targeting Net Cash Neutrality: Apple’s explicit strategy has been to balance its cash holdings with its debt obligations. Because its core business requires lower annual capital expenditures relative to hyperscale cloud providers, Apple can direct the vast majority of its free cash flow back to equity holders.
Targeted M&A: Apple rarely engages in mega-acquisitions. Instead, it buys smaller technology startups to acquire talent and intellectual property that can be integrated into future product pipelines (e.g., the acquisition of Beats Electronics in 2014 remains its largest public transaction).
Microsoft’s reinvestment Strategy: Strategic M&A and Infrastructure CapEx
Microsoft maintains a capital allocation strategy balanced between returning cash to shareholders and making major capital investments to expand its addressable market.
Microsoft Capital Allocation Paradigm
- Operating Cash Flows
- Large-Scale Strategic M&A
- Market Position Entry (e.g., Activision/LinkedIn)
- Heavy Cloud & AI CapEx
- Hyperscale Capacity
- Large-Scale Strategic M&A
- Operating Cash Flows
Large-Scale Strategic M&A: Microsoft has consistently deployed capital into multi-billion-dollar acquisitions to enter strategic adjacent markets. Key transactions include LinkedIn ($26.2 billion in 2016), GitHub ($7.5 billion in 2018), Nuance Communications ($19.7 billion in 2021), and Activision Blizzard ($68.7 billion completed in 2023).
Capital Expenditure Expansion: Unlike Apple, Microsoft requires massive ongoing CapEx to maintain its cloud computing footprint. Building, equipping, and powering global data centers filled with high-performance graphics processing units (GPUs) requires tens of billions of dollars in annual capital deployment to support Azure and AI services.
Dividend Growth and Buybacks: Microsoft maintains a steady program of dividend increases and share repurchases, but its capital return is balanced against strategic reinvestments in infrastructure and M&A.
AI Deployment Models: Edge Computing vs. Cloud Infrastructure
The ongoing expansion of artificial intelligence represents a core catalyst for both companies' long-term valuations, but their architectural approaches differ significantly.
Apple’s Edge Strategy: On-Device Intelligence and Silicon Optimization
Apple’s approach to AI focuses on edge computing—running machine learning models directly on modern user devices powered by Neural Engine silicon:
- Privacy and Data Security: By running smaller, highly optimized models on-device, Apple preserves user privacy without routing personal data to third-party cloud servers.
- Hardware Refresh Acceleration: Advanced AI features require high memory bandwidth and processing capabilities, which limits backward compatibility. This creates an incentive for consumer hardware upgrade cycles across older iPhone, Mac, and iPad models.
- Hybrid Architecture: For complex queries that exceed on-device compute limits, Apple relies on Private Cloud Compute (PCC) infrastructure built on custom Apple silicon servers, maintaining end-to-end operational control over the user experience.
Microsoft’s Cloud Infrastructure Strategy: Hyperscale Compute and Enterprise Copilot
Microsoft’s strategy centers on centralized, enterprise-grade cloud compute:
- Foundation Model Hosting: Through Azure OpenAI Service, Microsoft provides commercial access to state-of-the-art large language models (LLMs), allowing enterprise developers to build custom applications on Microsoft's cloud infrastructure.
- Workplace Productivity Automation: By embedding specialized "Copilot" assistants across Windows, GitHub, Dynamics 365, and Microsoft 365, Microsoft monetizes AI via direct per-user subscription add-ons.
- Enterprise Security and Compliance: Microsoft guarantees corporate clients that proprietary corporate data used in prompts will not leak to public training sets, satisfying strict regulatory and governance requirements across global industries.
Strategic Risks, Regulatory Scrutiny, and Valuation Bottlenecks
Despite their scale, both companies face structural risks that could compress valuation multiples or limit top-line revenue growth.
Regulatory and Antitrust Interventions
Both Apple and Microsoft face strict antitrust regulation from global bodies, including the European Commission and the U.S. Department of Justice (DOJ).
- Apple App Store Regulations: Regulatory frameworks such as the European Union's Digital Markets Act (DMA) challenge Apple’s closed platform model. Enforced rules mandating third-party app stores, alternative payment processing mechanisms, and sideloading degrade Apple's high-margin digital service commissions. Concurrently, antitrust lawsuits filed by government entities highlight potential operational vulnerabilities within its core ecosystem structure.
- Microsoft Cloud and AI Antitrust Scrutiny: Regulators closely monitor Microsoft’s commercial enterprise licensing practices to prevent anti-competitive software bundling that could disadvantage competing cloud infrastructure providers. Additionally, Microsoft's close investments in key AI startups remain under review by international competition authorities to evaluate market concentration risks within emerging AI infrastructure tiers.
| Risk Category | Apple Inc. (AAPL) | Microsoft Corp. (MSFT) |
|---|---|---|
| Antitrust Target | App Store fees, Sideloading, DMA | Cloud licensing, AI deals |
| Supply Chain | Geopolitical concentration in Asia | Hardware/Server supply |
| Capital Intensity | Low CapEx relative to revenue | High data center CapEx |
| Cyclicality | Consumer discretionary spending | Enterprise IT budgets |
Operational and Supply Chain Vulnerabilities
- Apple Supply Chain Exposure: Despite diversification efforts into regions like India and Vietnam, Apple retains manufacturing dependencies on manufacturing nodes in mainland China. Geopolitical tensions or localized disruptions present tail risks to physical hardware inventory.
- Microsoft Cloud CapEx Intensity and ROIC: Microsoft’s multi-billion-dollar investments in data centers and specialized AI processors require sustained high Return on Invested Capital (ROIC). If enterprise AI adoption curve plateaus or pricing pressure compresses SaaS margins, the returns on this capital expenditure could lag market expectations.
Practical Guidelines for Corporate Strategists and Equity Analysts
When evaluating the market capitalization drivers and strategic positioning of Apple and Microsoft, institutional investors and strategic planning executives should apply specific evaluation frameworks.
How to Model Apple’s Valuation Mechanics
- Track Active Installed Base Growth: Focus on gross device activations rather than short-term quarterly unit shipments. An expanding installed base indicates broader capacity for downstream Services monetization.
- Monitor Services Blended Gross Margins: Assess the proportion of revenue generated by high-margin App Store take-rates, licensing agreements, and cloud subscriptions relative to lower-margin hardware segments.
- Calculate Share Count Degradation: Evaluate net earnings expansion on a per-share basis, factoring in annual capital deployment dedicated to share buybacks under the SEC EDGAR corporate filings framework available at the U.S. Securities and Exchange Commission (SEC).
How to Model Microsoft’s Valuation Mechanics
- Analyze Commercial Cloud Gross Margin Expansion: Track Azure revenue growth alongside Microsoft’s Commercial Cloud gross margin percentage to gauge operational leverage across data center infrastructure.
- Evaluate Enterprise Net Retention Rates: Assess how effectively Microsoft upsells existing enterprise customers from baseline Microsoft 365 packages to security, analytics, and AI-enabled software tiers.
- Audit Data Center Capital Expenditure Intensity: Measure annual property, plant, and equipment (PP&E) cash outflows against cloud segment revenue acceleration to verify that enterprise demand justifies infrastructure spending.
Frequently Asked Questions
Why do Apple and Microsoft command higher valuation multiples than traditional industrial companies?
Apple and Microsoft hold elevated enterprise-value-to-earnings multiples due to their operational scale, high profit margins, substantial free cash flows, and defensive market moats. Unlike capital-intensive industrial firms that face high marginal production costs, both technology companies generate substantial revenue per employee. Their software, services, and digital platform models enable cash flow generation that can be redirected into share buybacks, R&D, or infrastructure investments.
How does Apple's share buyback strategy impact its market capitalization compared to Microsoft's growth strategy?
Apple uses its free cash flow primarily to repurchase its own equity, steadily decreasing total shares outstanding over time. This continuous share retirement increases earnings per share (EPS) even when revenue growth slows, creating a structural floor for its stock price. Microsoft, conversely, splits its capital between share repurchases, dividends, strategic enterprise acquisitions, and high capital expenditures to build out global cloud and AI infrastructure, driving growth via market expansion.
Which company possesses a more defensible strategic moat: Apple or Microsoft?
Both companies maintain deep strategic moats built on different economic mechanics. Apple’s moat relies on consumer switching costs, hardware-software integration, proprietary silicon, and high brand equity across its 2-billion-device installed base. Microsoft’s moat stems from enterprise integration, high switching costs within organizational IT workflows, deep corporate sales channels, and cloud infrastructure requirements. Neither moat is strictly superior; Apple dominates the high-end consumer hardware ecosystem, while Microsoft controls core corporate software workflows.
How does cloud computing drive Microsoft's market cap differently than hardware drives Apple's?
Cloud computing (such as Microsoft Azure) operates primarily on an infrastructure consumption and subscription model, providing recurring, highly predictable B2B revenue streams supported by multi-year enterprise contracts. Apple’s hardware revenues rely more heavily on discretionary consumer upgrade cycles, though this hardware foundation enables higher-margin, recurring consumer digital services revenue.
What role does artificial intelligence play in long-term market cap expansion for both companies?
For Microsoft, AI serves as an immediate, direct monetizable platform layered onto enterprise SaaS subscriptions (via Copilot add-ons) and cloud infrastructure usage (hosting compute workloads on Azure). For Apple, AI primarily acts as a feature layer intended to enhance consumer user experiences, preserve personal data privacy, and drive hardware replacement cycles across iPhones, Macs, and iPads.
Strategic Summary and Next Steps
Evaluating the valuations of Apple and Microsoft requires analyzing two distinct approaches to market leadership. Apple’s valuation reflects its consumer ecosystem control, vertical integration, and aggressive share retirement. Microsoft’s valuation rests on enterprise software integration, cloud computing scale, and AI infrastructure execution.
Next Action Items for Financial Analysts and Business Strategists:
- Review Quarterly Filings: Audit the quarterly 10-Q and annual 10-K filings via the U.S. Securities and Exchange Commission (SEC) to track Apple's Services margin metrics and Microsoft's Azure cloud consumption trends.
- Monitor Regulatory Actions: Track regulatory updates regarding the EU's Digital Markets Act and antitrust filings from the Federal Trade Commission and Department of Justice to assess strategic tailwinds and platform operational risks.
- Track CapEx-to-Revenue Ratios: Compare Microsoft’s capital expenditure trajectory against enterprise cloud adoption rates to verify the returns on its generative AI data center investments.
Financial Disclaimer: This analysis is published strictly for informational, educational, and strategic corporate analysis purposes. It does not constitute formal financial, investment, legal, or tax advice. Market capitalization figures, corporate metrics, and valuation multiples fluctuate based on continuous market conditions. Investors should consult a qualified financial advisor before executing investment decisions.