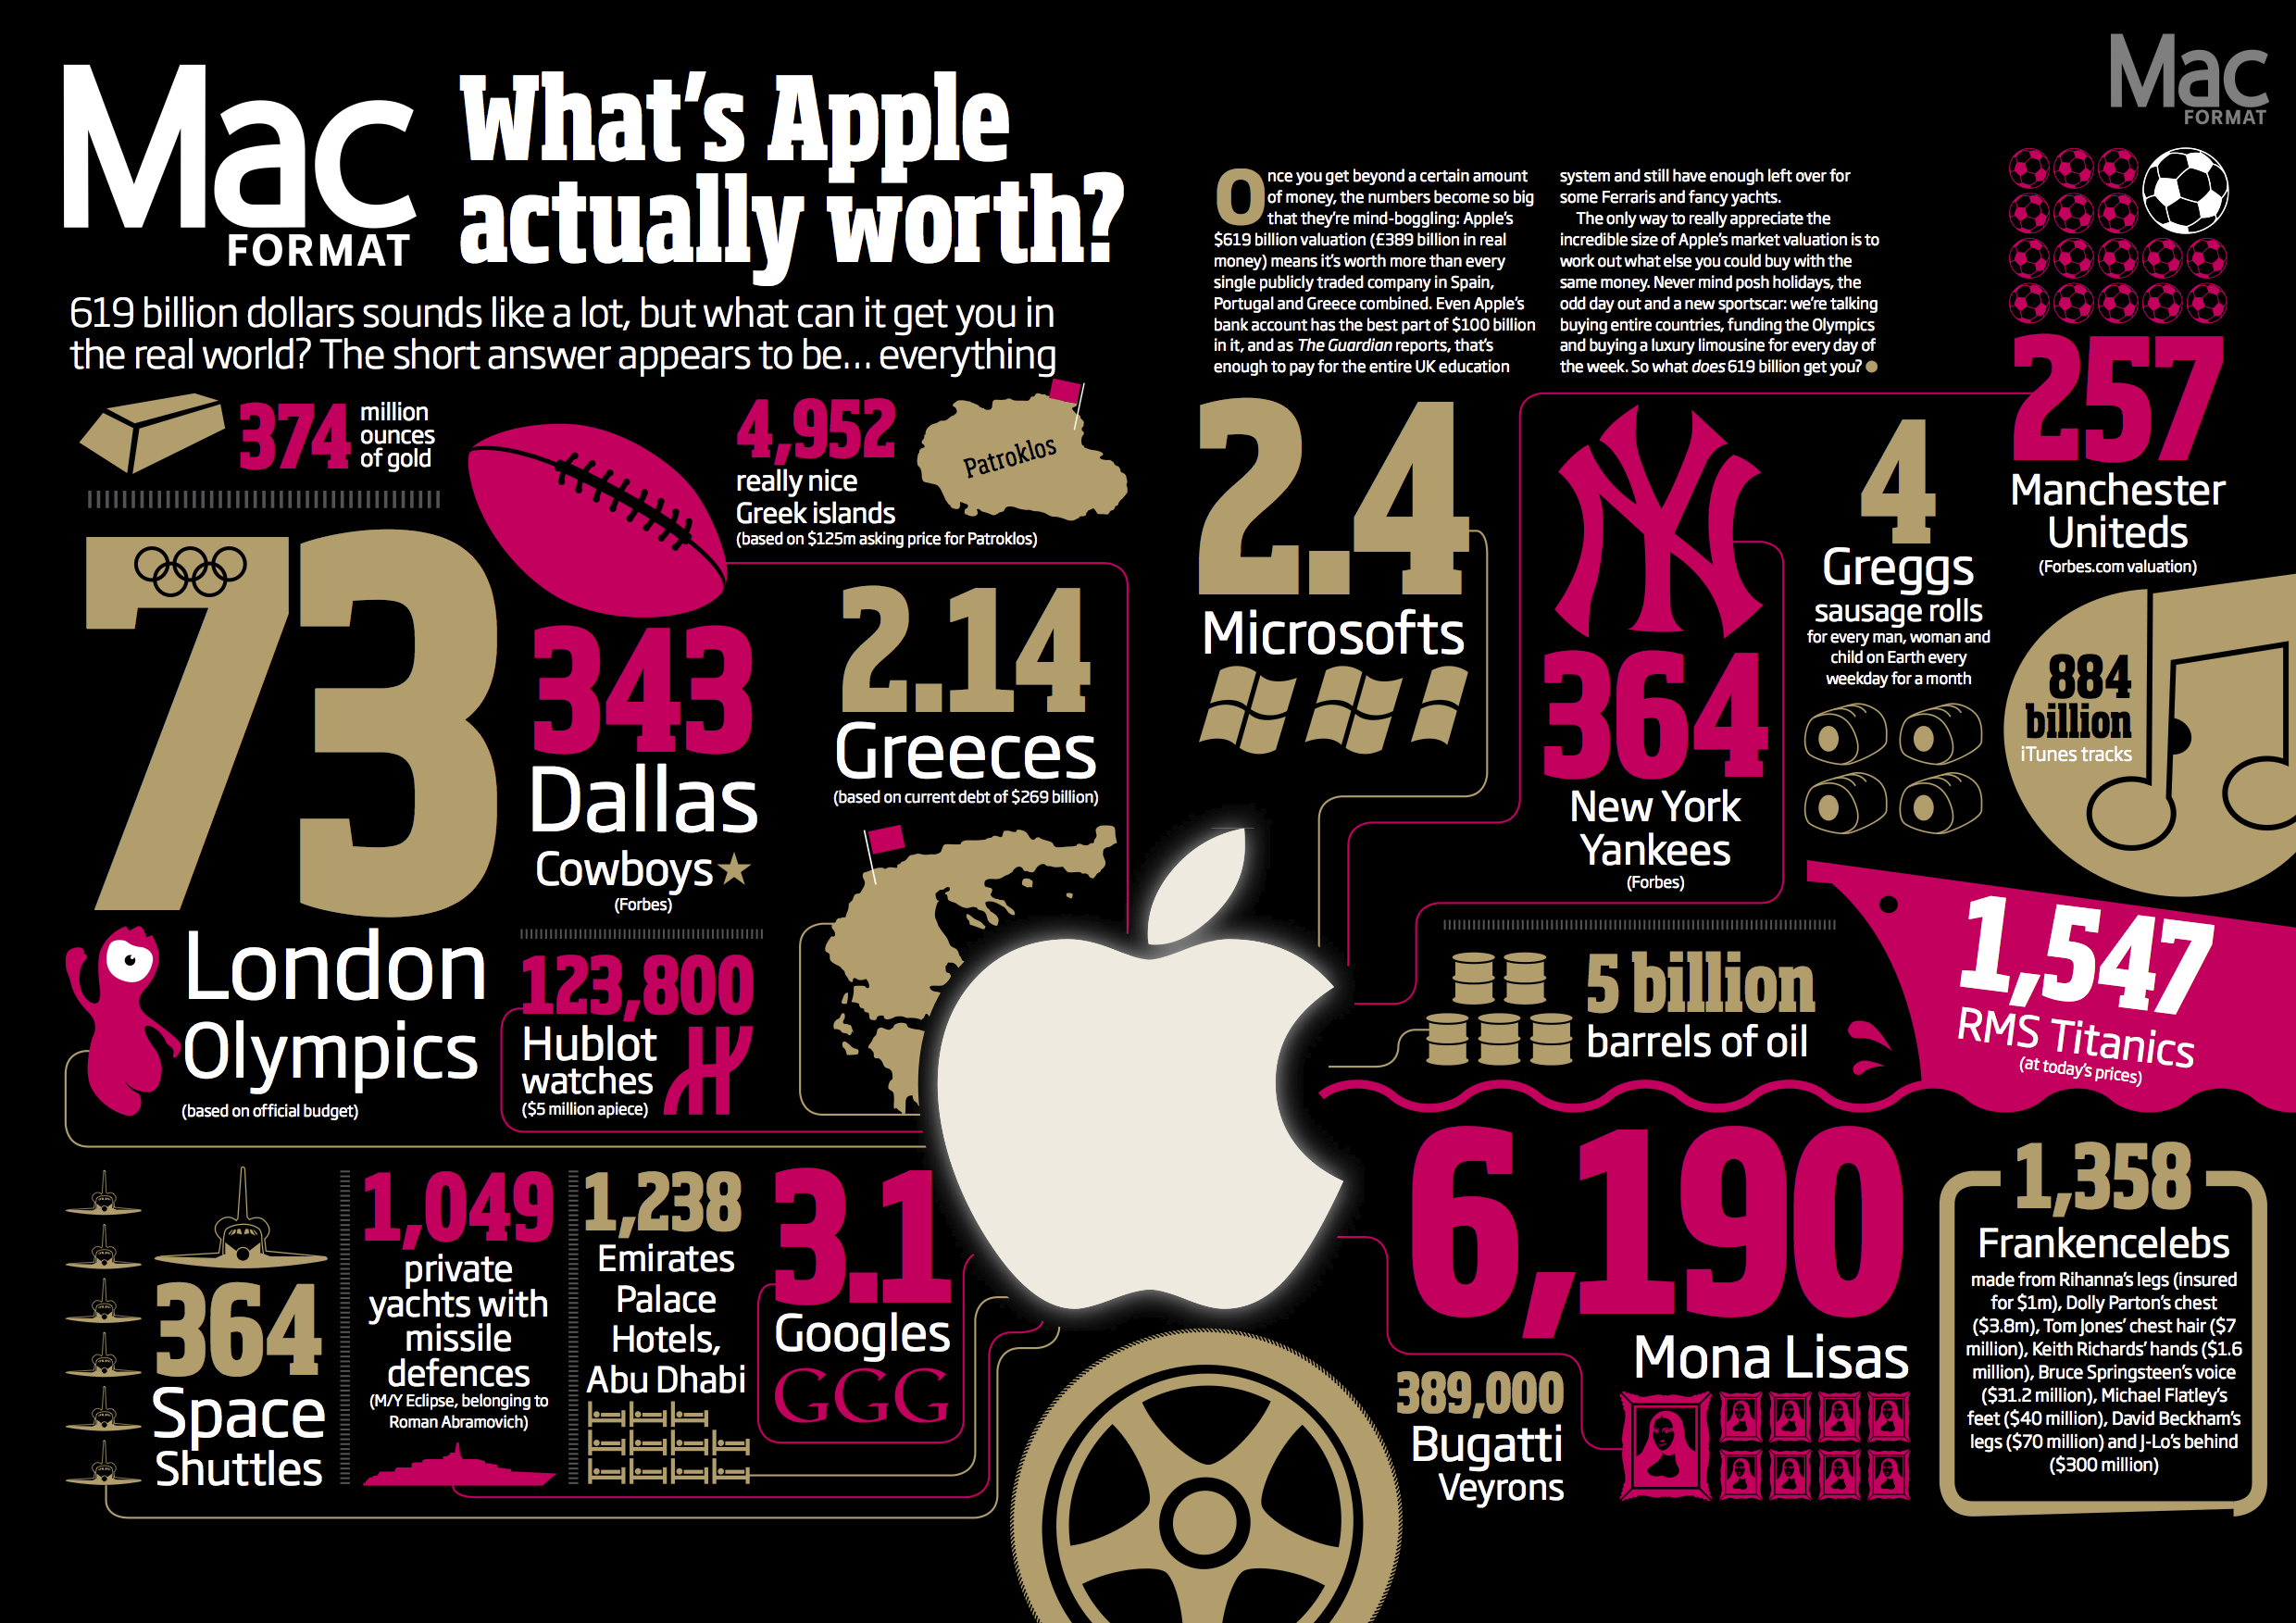
Determining Apple Inc.'s "net worth" for 2025 depends heavily on whether you measure accounting book value, standalone brand equity, or public market capitalization. Throughout 2025, Apple’s market capitalization fluctuated between $3.3 trillion and $3.7 trillion, solidifying its position as one of the world's most valuable corporate entities. Meanwhile, independent valuation firms ranked Apple's intangible brand value at over $500 billion, even as its SEC-reported stockholders' equity (book net worth) sat around $50 billion to $60 billion due to massive, ongoing stock buybacks.
Disambiguating "Net Worth" for Apple Inc.
When financial analysts, investors, and consumers search for the net worth of a multinational giant like Apple Inc. (NASDAQ: AAPL), they often blend three distinct financial metrics into a single concept. Understanding the structural differences between these metrics is essential for evaluating Apple's true economic standing.
| Apple's Valuation | Details |
|---|---|
| 1. Market Capitalization | Total equity value on Wall Street (~$3.3T – $3.7T) |
| 2. Brand Value | Value of intangible brand assets (~$480B – $516B) |
| 3. Accounting Book Value | SEC Assets minus Liabilities (~$50B – $65B) |
1. Market Capitalization (Wall Street Valuation)
Market capitalization reflects the total dollar value of all outstanding shares of Apple stock. Calculated by multiplying the current share price by the total count of diluted shares outstanding, this metric represents what the public market considers the entire company to be worth on any given trading day. In late 2024 and through 2025, Apple's market capitalization routinely benchmarked between $3.3 trillion and $3.7 trillion, vying with Microsoft and NVIDIA for the title of the world's most valuable public company.
2. Standalone Brand Value (Intangible Asset Worth)
Brand value measures the monetary worth of the name, trademarks, customer loyalty, and market positioning of "Apple" as an intangible asset. Global brand consultancy agencies—such as Brand Finance and Interbrand—isolate the portion of corporate revenue directly attributable to the brand's reputation versus basic functional utility. In their 2024 and 2025 annual reports, Brand Finance calculated Apple's brand value at over $516 billion, marking it as the single most valuable corporate brand in global history.
3. Stockholders' Equity (Accounting Book Net Worth)
From a strict Generally Accepted Accounting Principles (GAAP) standpoint, net worth is defined as total assets minus total liabilities, recorded on the corporate balance sheet submitted to the U.S. Securities and Exchange Commission (SEC).
In Apple’s Form 10-K annual reports, stockholders' equity typically sits between $50 billion and $65 billion. This number appears surprisingly low for a multi-trillion-dollar company. However, this discrepancy exists because accounting book value records historical costs rather than future earnings power, and Apple deliberately reduces its reported equity by funneling hundreds of billions of dollars into share repurchases.
Breakdown of Apple's Core Valuation Metrics
To evaluate Apple's financial health during the 2025 reporting period, it helps to examine how balance sheet fundamentals compare against equity market pricing and third-party brand audits:
| Financial Dimension | Estimated 2024–2025 Value | Accounting / Financial Definition | Key Driver / Context |
|---|---|---|---|
| Market Capitalization | $3.30 Trillion – $3.70 Trillion | Total diluted shares outstanding multiplied by current market stock price. | Strong investor confidence, high net margins, and Services segment growth. |
| Brand Valuation | $480 Billion – $516 Billion | Estimated financial value generated solely by brand recognition and loyalty. | Industry-leading customer retention, premium pricing power, and brand strength. |
| Stockholders' Equity | $50 Billion – $65 Billion | Assets minus Liabilities recorded under US GAAP on SEC Form 10-K balance sheet. | Kept intentionally compact due to capital return programs (stock repurchases). |
| Annual Net Revenue | $385 Billion – $400+ Billion | Total top-line revenue collected across Hardware and Services segments. | Consistent iPhone sales, expanding Services sub-ecosystems, and Mac/iPad refreshes. |
| Annual Net Income | $93 Billion – $100+ Billion | Total bottom-line net profit after operating expenses, taxes, and R&D. | Unmatched operational efficiency and high-margin digital service expansion. |
| Total Cash & Securities | $140 Billion – $156 Billion | Cash, cash equivalents, and short/long-term marketable securities. | Enormous liquidity reserve allowing ongoing R&D funding, dividends, and buybacks. |
Primary Drivers of Apple's Multi-Trillion-Dollar Valuation
Apple's valuation is built on a resilient revenue model that combines high-margin hardware with an expanding digital services ecosystem. Several core engines drove the company's financial evaluation throughout 2025.
- Apple's Core Ecosystem
- Hardware (iPhone/Mac, iPad/Wear)
- Services (App Store/iCloud/Pay)
- Apple Silicon (In-House Innovation)
- Multi-Trillion-Dollar Value
1. The iPhone Ecosystem and Device Install Base
The iPhone remains Apple's primary economic engine, generating roughly half of total corporate revenue. However, Wall Street values Apple not just for individual phone sales, but for the expanding active device installed base, which exceeded 2.2 billion active devices worldwide entering 2025.
This vast hardware footprint creates a high barrier to entry for competitors. Customer retention rates for iPhone users regularly exceed 90% in major markets, providing high visibility into future hardware upgrade cycles and steady cash flow generation.
2. Rapid Expansion of High-Margin Services
Apple’s Services segment—which encompasses the App Store, iCloud, Apple Pay, Apple Music, Apple TV+, AppleCare, and advertising—has transformed the company's profitability profile.
- Profit Margins: While hardware gross margins typically average between 36% and 38%, Services gross margins frequently top 70% to 74%.
- Recurring Revenue Stream: Software subscriptions and transaction fees create a predictable income stream that acts like a recurring utility fee paid by billions of consumers.
- Valuation Multiples: Investors reward software and subscription revenues with higher earnings multiples than traditional consumer electronics hardware, significantly expanding Apple's overall price-to-earnings (P/E) ratio.
3. Apple Silicon and Supply Chain Efficiency
Beginning with the transition to M-series chips for Mac computers and continuous upgrades to A-series smartphone processors, Apple brought its core chip architecture in-house.
By designing customized ARM-based architecture and partnering closely with fabrication leaders like Taiwan Semiconductor Manufacturing Company (TSMC), Apple achieved superior performance-per-watt efficiency while capturing higher gross margins. Replacing third-party component suppliers reduced licensing costs, enhanced hardware-software integration, and fortified Apple's technological moat.
4. Aggressive Capital Return: The Stock Buyback Strategy
One of the key reasons Apple’s market value remains high while its accounting net worth (stockholders' equity) stays low is its capital distribution strategy. Since initiating its capital return program in 2012, Apple has repurchased over $650 billion of its own common shares.
- Yearly Cash Flow Generation: High Net Profits (~$100B)
- Share Repurchase Program: Buys Back & Retires Billions in Stock
- Balance Sheet Impact: Retained Earnings Transfer Out of Stockholders' Equity
- Result: Lower Accounting Book Value, Higher Earnings Per Share (EPS), Higher Stock Price
When a company buys back its own stock, it pays cash to purchase shares on the open market and retires them. This reduces total cash on the asset side and reduces retained earnings on the equity side of the balance sheet.
Because total shares outstanding decrease, future net income is divided among fewer shares, raising Earnings Per Share (EPS). Higher EPS directly supports higher stock prices on Wall Street, driving total market capitalization upward while suppressing accounting book value.
How Independent Agencies Value the "Apple" Brand
Brand valuation is distinct from market capitalization. Agencies like Brand Finance and Interbrand employ complex financial modeling to isolate the monetary value of a company's brand name from its physical assets, factories, cash reserves, and technological patents.
The Royalty Relief Method
The standard international framework for valuing enterprise brands (ISO 10668) often relies on the Royalty Relief Method. This methodology calculates brand value through a multi-step financial approach:
- Brand Royalty Rate Determination: Analysts review public licensing agreements in comparable sectors to determine what royalty percentage a third party would pay to license the "Apple" name and logo (often estimated between 5% and 10% of revenue).
- Brand Strength Index (BSI): The agency evaluates non-financial metrics, including brand awareness, net promoter scores (NPS), customer satisfaction, operational ESG practices, and corporate reputation, converting them into a score out of 100.
- Attributable Revenue Isolation: Analysts calculate the percentage of future revenues tied directly to brand preference rather than price discounting or basic utility.
- Discounted Cash Flow Application: Net post-tax brand revenues are discounted back to present value using a specific cost-of-capital rate.
Using these parameters, Brand Finance's Global 500 Report valued the standalone Apple brand at $516.6 billion, citing unmatched customer brand loyalty and ecosystem stickiness. Interbrand similarly placed Apple at the top of its Best Global Brands rankings, valuing the brand equity at nearly $480 billion–$500 billion.
Market Cap vs. Book Value vs. Brand Value: A Comparison
To illustrate how these distinct metrics reflect different aspects of Apple Inc.'s corporate structure, consider how each measures a different dimension of the business:
- Market Capitalization: ~$3.5 Trillion
- What the public stock market is willing to pay for all future discounted profits.
- Standalone Brand Value: ~$500 Billion
- The estimated financial value derived strictly from brand reputation and loyalty.
- GAAP Stockholders' Equity: ~$55 Billion
- The historical cost of physical assets remaining after paying off all liabilities.
Financial analysts rarely look at book value to evaluate asset-light technological leaders. Instead, market valuation relies on discounted cash flow (DCF) models, where expected future earnings—supported by brand loyalty, custom technology, and high-margin services—are discounted back to present value.
Primary Risks and Catalysts Impacting Valuation
Apple's multi-trillion-dollar trajectory faces ongoing shifts in regulatory frameworks, technological integration, and global supply chains.
1. Artificial Intelligence Integration (Apple Intelligence)
The rollout of "Apple Intelligence" across iOS and macOS platforms represents a key valuation catalyst.
- Hardware Upgrade Supercycle: Advanced local AI processing requires higher baseline DRAM memory and newer NPU (Neural Processing Unit) silicon, encouraging users to upgrade older devices sooner.
- Services Monetization: Integrating third-party AI models and proprietary premium features into Siri and system apps gives Apple new opportunities to generate subscription revenue.
2. Global Regulatory and Antitrust Challenges
Regulatory pressure represents one of the largest downside risks to Apple's valuation multiples:
- European Union Digital Markets Act (DMA): Regulatory mandates in Europe force Apple to allow third-party app stores, alternative payment gateways, and browser engines on iOS. These rules could pressure high-margin App Store commission rates.
- U.S. Department of Justice Antitrust Lawsuit: Legal challenges targeting Apple's ecosystem integration could limit how seamlessly first-party apps and hardware operate together compared to third-party alternatives.
- Google Search Licensing Revenue: Judicial rulings involving Alphabet’s distribution agreements could impact the multi-billion-dollar annual payments Google makes to Apple to remain the default search engine on Safari.
3. Supply Chain Diversification
Geopolitical tensions and manufacturing concentration risk have prompted Apple to diversify its supply chain footprint.
While the majority of flagship hardware assembly historically occurred in China, Apple has expanded manufacturing operations in India, Vietnam, and alternative hubs. Managing this transition without disrupting production yield or inflating unit production costs is essential to maintaining gross margins.
How Financial Analysts Value Apple Inc.
When investment managers assess whether Apple stock is accurately priced relative to its net worth and earnings power, they evaluate several core valuation metrics:
1. Price-to-Earnings (P/E) Multiple
The P/E ratio measures market share price relative to net income per share. Throughout 2024 and 2025, Apple traded at a trailing P/E ratio between 28x and 35x earnings. Investors willingly pay this premium relative to broad market averages (like the S&P 500 index) due to Apple's high return on invested capital (ROIC) and consistent cash flow generation.
2. Free Cash Flow (FCF) Yield
Free cash flow measures the operating cash a business generates after deducting capital expenditures (CapEx) required to maintain and expand its physical asset base. Apple consistently generates between $100 billion and $110 billion in FCF annually. This cash generation supports its ongoing dividend payout and share buyback programs without taking on net operational debt.
3. Enterprise Value-to-EBITDA (EV/EBITDA)
Enterprise Value adjusts total market capitalization by adding corporate debt and subtracting total cash reserves. By evaluating EV against Earnings Before Interest, Taxes, Depreciation, and Amortization (EBITDA), institutional investors can compare Apple's operating performance against tech peers like Microsoft, Alphabet, Meta, and Amazon regardless of differences in capital structure.
Frequently Asked Questions
What is the difference between Apple's market cap and its net worth?
Market capitalization represents the total open-market value of all public common stock (ranging between $3.3 trillion and $3.7 trillion in 2025). Accounting net worth (stockholders' equity) measures physical and recorded assets minus total balance sheet liabilities, which sits near $50 billion to $60 billion due to Apple's massive stock buyback strategy.
Is Apple the most valuable company in the world?
Apple consistently ranks among the top three most valuable public corporations worldwide alongside Microsoft and NVIDIA. Ranking leadership frequently shifts based on daily stock price movements, tech sector earnings reports, and market momentum around artificial intelligence hardware and software adoption.
How much cash reserve does Apple hold on its balance sheet?
Apple maintains cash, cash equivalents, and marketable securities reserves typically totaling between $140 billion and $156 billion. However, the company also carries long-term corporate debt, operating with a target to eventually reach a "net cash neutral" position over time.
How is Apple's standalone brand value calculated at over $500 billion?
Valuation consultancies like Brand Finance use ISO-compliant methodologies such as the Royalty Relief Method. This process estimates the revenue attributable directly to the Apple name, projects future royalty streams, adjusts for customer loyalty metrics, and discounts those financial flows back to present net value.
Why is Apple's accounting net worth low compared to its trillion-dollar market valuation?
GAAP accounting standards record physical assets and operational debt at historical acquisition costs rather than future earnings power. Furthermore, Apple uses its excess cash flow to repurchase and retire hundreds of billions of dollars of its own stock, intentionally reducing equity recorded on its SEC balance sheet while increasing earnings per share.
Strategic Implications for Investors and Analysts
Evaluating Apple’s financial standing requires looking beyond basic balance sheet net worth. The company's true financial power lies in its cash flow generation, brand equity, ecosystem lock-in, and capital allocation strategy.
- Monitor Services Growth Rate: Track the percentage of total net revenue generated by the Services division relative to hardware. Higher software revenue shares directly support higher valuation multiples.
- Watch Regulatory Developments: Pay close attention to global regulatory decisions regarding App Store commission models and default search engine contracts, as these affect high-margin income streams.
- Assess Capital Return Yields: Evaluate how efficiently management deploys its $100+ billion annual free cash flow toward dividends, share repurchases, and strategic AI investments.
| Summary Takeaways | Details |
|---|---|
| Wall Street Market Cap | $3.3T – $3.7T (Future Cash Flow Pricing) |
| Independent Brand Value | ~$500B+ (Intangible Loyalty Value) |
| SEC Accounting Net Worth | ~$50B – $65B (Adjusted Book Value) |
For institutional investors, corporate equity analysts, and business strategists, Apple demonstrates how a powerful brand and capital return strategy can decouple market valuation from standard historical accounting measures.