The asset turnover ratio is a fundamental financial metric that measures a company's efficiency in using its assets to generate revenue or sales. Calculated by dividing net sales by total assets, a higher ratio indicates greater operational efficiency, showing how effectively management deploys capital to drive business performance.
Introduction to the Asset Turnover Ratio
In financial analysis, assessing profitability alone only tells half the story. A business might post impressive net income figures, but if it requires billions of dollars in machinery, real estate, and inventory to achieve those earnings, the capital might be better deployed elsewhere. This is where activity ratios, specifically the asset turnover ratio, become indispensable.
The asset turnover ratio definition is rooted in operational efficiency. It quantifies how many dollars of sales a company generates for every single dollar of assets it owns. For example, if a retail corporation maintains an asset turnover ratio of 2.0, it means the organization generates two dollars of revenue for every one dollar tied up in its asset base. By evaluating this metric, analysts, investors, and internal managers can look past raw top-line revenue to understand the underlying productivity of corporate resources.
Understanding this metric requires looking beyond a single calculation period. It involves examining industry norms, understanding asset composition, and recognizing how changes in asset management strategy impact overall financial health. The following sections explore the mechanics of this metric, its calculation, strategic interpretation, and inherent limitations.
Core Definition and Mathematical Formula
At its core, the asset turnover ratio is an activity or utilization ratio. It expresses the relationship between short-term or long-term resource deployment and commercial output.
The Standard Formula
The formula for calculating the asset turnover ratio is straightforward:
$$\text{Asset Turnover Ratio} = \frac{\text{Net Sales}}{\text{Total Assets}}$$
To break down the components:
- Net Sales: This figure represents total gross revenue minus any returns, allowances, and discounts. It is pulled directly from the income statement. Analysts typically use net sales rather than gross sales to ensure the ratio reflects actual realized revenue.
- Total Assets: This figure encompasses all economic resources owned or controlled by the enterprise, including both current assets (cash, accounts receivable, inventory) and non-current assets (property, plant, and equipment, intangible assets). Because the balance sheet provides a snapshot of assets at a single point in time, analysts frequently use average total assets to ensure accuracy over the period being measured.
Using Average Total Assets
Using average total assets helps smooth out seasonal fluctuations or major capital expenditures made midway through a fiscal year. The refined formula is:
$$\text{Average Total Assets} = \frac{\text{Beginning Total Assets + Ending Total Assets}}{2}$$
$$\text{Asset Turnover Ratio} = \frac{\text{Net Sales}}{\text{Average Total Assets}}$$
Using this adjusted denominator ensures that if a company acquired a massive manufacturing plant in December, the denominator reflects the weighted presence of that asset rather than skewing the ratio unfairly if net sales are measured across the full twelve months.
Step-by-Step Calculation Example
To illustrate how the asset turnover ratio functions in practice, consider a hypothetical manufacturing firm, Acme Industrial Corp.
Financial Data for Acme Industrial Corp.
- Net Sales for the Year: $10,000,000
- Total Assets at Beginning of Year: $4,000,000
- Total Assets at End of Year: $6,000,000
Step 1: Calculate Average Total Assets
First, determine the average asset base over the course of the reporting period by adding the beginning and ending asset values and dividing by two:
$$\text{Average Total Assets} = \frac{$4,000,000 + $6,000,000}{2} = $5,000,000$$
Step 2: Apply the Asset Turnover Formula
Next, divide the net sales by the calculated average total assets:
$$\text{Asset Turnover Ratio} = \frac{$10,000,000}{$5,000,000} = 2.0$$
Step 3: Interpret the Result
Acme Industrial Corp. has an asset turnover ratio of 2.0. This means that for every $1.00 invested in assets, the company generates $2.00 in net sales. Whether this is a strong performance depends entirely on the industry in which Acme operates, as capital intensity varies significantly across sectors.
Industry Variations and Capital Intensity
A high asset turnover ratio is not universally superior to a low ratio; context is vital. Different business models require vastly different levels of capital investment to operate. Comparing a software-as-a-service (SaaS) provider to a freight railway illustrates this divergence.
Capital-Light vs. Capital-Intensive Sectors
- Capital-Light Industries (e.g., Software, Consulting, Retail Brokerage): These businesses require minimal physical infrastructure, inventory, or heavy machinery to produce revenue. Consequently, their total asset base is small relative to their sales volume. These sectors typically feature high asset turnover ratios, often exceeding 1.5 or 2.0.
- Capital-Intensive Industries (e.g., Utilities, Telecommunications, Heavy Manufacturing, Rail): These organizations must invest heavily in physical infrastructure—such as power grids, cell towers, factories, or locomotives—before they can generate a single dollar of revenue. Because their denominator (total assets) is massive, their asset turnover ratios are naturally much lower, frequently falling below 0.5.
| Industry Segment | Typical Business Model | Relative Asset Base | Typical Asset Turnover Profile |
|---|---|---|---|
| Retail & Grocery | High inventory velocity, low margins | Moderate | High (2.0 to 3.0+) |
| Software / Tech | Intellectual property, minimal physical plant | Low | Moderate to High (1.0 to 2.0) |
| Automotive | Heavy assembly plants, supply chain management | High | Moderate (0.8 to 1.2) |
| Utilities / Energy | Power plants, transmission grids, pipelines | Very High | Low (0.1 to 0.4) |
When analyzing a company, financial professionals always benchmark its asset turnover ratio against direct industry peers rather than against broad, cross-sector averages.
Dissecting the Ratio: Specialized Asset Turnover Metrics
While the overall asset turnover ratio provides a top-level view, analysts often break down the asset base into specific components to pinpoint operational bottlenecks.
Fixed Asset Turnover Ratio
The fixed asset turnover ratio measures how efficiently a company utilizes its property, plant, and equipment (PP&E) to generate sales.
$$\text{Fixed Asset Turnover Ratio} = \frac{\text{Net Sales}}{\text{Net Property, Plant, and Equipment}}$$
A declining fixed asset turnover ratio often signals that a company has overinvested in machinery or real estate that is sitting idle or underutilized. Conversely, a rising ratio suggests that management is squeezing maximum output out of its existing physical footprint.
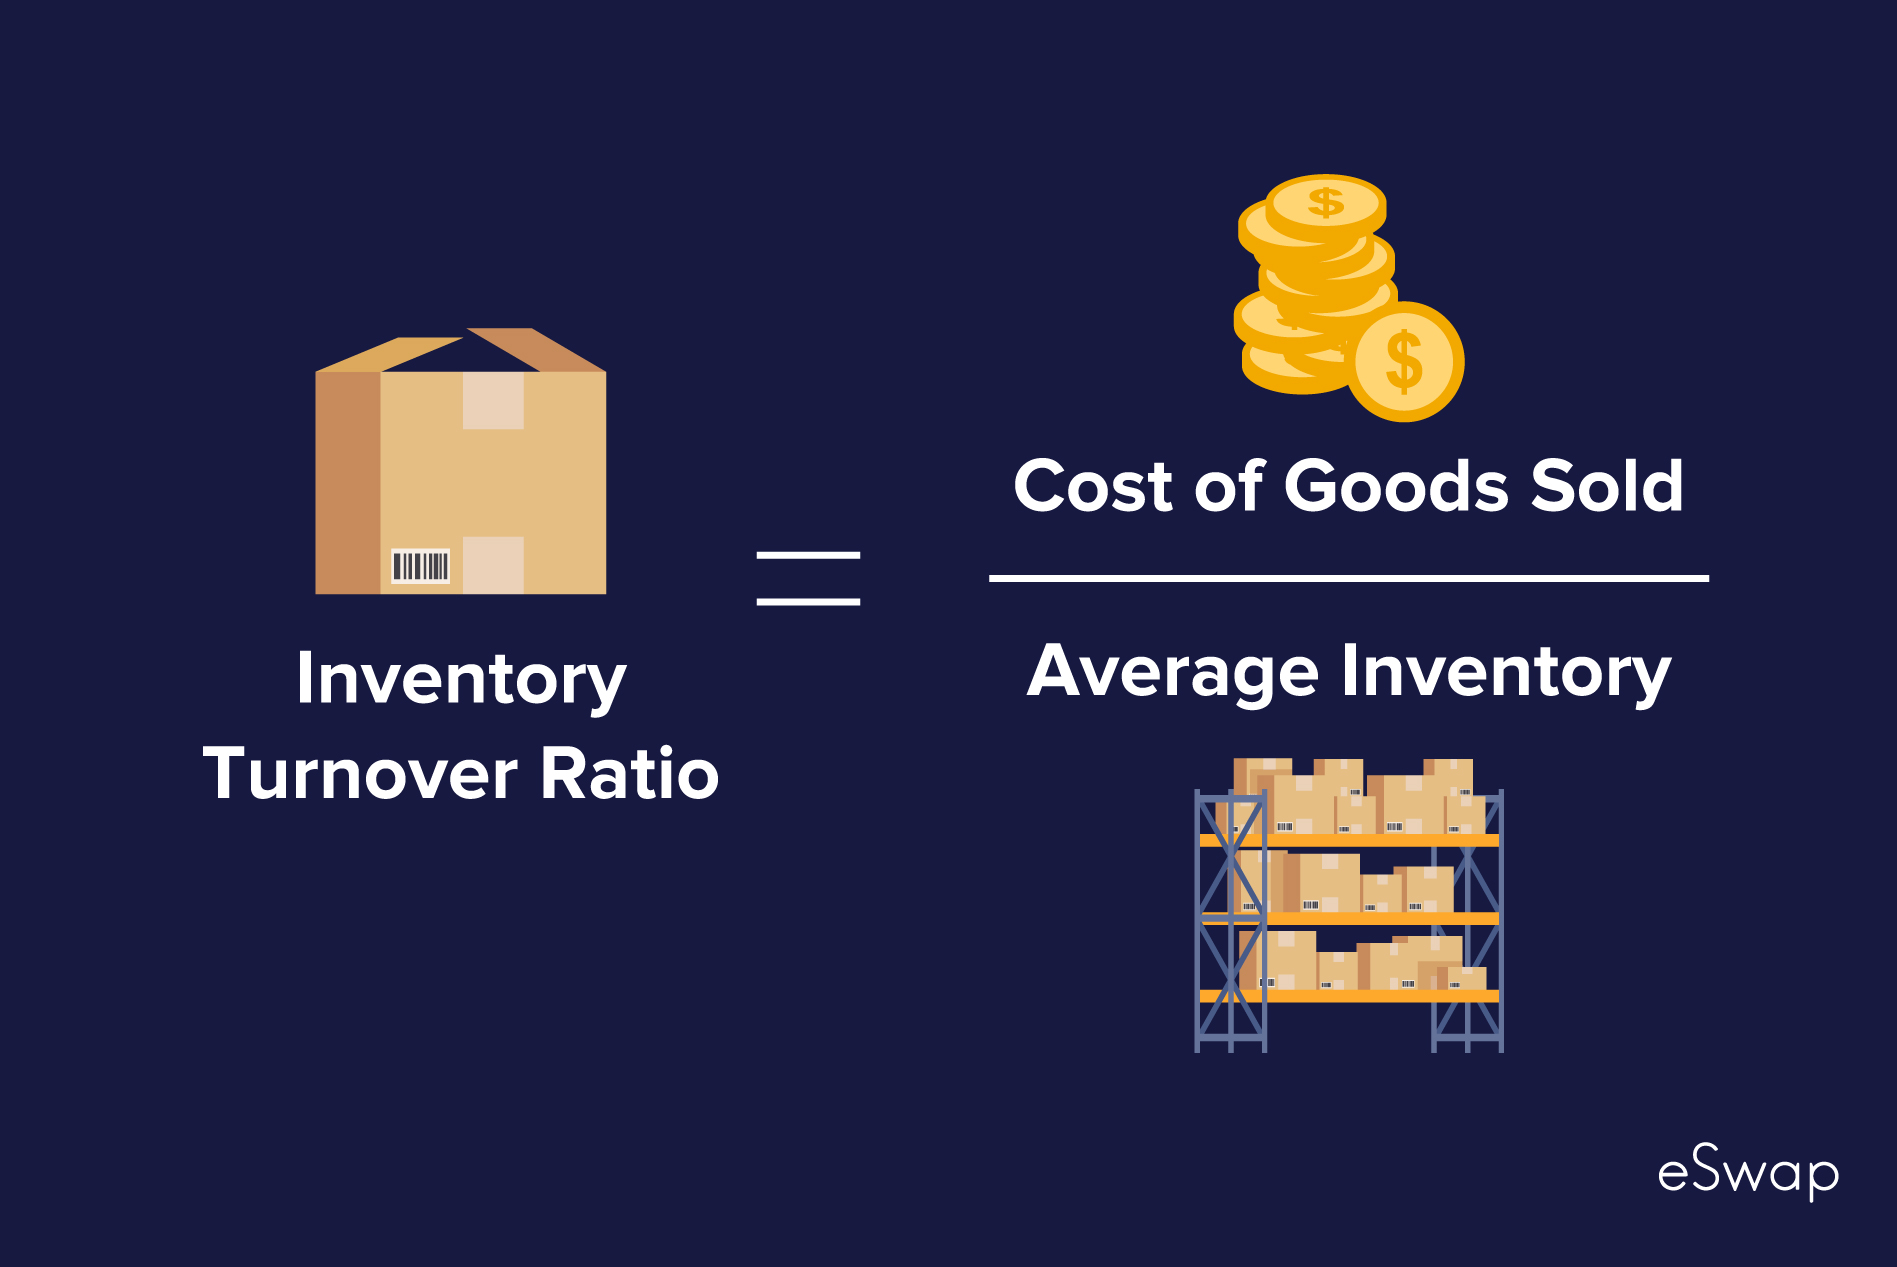
Inventory Turnover Ratio
Inventory is a major component of current assets for many commercial businesses. The inventory turnover ratio measures how many times a company sells and replaces its stock of goods over a period.
$$\text{Inventory Turnover Ratio} = \frac{\text{Cost of Goods Sold}}{\text{Average Inventory}}$$
An efficient inventory turnover means goods are moving rapidly from shelves to customers, reducing warehousing costs and minimizing the risk of obsolescence.
Accounts Receivable Turnover Ratio
The accounts receivable turnover ratio evaluates how efficiently a company collects cash from its credit customers.
$$\text{Accounts Receivable Turnover Ratio} = \frac{\text{Net Credit Sales}}{\text{Average Accounts Receivable}}$$
A higher ratio indicates that debt collection is prompt, ensuring liquidity. A low ratio suggests that the company is acting as an uncompensated bank for its customers by offering excessively lenient credit terms or failing to collect overdue invoices.
The Du Pont Analysis Framework
The asset turnover ratio plays a critical starring role in the DuPont Analysis, a framework used to decompose the drivers of return on equity (ROE). Developed by Donaldson Brown at the DuPont Corporation in the 1920s, this model breaks ROE down into three distinct financial components:
- Profit Margin (Net Income / Net Sales): Measures operating profitability.
- Asset Turnover (Net Sales / Total Assets): Measures operational efficiency.
- Financial Leverage (Total Assets / Shareholders' Equity): Measures debt usage.
Mathematically, when multiplied together, the sales terms cancel out:
$$\text{ROE} = \left(\frac{\text{Net Income}}{\text{Net Sales}}\right) \times \left(\frac{\text{Net Sales}}{\text{Total Assets}}\right) \times \left(\frac{\text{Total Assets}}{\text{Shareholders' Equity}}\right)$$
This relationship reveals that a company can achieve a high return on equity through two entirely different strategic paths:
- High-Margin, Low-Turnover Model: Companies like luxury automakers or branded pharmaceutical firms maintain high profit margins per unit sold, but sell fewer total units relative to their asset base.
- Low-Margin, High-Turnover Model: Discount retailers and supermarkets operate on razor-thin profit margins (e.g., 1% to 3%), but achieve stellar financial returns by turning over their inventory and asset base dozens of times per year.
Limitations and Common Misinterpretations
While powerful, the asset turnover ratio has notable limitations that analysts must account for to avoid drawing erroneous conclusions.
1. The Distortion of Historical Cost Accounting
Under standard accounting rules, property, plant, and equipment are recorded on the balance sheet at historical cost minus accumulated depreciation. Consequently, an older manufacturing plant built thirty years ago appears on the books at a fraction of its replacement value.
This creates a significant distortion: two identical companies with the same physical output will report vastly different asset turnover ratios simply because one owns older, fully depreciated assets (resulting in a smaller denominator and a higher ratio), while the other recently built a modern facility at current market prices (resulting in a larger denominator and a lower ratio).
2. The Impact of Leasing versus Owning
Companies that lease their real estate, storefronts, or equipment through operating leases often report fewer assets on their balance sheets compared to competitors that purchase these items outright. Although modern accounting standards (such as ASC 842 and IFRS 16) require the capitalization of most operating leases onto the balance sheet as right-of-use assets, legacy variations and off-balance-sheet arrangements can still distort cross-company comparisons.
3. Manipulation via Sales Volume and Asset Sales
Management teams under pressure to improve performance metrics can artificially manipulate the ratio in the short term:
- Asset Dumping: Selling off major assets late in a reporting period reduces the denominator, temporarily boosting the ratio without necessarily improving operational efficiency.
- Aggressive Discounting: Slashing prices to liquidate inventory drives up net sales in the numerator, boosting the asset turnover ratio at the direct expense of profit margins.
A high asset turnover ratio is only valuable if it is accompanied by healthy profit margins. Generating massive sales volume at a net loss destroys shareholder value regardless of how efficiently the assets were utilized to produce those unprofitable sales.
Frequently Asked Questions
What is a good asset turnover ratio?
There is no universal "good" asset turnover ratio because capital intensity varies wildly by industry. For instance, a grocery store chain might look healthy with a ratio of 3.0, while a utility company is completely normal operating at 0.3. The key is to compare a company’s ratio against direct competitors and historical internal benchmarks.
How does asset turnover differ from inventory turnover?
Asset turnover measures how efficiently a company uses its entire asset base—including cash, receivables, inventory, property, and equipment—to generate sales. Inventory turnover is a narrow, specialized metric that looks exclusively at how quickly inventory is sold and replaced.
Can a company have a high asset turnover ratio and still be unprofitable?
Yes. A company can aggressively discount its products to maximize sales volume, driving up its asset turnover ratio. However, if those items are sold below the cost of production, the business will generate high revenue alongside crippling net losses, rendering the high turnover meaningless.
Why do asset turnover ratios fluctuate from year to year?
Fluctuations usually stem from two sources: significant shifts in revenue due to market demand, or major capital expenditures. If a company acquires a new subsidiary, builds a distribution center, or writes off impaired assets, the denominator changes significantly, altering the ratio even if sales remain constant.
How do seasonal businesses handle the asset turnover calculation?
Seasonal businesses—such as holiday retailers or agricultural enterprises—experience massive swings in inventory and receivables throughout the year. To prevent distortion, analysts use average total assets calculated across multiple quarters rather than simply relying on year-end balance sheet figures.
Summary and Next Actions
The asset turnover ratio is an essential tool for evaluating how capably corporate management translates economic resources into commercial revenue. By connecting the income statement's net sales to the balance sheet's total assets, it cuts through vanity revenue metrics to reveal true operational productivity.
When evaluating an organization, avoid reviewing this metric in isolation. Pair it with profit margins, return on equity (via DuPont analysis), and peer group comparisons to build an accurate picture of financial health. For financial analysts and investors, examining multi-year trends in asset turnover provides early warning signs of operational stagnation or management excellence.