Ansible CMDB solutions transform gathered system facts and inventory definitions into structured configuration management reports. By aggregating host telemetry via Ansible's setup module or integrating playbooks with external CMDB platforms, IT operations teams gain clear visibility into infrastructure assets, hardware specifications, installed software, and network topologies without installing proprietary agents.
What is an Ansible CMDB and How Does It Work?
A Configuration Management Database (CMDB) serves as the single source of truth for an organization's IT infrastructure. It tracks configuration items (CIs)—such as virtual machines, physical servers, network switches, cloud instances, and storage arrays—alongside their operational status, dependencies, and metadata. In traditional enterprise environments, populating and maintaining a CMDB requires deploying resource-intensive software agents across thousands of endpoints.
Ansible alters this workflow through its agentless architecture. When Ansible executes playbooks or ad-hoc tasks across managed nodes, it automatically executes its internal setup module during a phase known as fact gathering. This module inspects the target operating system, collecting deep telemetry known as ansible_facts. These facts cover hardware architectures, assigned IP addresses, network routing tables, memory allocations, disk partition layouts, OS build numbers, CPU architecture, and active services.
In the context of Ansible automation, the term Ansible CMDB refers to two distinct but related operational concepts:
- Dedicated Report Generators (
ansible-cmdb): Standalone open-source utilities that digest raw JSON output from Ansible fact-gathering tasks and render them into human-readable HTML dashboards, searchable web tables, CSV files, or SQL databases. - CMDB Integration Architecture: The process of using Ansible as a data collector or provisioning engine that feeds live system state data directly into enterprise ITSM (IT Service Management) platforms like ServiceNow, iTop, or NetBox via REST API modules and dynamic inventory scripts.
By leveraging Ansible for configuration tracking, systems administrators remove the friction of manually maintaining asset spreadsheets. Infrastructure management shifts from passive, out-of-date documentation to automated, self-documenting workflows that run alongside regular maintenance playbooks.
Core Capabilities of the ansible-cmdb Utility
The utility known as ansible-cmdb is a widely adopted open-source static site generator designed specifically to transform Ansible fact dumps into navigable host reports. Rather than running continuously as a heavy daemon, ansible-cmdb executes as a CLI tool that parses saved JSON fact files gathered from managed nodes.
1. Multi-Format Output Generation
The primary strength of ansible-cmdb lies in its flexible rendering engine. Administrators can generate multiple views depending on the audience:
- HTML Fancy: A fully self-contained HTML file featuring an interactive JavaScript interface. Users can search by hostname, filter nodes by operating system version, sort by RAM or CPU count, and collapse host detail panels.
- HTML Split: Generates individual HTML pages per host alongside an index page, making it ideal for hosting within internal documentation portals or web servers.
- CSV Exports: Flattens system facts into tabular rows suitable for importing into legacy reporting systems, Excel spreadsheets, or procurement tools.
- SQL Schemas: Outputs direct
INSERTstatements to populate MySQL, PostgreSQL, or SQLite database tables for custom business intelligence queries. - Markdown Summaries: Produces clean Markdown document structures ready for inclusion in enterprise wiki platforms like GitHub Wiki or Confluence.
2. Extensibility via Custom Facts
Standard facts gathered by Ansible provide baseline metrics such as kernel versions and IP addresses. However, modern infrastructure requires application-aware asset tracking. ansible-cmdb reads custom facts stored on target systems under /etc/ansible/facts.d/ (or specified via local fact plugins). If a playbook writes custom JSON files to those directories—such as application version numbers, primary contact tags, or deployment environments—ansible-cmdb captures and displays these attributes alongside standard hardware metrics.
3. Custom Template Support
The tool uses the Mako templating engine, allowing DevOps teams to customize the layout of generated HTML dashboards. If security compliance rules require displaying specific cipher settings, local user lists, or storage encryption statuses, engineers can author custom Mako templates to expose these variables directly on the main summary view.
Step-by-Step Architecture: Gathering Facts and Generating Reports
Implementing an automated report workflow using Ansible and ansible-cmdb requires a structured pipeline: installing the tool, collecting host facts, and generating output reports.
- Ansible Control Node (Ad-Hoc): Connects via SSH to Managed Target Nodes (Gathers facts.d & OS).
- Managed Target Nodes: Saves gathered facts to the Local JSON Fact Cache Directory.
- Executing
ansible-cmdb: Renders data from the Local JSON Fact Cache Directory into an Interactive Dashboard (overview.html). - Interactive Dashboard (overview.html): Deploys to a Static Web Server or Internal Wiki.
Prerequisites
- An Ansible control node running Linux or macOS.
- Established SSH connectivity or WinRM links to target hosts.
- Python installed on the control node.
Step 1: Install ansible-cmdb
The utility can be installed directly on the Ansible control node using standard Python package managers:
pip install ansible-cmdb
Alternatively, system installers (.deb or .rpm packages) are available for Debian, Ubuntu, Red Hat Enterprise Linux, and CentOS distributions.
Step 2: Execute Fact Gathering Across Managed Nodes
To build the host database, run an ad-hoc Ansible command that target all defined inventory groups using the built-in setup module. The --tree switch instructs Ansible to output the gathered JSON payload for every host into a designated destination directory:
ansible all -m setup --tree out/
For environments requiring custom configuration or credential handling, the same fact-gathering task can be encapsulated within a standard Ansible playbook:
- hosts: all gather_facts: yes tasks: - name: Ensure facts directory exists locally delegate_to: localhost file: path: ./out state: directory - name: Save host facts to JSON file delegate_to: localhost copy: content: "{{ hostvars[inventory_hostname] | to_nice_json }}" dest: "./out/{{ inventory_hostname }}"
Step 3: Render the CMDB Overview
Once the out/ directory contains JSON files for all target servers, invoke ansible-cmdb to build the static HTML asset dashboard:
ansible-cmdb out/ > overview.html
The resulting overview.html file is completely self-contained, requiring no back-end database server or external API calls. It can be viewed directly in any modern web browser or served via internal web servers such as NGINX or Apache.
Integrating Ansible with Enterprise CMDB Platforms
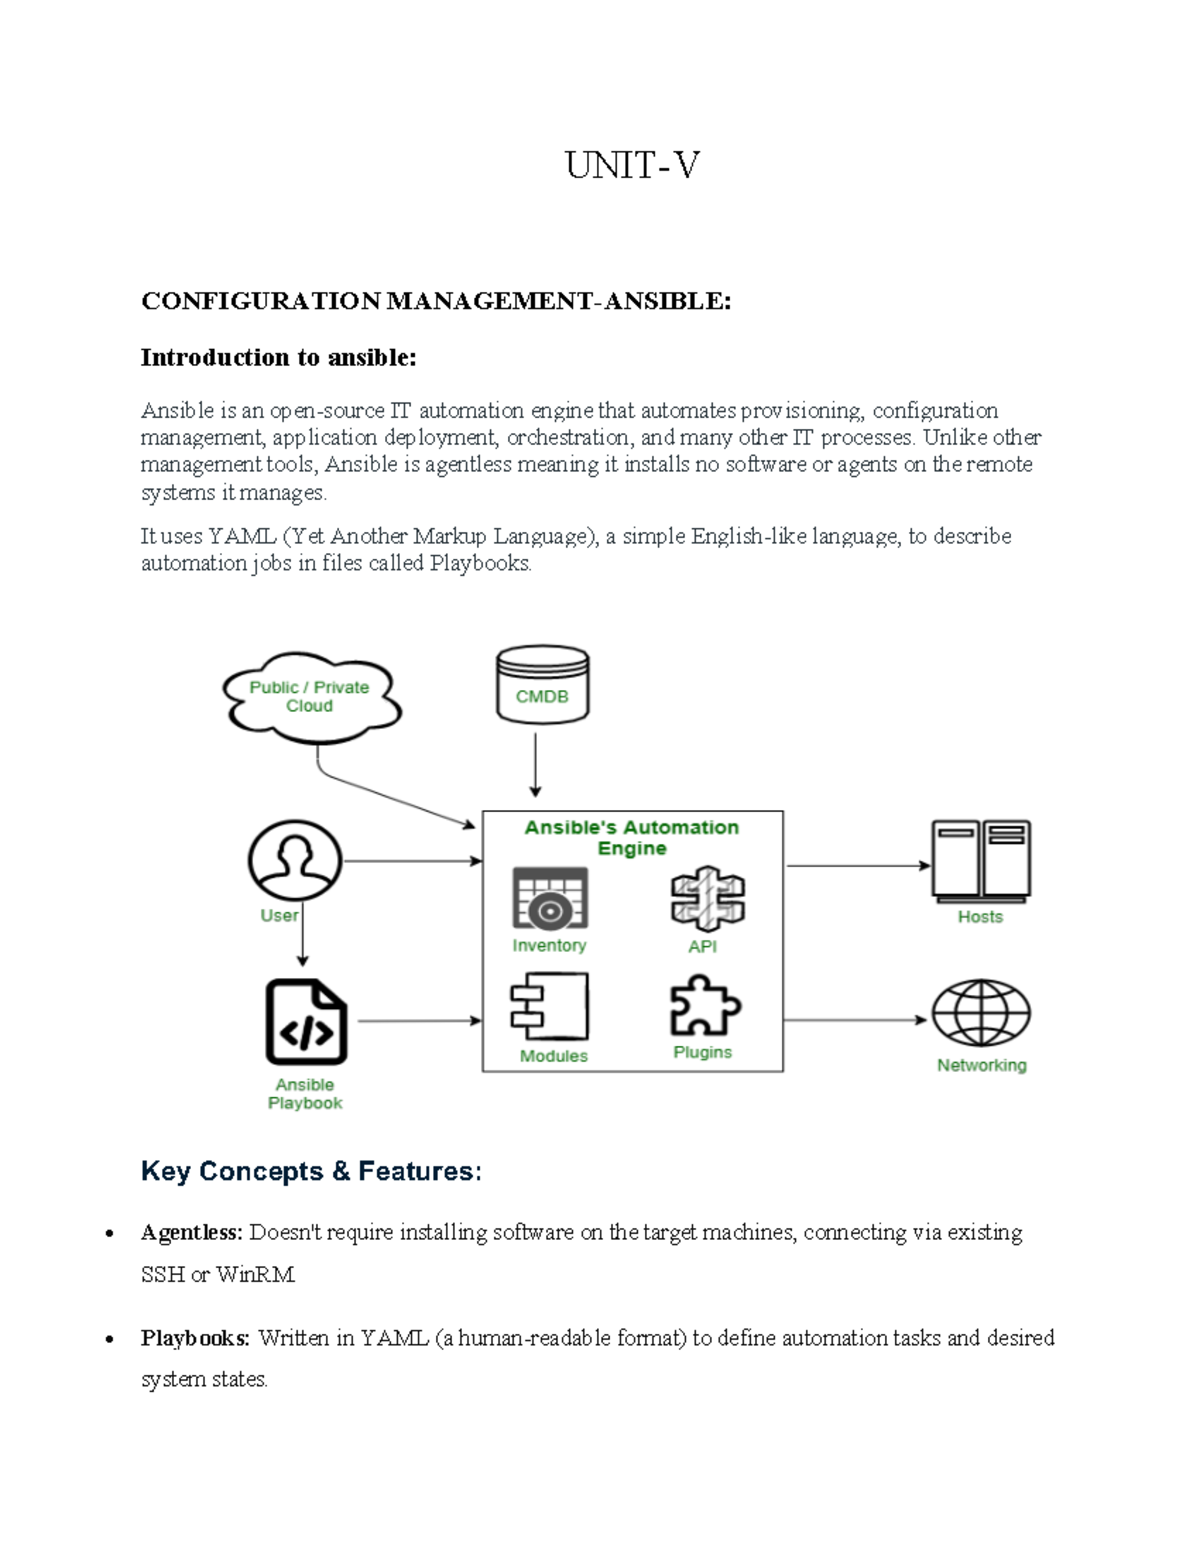
While static HTML reports provide rapid visibility for small to mid-sized teams, larger organizations generally rely on dynamic enterprise CMDB platforms. In these architectures, Ansible acts as both an asset data pipeline and a configuration enforcer, interfacing with centralized platforms like ServiceNow or NetBox.
- Dynamic Inventory: Enterprise CMDB (ServiceNow / NetBox) feeds host inventory data into the Ansible Automation Control Engine.
- REST API Updates: Ansible Automation Control Engine sends live updates back to the Enterprise CMDB (ServiceNow / NetBox).
1. Ansible as a CMDB Data Consumer (Dynamic Inventory)
Instead of relying on static inventory text files (hosts.ini), Ansible can query an existing enterprise CMDB to determine which servers exist, their roles, and their configuration variables.
Through Dynamic Inventory Plugins, Ansible contacts the enterprise CMDB's API during playbook initialization. For instance, querying an instance of NetBox Documentation yields host listings categorized by site, rack, tenant, and device role. This ensures that playbooks are always executed against real-time infrastructure, preventing commands from targeting decommissioned or non-existent hardware.
2. Ansible as a CMDB Data Provider
When infrastructure is provisioned or modified via automated playbooks, Ansible can automatically update host attributes inside the enterprise CMDB. Official collection modules—such as those found in the servicenow.itsm collection—allow playbooks to perform automated record updates:
- Registering new virtual machine IP allocations and MAC addresses.
- Updating software version fields after patching tasks complete.
- Logging change management tickets and updating operational status flags (e.g., changing status from In Maintenance to Active).
By tying CMDB database updates directly to playbook execution, systems teams eliminate "configuration drift" between physical asset states and recorded management database records.
Comparison of Ansible CMDB Approaches
Organizations must evaluate their reporting requirements, security policies, budget constraints, and infrastructure complexity when choosing an asset management strategy. The table below compares the primary methods used to maintain dynamic host visibility within Ansible workflows.
| Metric / Feature | ansible-cmdb (Static Generator) |
Enterprise CMDB (ServiceNow / NetBox) | Native Ansible Automation Controller / AWX |
|---|---|---|---|
| Primary Target Audience | Systems Administrators, SREs, Small-to-Mid IT Teams | Enterprise ITIL Teams, Change Managers, Network Ops | DevOps Engineers, Platform Engineers |
| Deployment Complexity | Very Low (CLI utility, zero infrastructure required) | High (Requires dedicated servers, DBs, API credentials) | Moderate (Requires containerized control plane installation) |
| Data Storage Engine | Static HTML / CSV files rendered on-demand | Relational Database (PostgreSQL, MariaDB, Oracle) | Internal PostgreSQL database |
| Cost & Licensing | Open-Source (MIT/GPL) | Commercial / Subscription (Open-source options like NetBox exist) | Commercial Red Hat Licensing or Open-Source AWX |
| Real-Time Visibility | Snapshot-based (Updated when CLI command runs) | Real-time via API sync hooks and webhook triggers | Event-driven (Updated on execution job completion) |
| Dependency Mapping | Minimal (Focuses on individual node configuration items) | Deep (Supports CI relation topologies and service maps) | Group-based (Organized by inventory hierarchies) |
| Search & Filtering | In-browser filtering across hardware and OS properties | Enterprise-grade SQL/API querying, custom reporting | Basic host tagging and variable search |
Technical Deep Dive: Custom Facts and Advanced Data Enrichment
The real utility of an Ansible-driven CMDB approach emerges when custom facts are collected alongside default operating system telemetry. By extending the facts framework, organizations can capture business logic and application-level details.
Structuring Custom Local Facts
Ansible automatically reads custom facts stored in .fact files within the /etc/ansible/facts.d/ directory on target Unix/Linux hosts. These files can be formatted as JSON, INI, or executable scripts that return valid JSON data.
For example, creating a static JSON file located at /etc/ansible/facts.d/application.fact allows teams to attach application context directly to the host:
{ "app_name": "BillingGateway", "environment": "Production", "owner": "FinanceIT", "compliance_scope": "PCI-DSS" }
When the setup module runs, Ansible creates a structured variable nested under ansible_local:
ansible_facts['ansible_local']['application']['app_name']
Including Custom Facts in ansible-cmdb
The ansible-cmdb generator automatically discovers ansible_local facts present within the raw JSON fact files. On rendered HTML dashboards, custom facts appear under a dedicated Custom Facts tab or host detail panel. This capability enables IT organizations to filter host fleets based on operational context, such as identifying all hosts scoped for specific compliance mandates (e.g., PCI-DSS) or assigned to a specific internal department.
For advanced documentation requirements, custom Mako templates can be passed to ansible-cmdb using the -t parameter:
ansible-cmdb -t custom_template -i inventory/ out/ > custom_report.html
This enables teams to highlight custom metrics—such as installed security agent versions or active backup states—directly on the high-level summary overview board.
Best Practices for Managing Ansible CMDB Workflows
Maintaining accurate configuration reporting across modern hybrid-cloud infrastructure requires disciplined operational practices.
1. Automate Fact Collection via CI/CD Pipelines
Fact collection should not depend on manual operator invocation. Integrate fact collection into scheduled automation pipelines using tools like GitHub Actions, GitLab CI/CD, or scheduled templates within Ansible Automation Controller Documentation. Running automated fact-gathering jobs nightly ensures that dashboard reports reflect current asset states.
2. Implement Fact Caching for Large Scale Fleets
Executing ansible all -m setup across thousands of nodes introduces significant network traffic and control node memory overhead. Enable fact caching inside ansible.cfg to store facts locally in Redis, Memcached, or JSON file backends:
[defaults] gathering = smart fact_caching = jsonfile fact_caching_connection = /tmp/ansible_fact_cache fact_caching_timeout = 86400
Smart gathering prevents Ansible from re-querying nodes if facts were already collected within the configured timeout window, significantly reducing execution time during report generation runs.
3. Mask Sensitive Information and Credentials
Ansible facts can expose sensitive system variables, such as private IP mappings, mounted storage paths, or custom application variables containing operational tokens. When publishing rendered HTML reports to shared web servers:
- Audit custom facts to ensure no API keys or plaintext credentials are stored in
/etc/ansible/facts.d/. - Exclude sensitive host groups using standard Ansible inventory patterns (
ansible 'all:!PCI_Scope' -m setup --tree out/). - Restrict access to static HTML dashboard directories using web server authentication protocols (e.g., OAuth proxies or HTTP basic authentication).
Troubleshooting Common Ansible CMDB Issues
Unreachable Hosts Causing Missing Records
Symptom: Nodes defined in the inventory file do not appear in the generated ansible-cmdb report.Cause: If SSH connections fail or managed nodes time out during the ansible -m setup execution phase, Ansible will not output a JSON file for those specific systems into the output tree directory.Solution: Check host connectivity using ansible all -m ping. Ensure that the SSH user possesses sufficient privileges to execute setup collection scripts. Run fact gathering with the --ignore-unreachable flag or review task failure logs to isolate network or authentication errors.
Deprecated or Stale Host Records in Reports
Symptom: Reports show servers that were decommissioned weeks ago.Cause: The target destination directory (out/) contains leftover JSON fact files from prior execution runs.Solution: Clear the output directory before starting new fact collection passes. Run a script that purges the destination directory prior to executing the setup playbook:
rm -rf ./out/* && ansible all -m setup --tree out/
Memory Exhaustion During Large Dashboard Generation
Symptom: The ansible-cmdb command exits unexpectedly with an OutOfMemory error when parsing thousands of JSON files.Cause: Parsing massive JSON files across large node counts can exhaust the local Python process heap.Solution: Divide host output trees into regional or departmental subdirectories (e.g., out/us-east/, out/europe/). Generate separate rendered HTML dashboards per region, or switch to CSV output formats for processing via external big data platforms:
ansible-cmdb -f csv out/ > inventory_report.csv
Frequently Asked Questions
Can Ansible replace an enterprise CMDB like ServiceNow or NetBox?
Ansible is primarily an automation and orchestration engine, not a relational database designed for ITIL change management. While utilities like ansible-cmdb generate functional system reports, they lack enterprise features such as relationship topology modeling, ticket tracking, and multi-department approvals. Most enterprise architectures use Ansible to collect data and update systems like ServiceNow or NetBox, rather than replacing them entirely.
What is the difference between standard Ansible inventory and an Ansible CMDB?
An Ansible inventory is a static or dynamic file (such as hosts.ini or hosts.yaml) that specifies target hostnames, IP addresses, groups, and SSH connection parameters so Ansible knows where to run playbooks. An Ansible CMDB processes the detailed operational data gathered from those nodes (CPU specs, OS versions, installed software, disk usage) to render comprehensive operational reports and asset tracking dashboards.
Does ansible-cmdb require root privileges to collect system information?
No, ansible-cmdb processes local JSON files on the control node and requires no root privileges. However, the initial step—running the Ansible setup module on managed nodes—executes under whichever remote user account is defined in your SSH configuration. While unprivileged users can gather basic facts, elevated privileges (become: yes) may be required to inspect protected host resources like restricted hardware controllers or system log directories.
How often should Ansible fact-gathering jobs run for CMDB reporting?
The optimal frequency depends on infrastructure volatility. Static environments with physical servers may only require nightly or weekly scheduled fact collection. Fast-moving cloud environments (auto-scaling Kubernetes worker nodes, serverless instances, or temporary CI/CD runner pools) often run fact gathering on-demand or trigger inventory synchronization hooks automatically whenever new instances are provisioned or terminated.
Can custom Ansible modules be used to feed data into an Ansible CMDB?
Yes. Custom modules or playbooks can execute local shell commands, inspect custom software registries, query local APIs, and save the results into JSON structures inside /etc/ansible/facts.d/. Once saved locally on the target node, Ansible's standard setup module automatically includes these user-defined data structures in its global output, allowing ansible-cmdb to parse and display them.
Implementation Roadmap and Next Actions
To successfully implement an automated inventory collection and reporting workflow within your organization, follow this operational roadmap:
- Conduct an Inventory Audit: Verify your primary Ansible inventory files to ensure host names, SSH connection paths, and group variables are accurate across your infrastructure fleets.
- Setup Local Custom Facts: Identify key operational metrics unique to your business (e.g., application ownership tags, deployment environments, compliance frameworks) and deploy custom
.factfiles to/etc/ansible/facts.d/across target hosts. - Establish an Automated Pipeline: Configure a scheduled CI/CD job or job template within Red Hat Ansible Automation Controller / AWX to execute
ansible all -m setup --tree out/on a recurring basis. - Deploy Static Dashboard Hosting: Set up a lightweight, access-controlled internal web server to host generated
overview.htmlfiles, ensuring team members have immediate visibility into IT asset configurations. - Evaluate Enterprise Integration: If your organization relies on ITIL management frameworks, integrate official dynamic inventory plugins to establish bi-directional API sync between Ansible playbooks and your central enterprise CMDB repository.