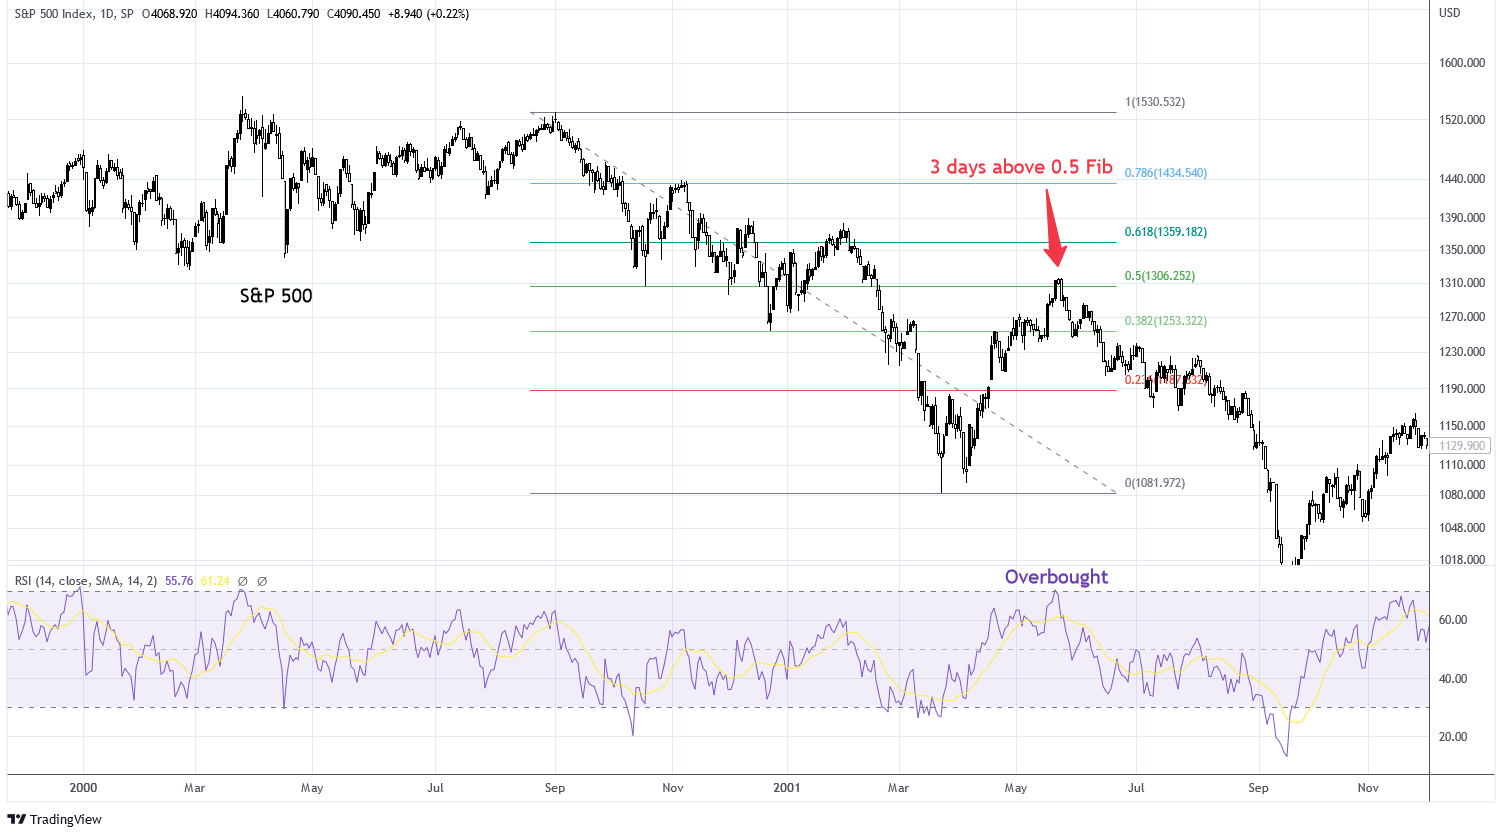
Evaluating the S&P 500 involves analyzing specific financial ratios to determine market valuation and the fundamental health of its constituent companies. These twelve key ratios—including P/E, PEG, and ROE—provide a framework for assessing whether the index is overvalued or presents a buying opportunity, helping investors navigate complex 2026 market conditions.
The Role of Benchmarking in Modern Investment Analysis
The S&P 500 remains the definitive barometer for the United States equity market, representing approximately 80% of the total available market capitalization. As we navigate the economic landscape of 2026, understanding the underlying ratios of this index is not merely an academic exercise; it is a requirement for institutional and retail investors alike who seek to align their portfolios with broader macroeconomic trends.
Ratios allow for a normalized comparison between companies of vastly different sizes and sectors. Because the S&P 500 is market-capitalization-weighted, the ratios of the largest firms—often referred to as the "Magnificent" leaders of the tech and healthcare sectors—disproportionately influence the index-wide averages. Consequently, an investor must distinguish between the "top-heavy" influence on these ratios and the broader performance of the remaining 490+ stocks.
Before diving into the specific metrics, it is vital to understand that no single ratio provides a complete picture. Valuation is a multi-dimensional puzzle. A high Price-to-Earnings (P/E) ratio might signal overvaluation, but when viewed alongside a high Return on Equity (ROE), it may actually indicate a company with a significant competitive "moat" and superior capital efficiency.
1. Price-to-Earnings (P/E) Ratio
The Price-to-Earnings (P/E) ratio is the most widely cited valuation metric in the financial world. It represents the dollar amount an investor can expect to invest in a company in order to receive one dollar of that company’s earnings.
There are two primary versions: the Trailing P/E, which uses earnings from the past 12 months, and the Forward P/E, which utilizes analyst projections for the next 12 months. In the context of the S&P 500, a high P/E ratio typically suggests that investors are expecting higher earnings growth in the future compared to the overall market. Conversely, a low P/E can indicate that a stock is undervalued or that the market expects its earnings to decline.
As of 2026, the S&P 500 Forward P/E is closely watched to gauge if the market has "priced in" current interest rate trajectories and productivity gains from integrated AI technologies. If the index P/E expands significantly beyond its historical average (typically 15-18x), it often signals a period of irrational exuberance or a fundamental shift in how the market values growth.
2. Shiller P/E Ratio (CAPE Ratio)
The Cyclically Adjusted Price-to-Earnings (CAPE) ratio, developed by Nobel laureate Robert Shiller, offers a more stable view than the standard P/E. It divides the current price of the index by the average of ten years of earnings, adjusted for inflation.
The primary benefit of the Shiller P/E is that it smooths out the fluctuations in corporate profits that occur over different phases of the business cycle. For the S&P 500, the CAPE ratio is an essential tool for long-term forecasting. Historically, when the CAPE ratio reaches extreme highs, long-term (10-year) expected returns tend to be lower. In 2026, with the memory of the mid-2020s volatility still fresh, the CAPE ratio serves as a "reality check" against short-term earnings spikes caused by temporary fiscal stimuli or accounting anomalies.
3. Price/Earnings-to-Growth (PEG) Ratio
The PEG ratio enhances the P/E ratio by factoring in the expected earnings growth of the company. A P/E of 30 might seem expensive, but if the company is growing at 30% annually, its PEG ratio is 1.0, which is often considered "fair value."
For S&P 500 analysis, the PEG ratio is crucial because it differentiates between expensive "stagnant" companies and expensive "high-growth" companies. A PEG ratio below 1.0 is generally seen as a sign that a company is undervalued relative to its growth potential. In the 2026 environment, where growth rates are stabilizing following the post-pandemic digital transformation, the PEG ratio helps investors identify sectors where the price hasn't yet caught up to the sustained earnings trajectory.
4. Price-to-Sales (P/S) Ratio
The Price-to-Sales (P/S) ratio compares a company’s stock price to its revenues. This ratio is particularly useful for companies that are not yet profitable or have highly volatile earnings. In the S&P 500, even for established giants, the P/S ratio provides a "cleaner" look at valuation because revenue is much harder to manipulate with accounting tricks than net income.
A rising P/S ratio across the S&P 500 indicates that investors are willing to pay more for every dollar of top-line revenue. This often happens in periods of high confidence or when profit margins are expected to expand significantly. However, a P/S ratio that diverges too far from historical norms can be a warning sign of a "revenue bubble," where the market overestimates the ability of companies to turn sales into actual profit.
5. Price-to-Book (P/B) Ratio
The Price-to-Book (P/B) ratio measures the market's valuation of a company relative to its book value (total assets minus total liabilities). Historically, a P/B ratio of less than 1.0 was the "holy grail" for value investors, suggesting a company was worth more than its market price.
However, in the modern S&P 500, which is dominated by technology and service-oriented firms, P/B ratios have trended higher. This is because many of the most valuable assets today are intangible—patents, software, and brand equity—which are not always fully captured on the balance sheet. In 2026, the P/B ratio remains most effective when evaluating capital-intensive sectors like financials, utilities, and industrials, where physical assets still drive the majority of value.
6. Dividend Yield
The Dividend Yield is a financial ratio that shows how much a company pays out in dividends each year relative to its stock price. For the S&P 500 as a whole, the dividend yield is a critical indicator of the "income" component of total returns.
When the S&P 500 dividend yield is low, it usually means that stock prices are high relative to dividends, or companies are choosing to reinvest their cash into growth or share buybacks rather than distributing it to shareholders. In 2026, the dividend yield is often compared to the yield on the 10-year Treasury note. If the "equity risk premium" (the extra yield you get for taking the risk of stocks over bonds) becomes too thin, investors may rotate out of the S&P 500 and into the safety of fixed income.
7. Dividend Payout Ratio
While the yield tells you what you receive, the Dividend Payout Ratio tells you if that payment is sustainable. It measures the percentage of earnings a company pays out as dividends.
A payout ratio that is too high (e.g., above 80%) suggests that the company is returning almost all its profit to shareholders, leaving little for reinvestment or a cushion in case of an earnings downturn. Conversely, a low payout ratio suggests that the company has room to increase its dividend in the future. For S&P 500 companies, a steady or growing dividend supported by a healthy payout ratio is often a hallmark of "Blue Chip" stability.
8. Return on Equity (ROE)
Return on Equity (ROE) measures a corporation's profitability by revealing how much profit a company generates with the money shareholders have invested. It is calculated by dividing net income by shareholders' equity.
In 2026, ROE is a primary measure of management effectiveness. A high ROE indicates that the management team is proficient at turning equity investments into profit. Within the S&P 500, companies with high ROEs often possess "moats"—competitive advantages like high switching costs or superior technology—that allow them to maintain high margins without the need for excessive debt. Investors should be wary, however, of ROEs that are inflated by high levels of financial leverage (debt).
9. Debt-to-Equity (D/E) Ratio
The Debt-to-Equity (D/E) ratio is a leverage ratio that compares a company’s total liabilities to its shareholder equity. It provides a look at how a company is financing its growth and how much risk it is carrying.
In the current 2026 economic environment, interest rates have stabilized but remain higher than the "zero-bound" era of the early 2020s. Consequently, the D/E ratio for S&P 500 companies is under intense scrutiny. Companies with high D/E ratios may face higher refinancing costs, which can eat into earnings. Analysts look for a D/E ratio that is appropriate for the company's sector; for instance, utilities naturally carry more debt than software companies due to their stable, regulated cash flows.
10. Operating Margin
Operating Margin measures how much profit a company makes on a dollar of sales after paying for variable costs of production, such as wages and raw materials, but before paying interest or taxes.
For the S&P 500, aggregate operating margins are a direct reflection of the economy's efficiency and the "pricing power" of major corporations. If operating margins are shrinking across the index, it suggests that companies are struggling with rising input costs (inflation) or that competition is forcing them to lower prices. High operating margins in 2026 are often a sign of successful automation and AI integration, which has lowered the cost of goods sold for many tech-heavy constituents.
11. Current Ratio
The Current Ratio is a liquidity ratio that measures a company's ability to pay short-term obligations or those due within one year. It is calculated by dividing current assets by current liabilities.
A ratio above 1.0 indicates that the company has more assets than liabilities due in the short term. While the S&P 500 consists of very large, stable companies, the current ratio is still a vital "health check." During periods of credit tightening, companies with a current ratio below 1.0 may struggle to meet their immediate financial commitments, potentially leading to forced asset sales or dilutive equity raises.
12. Free Cash Flow (FCF) Yield
Free Cash Flow (FCF) Yield is a valuation ratio that compares the free cash flow per share a company is expected to earn against its market value per share. Unlike earnings, which can be affected by non-cash accounting entries, free cash flow is the actual "cold hard cash" a company generates.
Many professional investors in 2026 prefer FCF yield over the P/E ratio because it is harder to "window dress." A high FCF yield suggests a company is generating plenty of cash relative to its stock price, which can be used for dividends, debt repayment, or acquisitions. For the S&P 500, a healthy aggregate FCF yield is the ultimate sign of a "cash cow" index that can withstand economic turbulence.
Comparative Summary of S&P 500 Ratios
The following table summarizes the 12 ratios discussed, providing their primary focus and a general guideline for interpretation.
| Ratio | Primary Focus | Calculation (Simplified) | General Preference |
|---|---|---|---|
| P/E Ratio | Valuation | Price / Earnings | Lower (relative to peers) |
| Shiller P/E | Long-term Valuation | Price / 10-yr Avg Earnings | Near or below historic mean |
| PEG Ratio | Growth-adjusted Value | P/E / Growth Rate | Under 1.0 |
| P/S Ratio | Revenue Valuation | Price / Sales | Lower (context dependent) |
| P/B Ratio | Asset Valuation | Price / Book Value | Sector-specific (usually lower) |
| Dividend Yield | Cash Income | Dividend / Price | Higher (if sustainable) |
| Payout Ratio | Div. Sustainability | Dividends / Net Income | 30% - 60% (Moderate) |
| ROE | Profitability/Mgmt | Net Income / Equity | Higher (above 15%) |
| Debt-to-Equity | Leverage/Risk | Total Debt / Equity | Lower (sector dependent) |
| Operating Margin | Efficiency | Operating Income / Sales | Higher (indicates pricing power) |
| Current Ratio | Liquidity | Current Assets / Liabilities | Above 1.0 |
| FCF Yield | Cash Generation | Free Cash Flow / Price | Higher (indicates value) |
Strategic Application: How to Use These Ratios in 2026
When analyzing the S&P 500, professional investors rarely look at these ratios in isolation. Instead, they use them in a Multi-Factor Model. For example, a "Value" screen might look for companies in the S&P 500 with a P/E below 15, a P/B below 2.0, and a Dividend Yield above 2%. A "Quality" screen might ignore P/E entirely and focus on companies with an ROE above 20% and a Debt-to-Equity ratio below 0.5.
Furthermore, these ratios must be compared against historical averages. As of 2026, the historical average P/E of the S&P 500 is roughly 16x. If the current index is trading at 22x, you must ask if the fundamental economic conditions (like lower interest rates or higher expected growth) justify that premium. If they do not, the ratios are signaling that the market may be due for a "mean reversion"—a correction back to the average.
Common Mistakes to Avoid
- Ignoring Sector Differences: A "high" P/E for a Utility company (usually 15) is very different from a "high" P/E for a Software company (usually 40+).
- Using Trailing Data Exclusively: The market is forward-looking. While trailing P/E is factual, forward P/E reflects the expectations that actually drive price movement.
- Overlooking Debt: A high ROE is great, but if it is achieved by taking on massive debt, the company is much riskier than its profitability suggests.
Frequently Asked Questions
What is the most important ratio for the S&P 500?
While there is no single "most important" ratio, the Forward P/E ratio is the most widely used for short-term valuation, while the Shiller P/E (CAPE) is considered the gold standard for long-term (10-year) market forecasting. Most analysts use a combination of these two to understand both current sentiment and long-term value.
How do interest rates affect S&P 500 ratios?
Interest rates have an inverse relationship with most valuation ratios. When interest rates rise, the "discount rate" applied to future earnings increases, which typically lowers P/E and P/S ratios. Additionally, higher rates increase the cost of debt, which can negatively impact the Debt-to-Equity ratio and decrease net income, subsequently lowering the ROE.
Why is the P/B ratio less relevant for the S&P 500 today than in the past?
The S&P 500 has shifted from an industrial-heavy index to a technology- and service-heavy index. Companies like Microsoft, Alphabet, or Meta have immense value in intellectual property and branding, which are not captured as physical assets on a balance sheet. This makes their "Book Value" artificially low, which in turn makes the P/B ratio look artificially high compared to historical norms for manufacturing companies.
Can a company have a high P/E and still be a good investment?
Yes. A high P/E ratio simply means the market expects high growth. If the company exceeds those growth expectations, the stock price can continue to rise even if the P/E remains high. This is where the PEG ratio becomes vital, as it helps determine if that high P/E is justified by the company's growth rate.
What is a "good" Operating Margin for an S&P 500 company?
A "good" margin depends heavily on the sector. In 2026, software and pharmaceutical companies often see operating margins above 30%, while retail or grocery chains may operate on margins as thin as 2% to 5%. Investors should compare a company’s margin to its direct competitors rather than the index average.
Next Steps for Investors
To effectively utilize these 12 ratios, start by identifying your investment objective. If you are a value investor, prioritize the P/B, P/E, and FCF Yield. If you are seeking growth, focus on the PEG Ratio and Operating Margins.
For a comprehensive view of the S&P 500's current health, regularly consult the "Earnings Insight" reports provided by financial data firms like FactSet or the official index data from S&P Dow Jones Indices. By monitoring these metrics as they evolve through 2026, you can make informed decisions about when to increase equity exposure and when to adopt a more defensive posture.