Cisco AppDynamics is an enterprise-grade Application Performance Monitoring (APM) and observability platform engineered to monitor complex, distributed application environments. It excels at automated business transaction mapping, deep code-level diagnostics, and hybrid deployment model support. However, user reviews consistently highlight a steep learning curve, complex agent management overhead, and premium pricing models aimed primarily at large enterprises.
Core Scope and Platform Architecture
Cisco AppDynamics operates as a full-stack observability solution designed to bridge the gap between application performance and business metrics. Originally founded as AppDynamics before its acquisition by Cisco Systems, the platform has evolved from pure-play APM into an enterprise observability stack that integrates deeply with infrastructure, database, network, and cloud ecosystems.
- AppDynamics Platform
- AppDynamics Controller
- SaaS Host
- On-Prem Host
- Data Pipeline
- Analytics Engine
- AppDynamics Agents
- Language
- Infrastructure
- Database
- End-User
- AppDynamics Controller
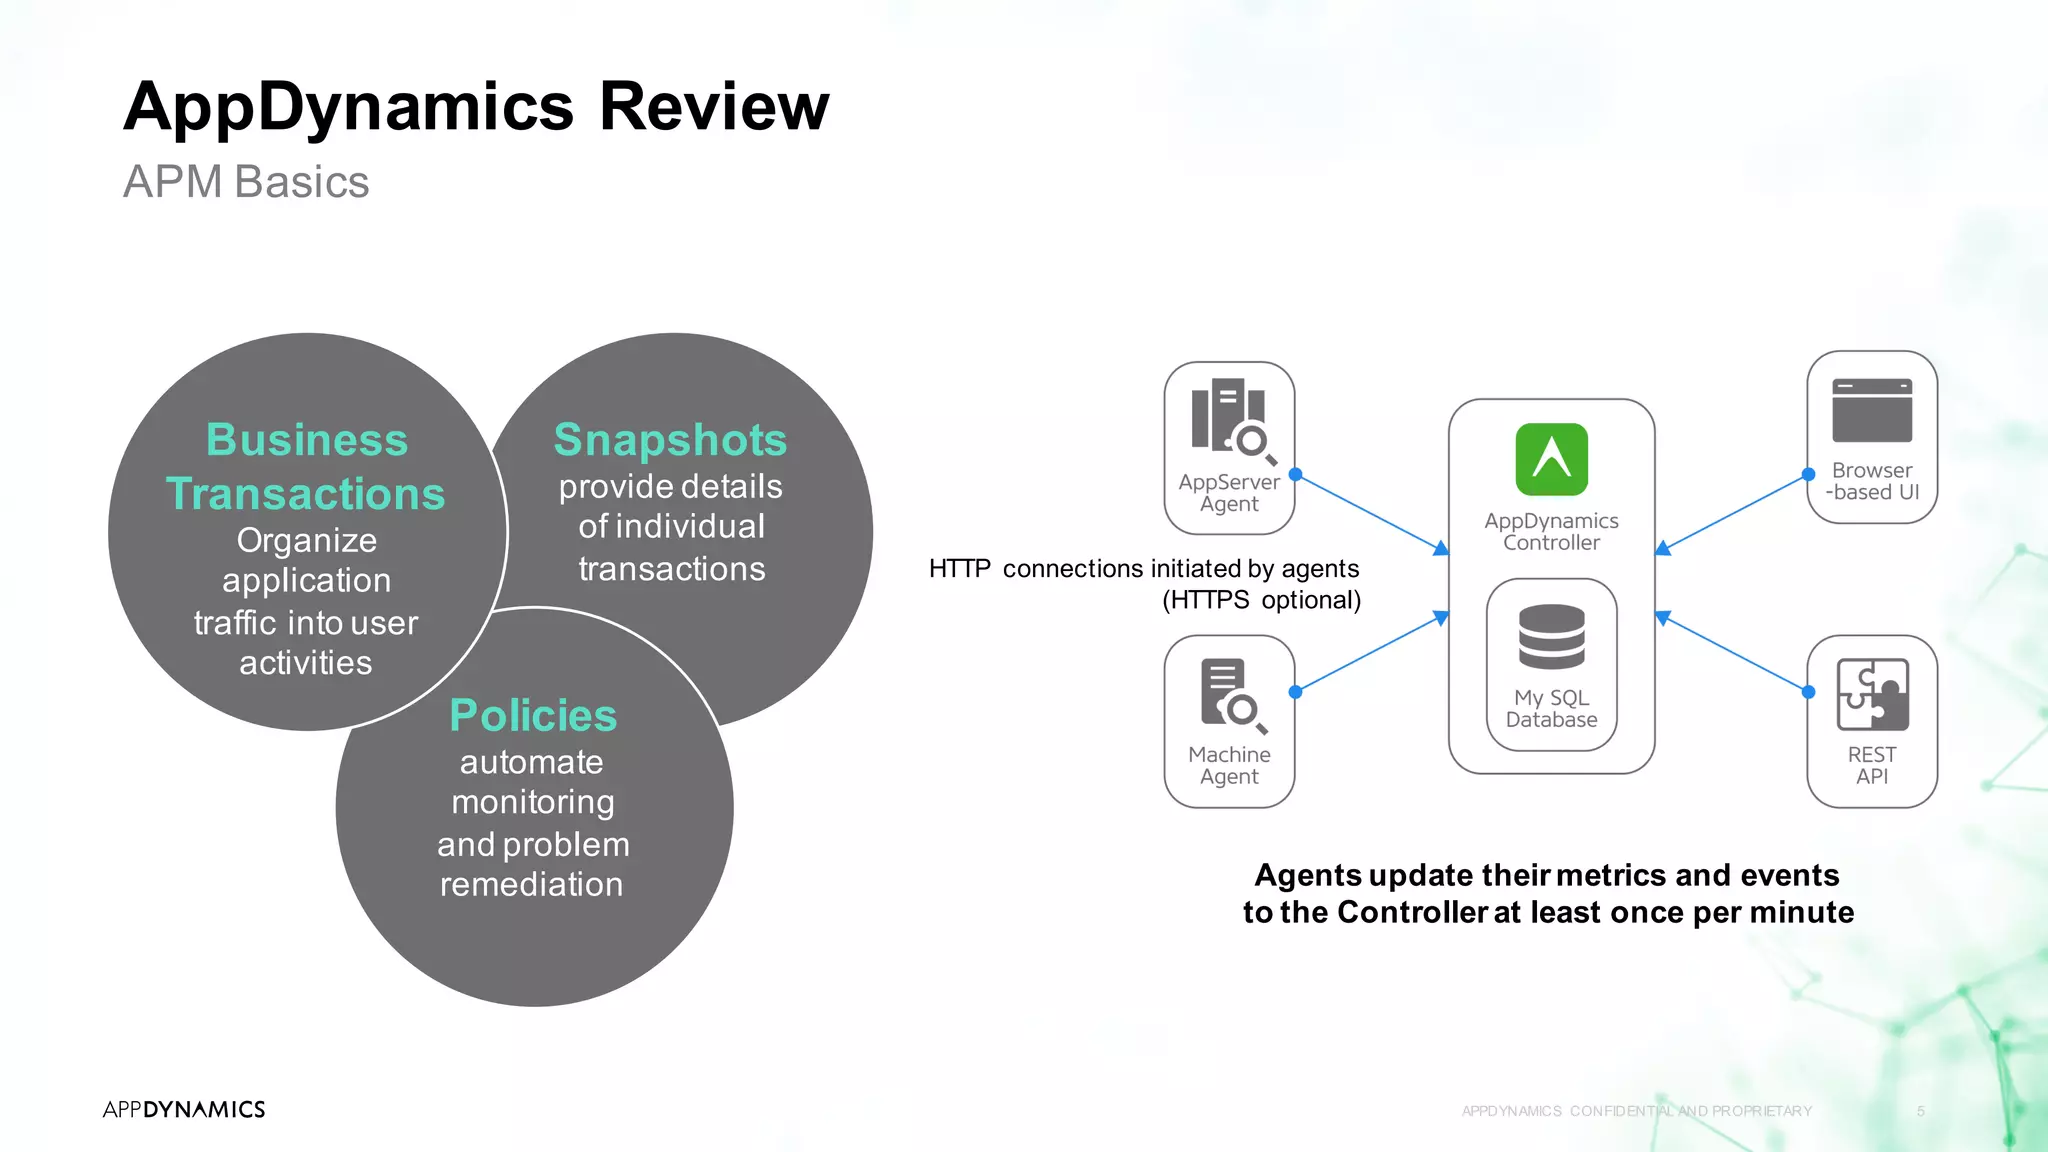
The system architecture revolves around three fundamental components:
- AppDynamics Agents: Lightweight software modules installed directly on host servers, inside container runtimes, or compiled with application code. Agents instrument runtime engines—such as Java Virtual Machines (JVMs), the .NET Common Language Runtime (CLR), Node.js, Python, and Go environments—to collect metric data, execution traces, and call stacks with minimal performance overhead.
- AppDynamics Controller: The central intelligence engine that ingests, correlates, and indexes telemetry data sent by agents. The Controller processes performance baselines, triggers alerts, and renders visualization dashboards. It is available via two primary deployment models:
- Software-as-a-Service (SaaS): Hosted and managed directly by Cisco.
- On-Premises: Installed within a private data center or private cloud for organizations subject to strict regulatory, data sovereignty, or air-gapped compliance requirements.
- Analytics Engine (Events Service): An elastic cluster that stores and queries unstructured log data, business transaction details, and custom analytics parameters to feed AppDynamics Business iQ modules.
By structuring observability around Business Transactions (BTs) rather than raw, isolated servers or unindexed trace logs, AppDynamics traces execution paths across multi-tier microservices, legacy monoliths, messaging queues, and third-party APIs. This structural focus allows IT operations and engineering teams to evaluate technical performance within the context of operational business outcomes.
Key Features Evaluated in AppDynamics Reviews
Enterprise reviews of Cisco AppDynamics consistently evaluate the platform across five core operational capabilities. Understanding how these features operate in production environments provides critical context for procurement and architectural planning.
1. Business Transaction Mapping and Flow Maps
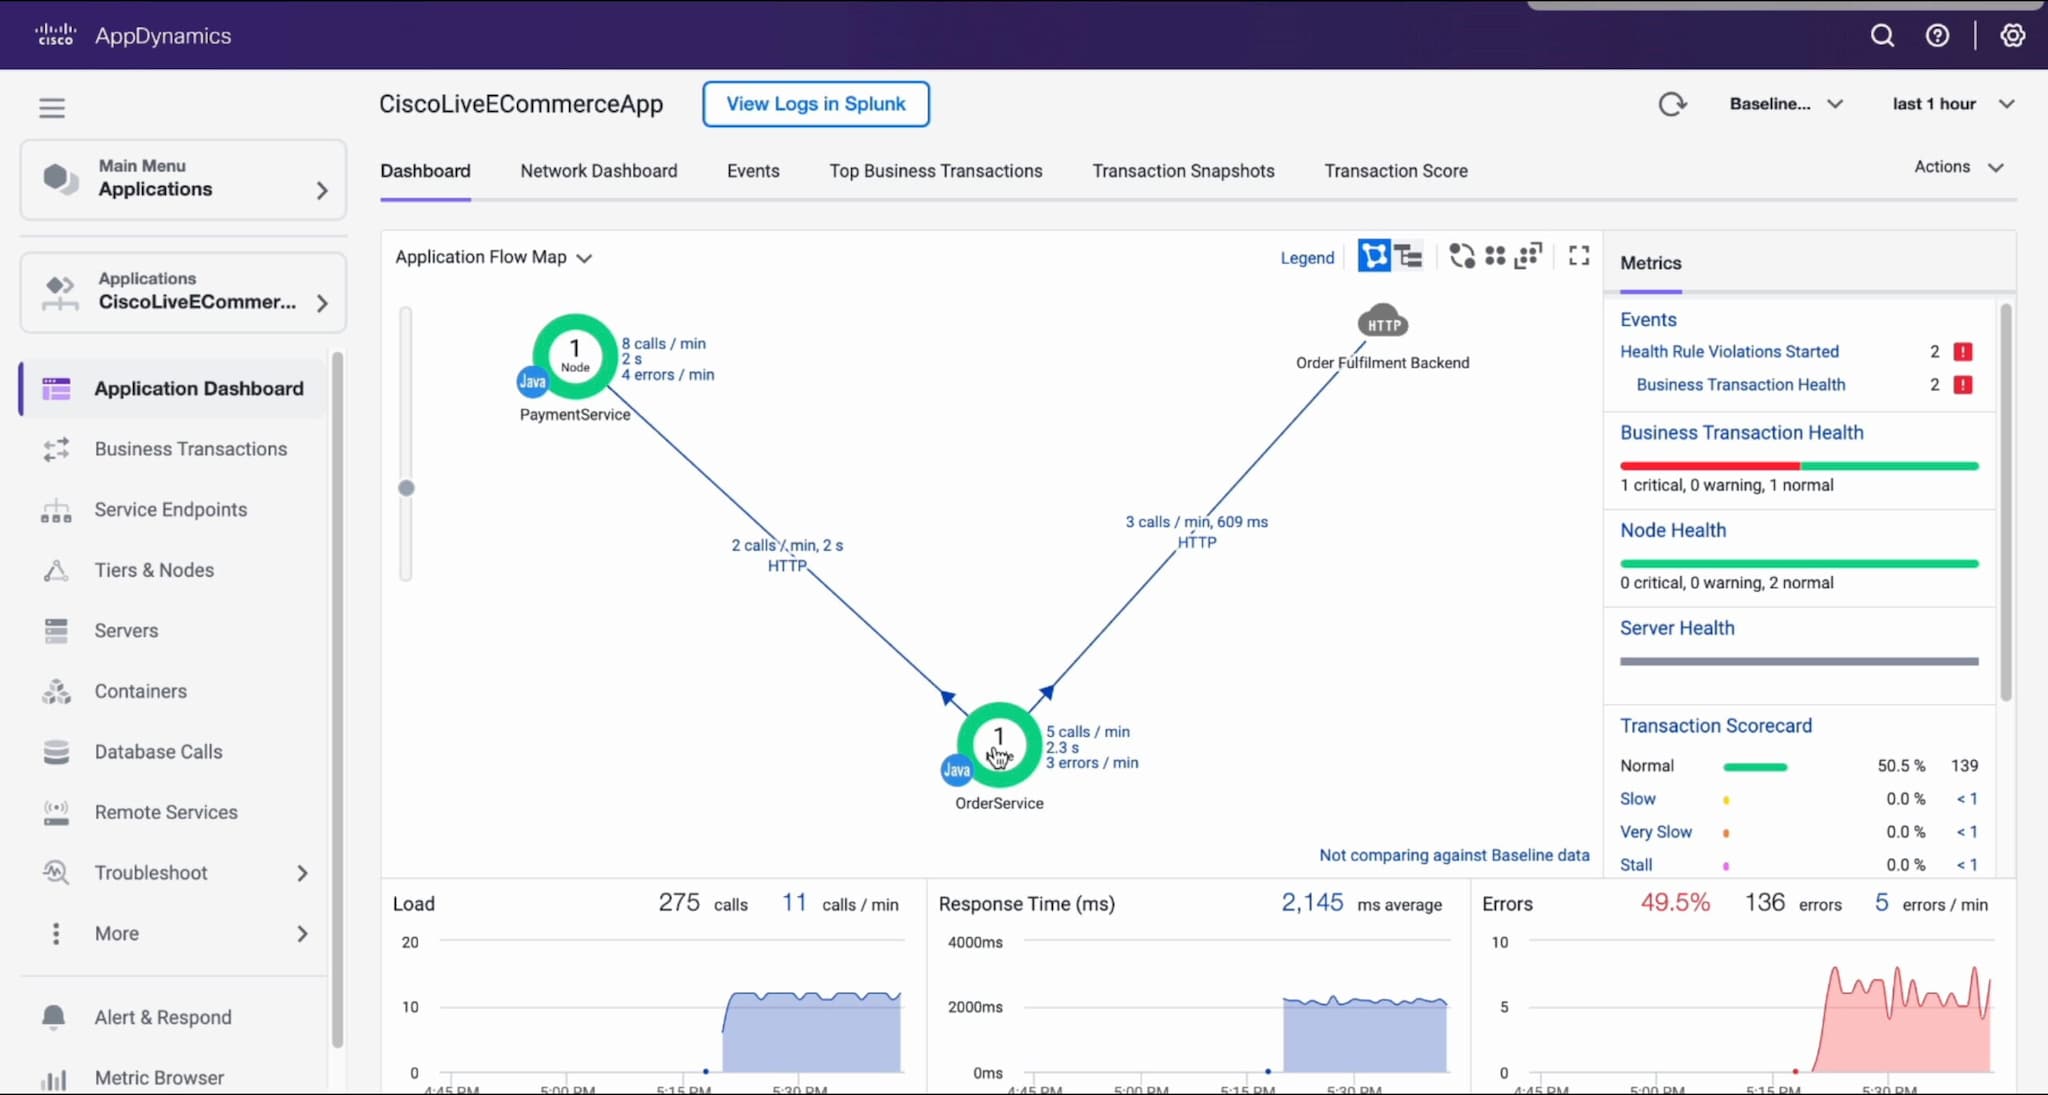
The defining feature of AppDynamics is its automatic discovery and mapping of Business Transactions. Rather than requiring engineers to manually define service dependencies, AppDynamics instruments application entry points—such as HTTP requests, SOAP services, message queue listeners, or database calls—and tracks every request end-to-end.
- Dynamic Flow Maps: AppDynamics automatically generates topological topology maps visualising upstream and downstream dependencies, service nodes, call volumes, error rates, and average response times.
- Dynamic Baselining: The system computes rolling statistical baselines (calculating standard deviations for hourly, daily, and weekly cycles) for every transaction. Alerts are triggered based on deviations from normal baseline behavior rather than static, arbitrary threshold values. This reduces false-positive alert fatigue significantly in dynamic production environments.
2. Deep Code-Level Diagnostics and Auto-Diagnostic Sessions
When performance breaches dynamic baselines, AppDynamics automatically captures full call-graph snapshots. These detailed diagnostic snapshots allow developers to inspect exact code execution paths without reproducing issues in staging environments.
- Method-Level Visibility: Snapshots expose specific class names, executing methods, line numbers, and parameter details where latency occurred.
- Database Query Analysis: Slow transaction traces reveal exact SQL queries or NoSQL database calls, including bind variables, execution times, and lock waits, helping isolate backend database bottlenecks from application code issues.
3. Database and Infrastructure Monitoring
AppDynamics extends application tracing into backend infrastructure and database systems without requiring additional third-party tools.
- Database Visibility: Provides agentless monitoring for relational and non-relational database engines (including Oracle, Microsoft SQL Server, MySQL, PostgreSQL, and MongoDB). It tracks execution plans, index usage, wait states, and system resources consumed by individual queries.
- Server and Network Visibility: Monitors host metrics (CPU utilization, memory allocation, disk I/O, network throughput) and correlates host-level performance degradation directly with application response times.
4. End-User Monitoring (EUM)
To complete end-to-end trace loops, AppDynamics EUM instruments client-side interfaces across web browsers and mobile platforms.
- Real User Monitoring (RUM): Injects lightweight JavaScript snippets into web pages or embeds SDKs within iOS and Android mobile applications to measure Page Load Time, First Paint, DOM Read Time, and network call performance from end-user devices.
- Synthetic Monitoring: Executes scripted synthetic browser sessions from geographically distributed cloud nodes to proactively test application availability, login workflows, and transaction speeds before real users are impacted.
5. Business iQ (Business Performance Monitoring)
Business iQ correlates real-time application metrics directly with business Key Performance Indicators (KPIs). By extracting payload data from in-flight transaction calls—such as shopping cart values, user IDs, region identifiers, or order types—it enables non-technical business leaders to visualize how technical latency impacts real-time business revenue.
Real-World Performance and User Feedback
Feedback across enterprise software evaluation portals presents a clear picture of AppDynamics' operational strengths and platform limitations. Evaluation data reveals distinct trends regarding where the platform succeeds and where engineering teams face implementation friction.
- Enterprise User Feedback
- Highly Rated Strengths
- Deep Java/.NET Trace Depth
- Dynamic Baseline Alert
- On-Prem & Hybrid Support
- Business-to-IT Correlation
- Enterprise Complaints
- Complex Agent Maintenance
- Legacy UI
- High Cost & Strict Model
- Steep Learning Curve
- Highly Rated Strengths
Highly Rated Strengths
- Deep Granularity in Legacy and Enterprise Frameworks: Users consistently report that AppDynamics provides unexcelled trace depth for complex enterprise Java (J2EE), .NET, C++, and SAP applications. Its capability to unpack monolithic stack traces makes it a preferred diagnostic tool for complex legacy IT environments.
- Reduced False Alerts via Dynamic Baselines: System administrators commend the dynamic baselining engine. Unlike monitoring tools relying on hardcoded alert boundaries, AppDynamics adjusts expected performance limits based on historical usage curves, preventing unnecessary off-hours escalations.
- Hybrid and On-Premises Deployment Options: For financial institutions, healthcare providers, and government agencies unable to stream telemetry data to public cloud platforms, AppDynamics' on-premises Controller deployment remains a decisive advantage over cloud-only observability tools.
- Root-Cause Speed: Technical teams cite a major reduction in Mean Time to Resolution (MTTR). When critical outages occur, the combination of flow maps and automatic snapshot generation allows engineers to locate failing code lines or database locks within minutes.
Common User Complaints and Limitations
- Agent Management Overhead and Complexity: Setting up, configuring, and updating multi-language agents across vast server fleets requires substantial DevOps effort. Unlike modern eBPF-based auto-instrumentation solutions, deploying AppDynamics agents often requires manual deployment script updates, application rebuilds, or container pod reconfigurations.
- Steep Learning Curve and Interface Complexity: The user interface, while functional, is frequently described as dense and complex. Users report that non-specialists require significant training to navigate nested menus, configure custom dashboards, and correctly tune Business Transactions.
- High Operational Resource Consumption: Under heavy traffic spikes, high-depth code diagnostics and telemetry collection can introduce measurable CPU and memory overhead on monitored nodes if agent sampling parameters are not tuned carefully.
- Pricing Complexity and High Total Cost of Ownership (TCO): Reviewers frequently cite high baseline costs and restrictive licensing terms. Small and mid-market organizations often find the cost prohibitive compared to modern usage-based observability platforms.
Cisco AppDynamics Pricing and Licensing Model
Cisco AppDynamics utilizes an enterprise licensing structure primarily anchored to the number of monitored host cores, agent instances, or data volume tiers. Understanding these licensing structures is essential for accurate infrastructure budgeting.
Subscription Packages
AppDynamics structures its capabilities into structured licensing tiers (typically billed on an annual subscription basis per monitoed CPU socket or host instance):
- Infrastructure Monitoring Edition: Focuses on core infrastructure server nodes, network paths, and container environments. Includes basic host metrics and health checks without deep application code diagnostics.
- Premium Edition: Adds full Application Performance Monitoring (APM), basic database visibility, and core End-User Monitoring (EUM) features. This tier serves standard application monitoring requirements.
- Enterprise Edition: Provides the complete APM suite, deep database performance diagnostics, advanced network visibility, and full access to Business iQ payload analytics modules.
- Cisco Full-Stack Observability (FSO) / Enterprise Bundles: Integrates AppDynamics licenses with broader Cisco software ecosystems, incorporating capabilities from ThousandEyes (network intelligence) and Cisco Cloud Observability for cloud-native Kubernetes workloads.
Key Factors Influencing Total Cost
- Core/Host Count: APM agents are licensed per physical CPU, virtual machine (VM), or container instance host. Scaling cloud deployment instances horizontally can rapidly inflate subscription costs if auto-scaling settings are not strictly managed.
- Data Retention and Volume Tiers: Extending telemetry, event, and snapshot data retention periods beyond standard cloud limits incur additional storage costs.
- Professional Services and Support: Due to the complexity of enterprise deployments, initial configuration, agent tuning, and Business Transaction mapping often require paid professional services or dedicated in-house staff.
Detailed Comparison: AppDynamics vs. Top Enterprise APM Competitors
Selecting an enterprise observability platform requires evaluating technical trade-offs across deployment, usability, pricing, and ecosystem alignment. The table below outlines how Cisco AppDynamics compares with top enterprise APM competitors.
| Capability / Metric | Cisco AppDynamics | Dynatrace | Datadog | New Relic |
|---|---|---|---|---|
| Primary Target Market | Large Enterprise & Hybrid IT | Large Enterprise & Cloud-Native | Cloud-Native, DevOps, SMB to Enterprise | Mid-Market to Enterprise |
| Deployment Model | SaaS & On-Premises (Controller) | SaaS & Managed (Hybrid On-Prem) | Cloud SaaS Only | Cloud SaaS Only |
| Instrumentation Style | Bytecode injection & Language Agents | OneAgent (Automated injection) | Unified Agent + eBPF + OpenTelemetry | OpenTelemetry & Language Agents |
| Transaction Tracing | Exceptional (Business Transactions) | Excellent (PurePath Technology) | Good (APM & Distributed Tracing) | Strong (Distributed Tracing) |
| Business Metrics Correlation | Native (Business iQ payload extraction) | Native (BizDevOps analytics) | Moderate (Requires custom metrics setup) | Moderate (NRQL custom queries) |
| Learning Curve | High (Requires dedicated admin) | Moderate to High | Low to Moderate | Low to Moderate |
| Pricing Structure | Host/Core tier-based licensing | Host/Memory & Consumption-based | Usage-based per host, log, and ingest volume | User-seat + Data ingest volume |
| Best Suited For | Monoliths, Hybrid Cloud, SAP & Heavy Java/.NET | Large-scale AI-driven cloud automation | Modern SaaS stack, Kubernetes & Serverless | High data volume ingestion & developers |
Comparative Analysis Highlights
- AppDynamics vs. Dynatrace: Both platforms represent the gold standard for enterprise-grade deep tracing and auto-discovery. While Dynatrace emphasizes AI-driven root cause identification (Davis AI) and unified automated agent deployment (OneAgent), AppDynamics offers superior flexibility for fully on-premises deployment in highly isolated data centers.
- AppDynamics vs. Datadog: Datadog offers a modern, highly flexible user interface with rapid deployment times and simple consumption-based pricing suited for cloud-native environments. However, for deep code execution analysis inside complex, legacy enterprise software frameworks, AppDynamics provides more granular bytecode-level diagnostic depth.
- AppDynamics vs. New Relic: New Relic offers a streamlined, consumption-based pricing model that allows teams to scale data ingestion easily. AppDynamics remains favoured by enterprise architecture boards requiring strict business-impact correlation (Business iQ) tied to operational transaction flows.
Implementation Requirements and Prerequisites
Deploying AppDynamics across enterprise networks requires thorough preparation across infrastructure, security, and developer teams.
- Phase 1: Environment Readiness
- Select SaaS vs. On-Premises Controller
- Verify OS, runtime environment, and application framework specs
- Configure firewall rule sets (e.g., TCP Port 443 outbound)
- Phase 2: Agent Deployment
- Deploy language agents (Java, .NET, Node.js, Python, Go)
- Install Infrastructure and Machine agents on host OS
- Configure container sidecars or Kubernetes operators
- Phase 3: Configuration & Tuning
- Map auto-discovered Business Transactions (BTs)
- Exclude health-check endpoints and non-critical traffic
- Tune alert thresholds and historical dynamic baselines
- Phase 4: Business iQ & Analytics
- Instrument custom payload data collectors
- Validate data security, masking, and PII compliance
- Construct targeted operational and executive dashboards
1. Architecture Prerequisites
- Controller Selection: Organizations must choose between Cisco's hosted SaaS platform or provisioning local infrastructure to run an On-Premises Controller. An on-premises installation requires high-performance hardware nodes with fast SSD storage pools, dedicated database memory allocations, and continuous maintenance updates.
- Network Connectivity: Monitored hosts must maintain secure network paths to the Controller. SaaS deployments require outbound HTTPS connectivity (standard TCP port 443) to AppDynamics cloud endpoints, while on-premises setups require open internal routes through enterprise firewalls.
2. Runtime Environment Compatibility
Language agents instrument applications by hooking directly into core execution runtimes. Key compatibility requirements include:
- Java: Compatible with standard JDK/JRE implementations (Oracle, OpenJDK, Eclipse Temurin) using standard JVM byte-code instrumentation arguments (
-javaagent). - .NET: Requires installation of the AppDynamics .NET Agent on Windows Server hosts or Linux container runtimes supporting .NET Core / .NET 6+.
- Node.js / Python / Go / PHP: Requires adding language-specific modules directly into application code bases or loading agents dynamically during runtime startup scripts.
- Container Environments: Supports deployment within Kubernetes clusters via the AppDynamics Cluster Agent operator, monitoring pod lifecycles, node performance, and ingress controllers.
3. Agent Overhead and Performance Tuning
Deploying language agents introduces operational resource utilization overhead. On average, a properly tuned AppDynamics agent adds between 1% and 3% CPU overhead and a slight memory allocation footprint to the host process.
To prevent performance degradation during peak load, system administrators must:
- Disable telemetry collection on low-value internal health-check endpoints.
- Limit snapshot retention rates for non-critical services.
- Mask sensitive payload data (such as Personally Identifiable Information, credit card tokens, or passwords) directly at the agent level before telemetry data leaves the host memory pool.
Organizational Suitability Matrix: Is AppDynamics Right for You?
Not all engineering organizations require the full capabilities or accept the operational overhead of Cisco AppDynamics. The following breakdown evaluates platform suitability based on organizational profile:
Recommended For:
- Large Enterprises with Hybrid Cloud Infrastructure: Companies operating legacy on-premises applications alongside public cloud deployments (AWS, Azure, GCP) that require a unified monitoring dashboard.
- Financial Services, Healthcare, and Government: Institutions requiring on-premises telemetry data hosting to comply with strict regulatory frameworks, data sovereignty rules, or security restrictions.
- Organizations with Complex Business Logic: Businesses running complex transaction workflows (such as banking operations, order management systems, or SAP deployments) where application delays directly threaten business revenue.
- Mission-Critical Java and .NET Environments: Systems built on deep object-oriented class hierarchies where deep stack traces and method-level latency diagnostic capabilities are mandatory.
Not Recommended For:
- Early-Stage Startups and SMBs: Small teams with limited IT budgets will likely find AppDynamics' licensing costs and configuration overhead disproportionate to their needs.
- Purely Serverless or Ephemeral Architectures: Cloud-native applications relying predominantly on short-lived serverless functions (e.g., AWS Lambda, Azure Functions) may achieve faster time-to-value using lightweight, consumption-based cloud observability platforms.
- Teams Seeking Out-of-the-Box, Zero-Configuration Setup: Organizations desiring an instant setup without manual agent installation, custom transaction mapping, or dedicated administrative management.
Frequently Asked Questions
What is the primary difference between Cisco AppDynamics and cloud-native observability tools?
Cisco AppDynamics was designed specifically around business transaction mapping and deep, runtime bytecode instrumentation for multi-tier enterprise applications. While modern cloud-native observability tools prioritize high-volume log aggregation, metric scraping, and eBPF tracing across microservices, AppDynamics provides deeper code-level execution traces inside legacy runtimes (such as Java and .NET) alongside native business performance correlation through its Business iQ platform.
Can AppDynamics be deployed entirely on-premises?
Yes. Unlike many modern observability vendors that operate exclusively as SaaS platforms, AppDynamics provides an On-Premises Controller deployment model. This allows organizations with strict security requirements—such as financial institutions, defence contractors, and healthcare organizations—to retain all operational metrics, transaction traces, and log data entirely within private data centers.
How does AppDynamics impact host system performance?
When properly configured, AppDynamics agents typically introduce between 1% and 3% CPU utilization overhead and minimal memory usage on monitored hosts. However, if agents are configured to capture high volumes of code snapshots or run unoptimized payload extraction rules during extreme traffic spikes, performance overhead can increase. Tuning agent sampling rules, excluding health checks, and managing snapshot frequency prevents adverse host impacts.
How does AppDynamics capture business metrics alongside technical performance?
AppDynamics uses its Business iQ module to extract custom payload data directly from application execution threads as transactions occur. For example, when an e-commerce checkout method executes, the agent can record metadata such as order values, customer tier categories, or product SKUs. This data is correlated directly with system latency metrics, allowing organizations to visualize how technical performance impacts operational revenue in real time.
What skill sets are required to maintain an AppDynamics deployment?
Managing an enterprise AppDynamics environment requires a solid understanding of system administration, software execution runtimes (such as JVM or .NET CLR mechanics), network protocols, and application architecture. Large enterprise deployments typically designate dedicated APM administrators or Reliability Engineers to oversee agent deployment pipelines, manage Controller updates, tune transaction discovery rules, and build operational dashboards for business stakeholders.
Practical Recommendation and Next Actions
Selecting Cisco AppDynamics requires evaluating your organization's specific technical architecture, regulatory constraints, and budget resources.
If your organization manages large-scale hybrid environments, heavy enterprise Java or .NET applications, or strict on-premises regulatory requirements, Cisco AppDynamics remains a top-tier APM solution capable of delivering rapid root-cause analysis and business transaction visibility.
Suggested Next Steps:
- Conduct an Application Architecture Audit: Map your core infrastructure stacks. If your portfolio consists primarily of short-lived serverless microservices, evaluate lightweight consumption-based SaaS alternatives alongside AppDynamics. If you manage complex legacy monoliths, multi-tier services, or SAP systems, request an AppDynamics Enterprise demonstration.
- Execute a Targeted Proof of Concept (PoC): Deploy AppDynamics agents within a representative staging environment containing high transaction complexity. Measure agent installation effort, system CPU overhead, snapshot accuracy, and auto-discovery capabilities under simulated load.
- Calculate Total Cost of Ownership (TCO): Compare baseline agent core licensing fees against long-term operational costs, including storage retention, professional services onboarding, and ongoing platform administration resources.