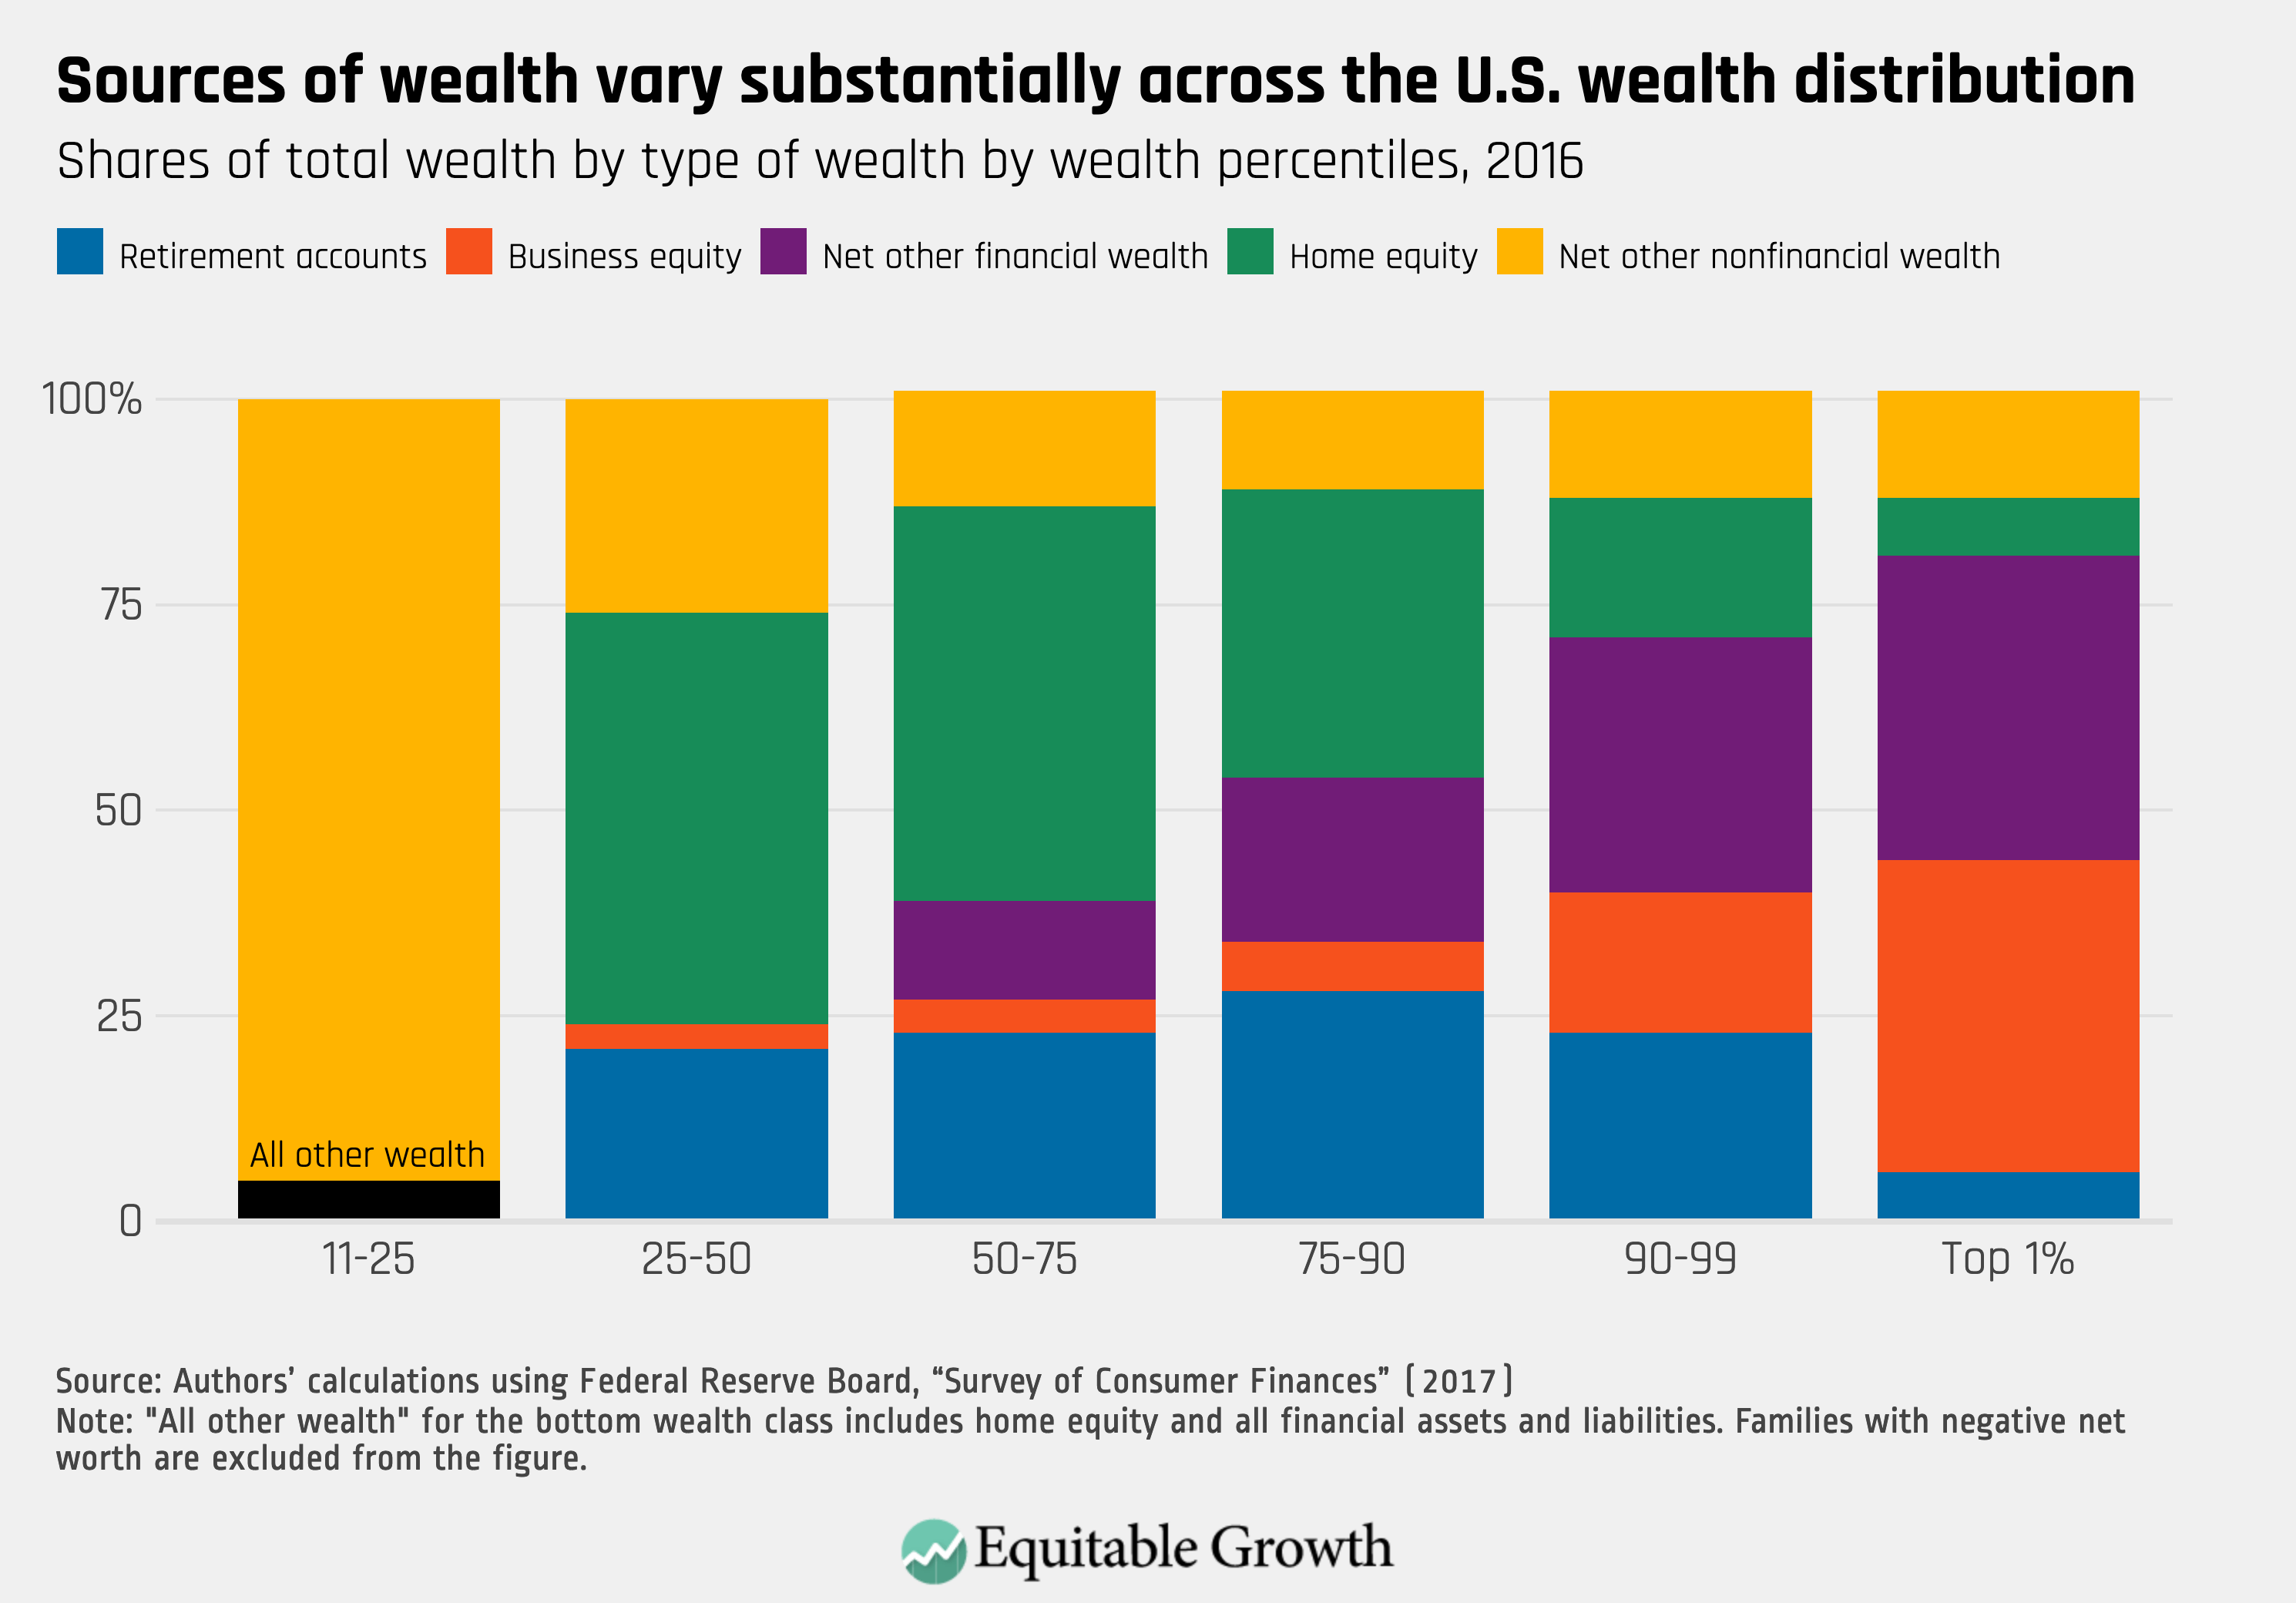
As of 2026, the top 1% of US households hold approximately 30% to 32% of total national wealth, a figure significantly higher than the 7% threshold often cited in historical or niche asset contexts. While the top 0.1% held roughly 7% of total wealth in the late 1970s, modern concentration has tripled that share for the elite tier due to equity market growth and shifts in capital taxation.
The Reality of Wealth Concentration in the United States
To understand the current financial landscape in 2026, one must distinguish between various tiers of the "wealthy." The distribution of wealth in the United States is not a smooth gradient; it is a steep curve that accelerates sharply at the very top. While the "top 1%" is a common political and social shorthand, the economic reality involves a complex layering of asset ownership, debt obligations, and liquidity.
As of the current 2026 fiscal year, the total net worth of US households exceeds $160 trillion. Of this, the top 1%—representing households with a net worth typically exceeding $13 million—controls nearly one-third of the entire pie. This concentration is driven primarily by the ownership of corporate equities and mutual fund shares, which have seen sustained growth following the AI-driven market expansions of the early 2020s.
In contrast, the bottom 50% of the population holds roughly 2.5% to 3% of the nation's wealth. This stark disparity highlights the difference between "wage-based" income and "asset-based" wealth. While the bottom half of the country relies on wages and holds most of its "wealth" in the form of real estate (often heavily leveraged with mortgages), the top 1% derives its status from capital-heavy investments that compound over time.
Deconstructing the "7 Percent" Figure: Fact vs. Context
The mention of "7 percent" in relation to the top 1% of US wealth often stems from one of three distinct contexts: historical data, specific asset classes, or confusion with the top 0.1%. Understanding where this number originates is crucial for accurate financial analysis.
The Historical Low Point
In the late 1970s—specifically around 1977 and 1978—wealth concentration in the United States reached its modern nadir. During this period, the top 0.1% (not the top 1%) held approximately 7% of total household wealth. This was an era characterized by high top-marginal tax rates, strong labor unions, and a less financialized economy. Since then, the share held by the top 0.1% has more than doubled, reaching nearly 14% by 2026.
The Real Estate Anomaly
If we isolate specific asset classes, the "7 percent" figure appears in different ways. For example, while the top 1% owns the vast majority of stocks and private businesses, their share of total residential real estate is disproportionately lower—roughly 10% to 12%. Because real estate is the primary asset for the middle class, wealth is "less concentrated" in housing than it is in the stock market.
Global vs. Domestic Comparisons
In some global wealth reports, researchers look at the share of wealth held by the top 1% of the global population within a specific country. However, for the US domestic market, the top 1% has not held as little as 7% of total wealth at any point in the last century. The most accurate interpretation of a "7 percent" figure in contemporary discourse usually refers to the share of wealth held by the next 40% (the segment between the 50th and 90th percentiles) in specific liquid categories, or a historical reference to the ultra-elite (0.1%) before the bull markets of the 1980s.
Asset Composition: What the Top 1% Owns vs. Everyone Else
The primary driver of wealth inequality in 2026 is the type of assets held by different economic groups. The Federal Reserve’s Distributional Financial Accounts (DFA) categorize wealth into several buckets: real estate, consumer durables, corporate equities, mutual funds, pension entitlements, and private businesses.
Corporate Equities and Mutual Funds
For the top 1%, stocks are the crown jewels. This group owns more than 50% of all individually held corporate equities and mutual fund shares in the United States. In an environment where the S&P 500 and Nasdaq continue to benefit from productivity gains in automation and energy transition technology, this ownership translates into rapid wealth appreciation that outpaces wage growth.
Private Business Ownership
The top 1% also controls a massive share of "closely held" or private businesses. These are companies not traded on public exchanges. As of 2026, the valuation of these private entities has surged, particularly in the professional services and specialized manufacturing sectors. Private business ownership is one of the most significant "hidden" components of wealth, as these assets are not priced daily like public stocks.
Real Estate and Debt
For the bottom 90%, the primary residence is the largest asset. However, this is also where the majority of household debt resides. While the top 1% holds significant real estate portfolios, these properties are often a smaller percentage of their total net worth compared to their financial investments. For the bottom 50%, a downturn in the housing market can erase their entire net worth, whereas the top 1% is shielded by a diversified portfolio of global equities.
The Role of the Federal Reserve’s Distributional Financial Accounts
To verify these figures, economists rely on the Federal Reserve’s Distributional Financial Accounts (DFA), which provide quarterly updates on how wealth is split. These reports are the gold standard for tracking the "7 percent" or "30 percent" claims.
By 2026, the DFA data reflects the impact of the "Great Wealth Transfer." This refers to the trillions of dollars passing from the Silent Generation and older Baby Boomers to their heirs. Because this transfer is largely staying within the top deciles of the population, it has reinforced the 30%+ share held by the top 1% rather than diluting it.
The Fed data also tracks "Consumer Durables"—items like cars, appliances, and electronics. Interestingly, this is one of the only categories where the bottom 50% holds a share that is somewhat proportional to their population size. However, because these assets depreciate, they do not contribute to long-term wealth building in the same way that equities or real property do.
Economic Shifters Leading into 2026
Several key factors have influenced the concentration of wealth as we move through 2026. These variables explain why the top 1% continues to hold a dominant share of the national balance sheet.
- Monetary Policy and Interest Rates: Following the volatility of the early 2020s, the Federal Reserve’s management of interest rates has created a "K-shaped" recovery. High-interest rates often hurt those with high debt-to-income ratios (the bottom 50%), while providing high yields for those with significant cash reserves and fixed-income investments (the top 1%).
- Tax Policy Evolutions: The expiration or modification of various provisions from the Tax Cuts and Jobs Act (TCJA) has been a major focal point. For much of the 2020s, favorable capital gains rates and estate tax exemptions have allowed the top 1% to retain and compound their wealth more effectively than previous generations.
- Technological Displacement: The "AI Revolution" that reached maturity in 2025-2026 has disproportionately rewarded capital owners. While productivity has increased, the gains have largely flowed to the owners of the technology and the shareholders of the companies implementing it, rather than through broad-based wage increases.
Comparative Wealth Distribution (Table)
The following table outlines the estimated distribution of US household wealth by percentile group as of the 2026 fiscal year.
| Wealth Tier | Share of Total National Wealth | Primary Asset Type | Average Net Worth (Estimated) |
|---|---|---|---|
| Top 0.1% | 13.5% | Corporate Equities, Private Equity | $35M - $100M+ |
| Top 1% (Total) | 31.2% | Mutual Funds, Private Business | $13.5M+ |
| Next 9% (90-99th) | 36.8% | Retirement Accounts (401k), Real Estate | $2M - $13.4M |
| Next 40% (50-90th) | 28.5% | Principal Residence, Pensions | $200k - $1.9M |
| Bottom 50% | 3.5% | Consumer Durables, Real Estate (Levaraged) | < $100k |
Note: Data based on projections and trends from the Federal Reserve's Distributional Financial Accounts and Census Bureau reports adjusted for 2026 valuations.
Historical Trends: From the 1970s to the Mid-2020s
The trajectory of US wealth concentration has been on a nearly uninterrupted upward path since 1979. To understand why a "7 percent" figure might be stuck in the public consciousness, one must look at the "Post-War Consensus" era.
Between 1950 and 1975, the United States experienced what economists call "The Great Compression." Income and wealth gaps narrowed. During this time, the top 1% held roughly 20-22% of national wealth. As mentioned, the even more exclusive top 0.1% saw their share dip toward 7%.
The "Great Divergence" began in the 1980s. Factors included:
- Financialization: The shift of the economy toward financial services.
- Globalization: The outsourcing of manufacturing, which suppressed middle-class wage growth.
- Equity Compensation: The shift from salary-based executive pay to stock-option-based pay.
By the time we reached the mid-2020s, the top 1% share had eclipsed the levels seen in the "Roaring Twenties," making the 7% figure a distant historical relic or a misunderstanding of specific sub-tier data.
Impacts of Wealth Inequality on the Broader Economy
The fact that the top 1% holds over 30% of wealth (while a 7% figure remains a myth for this group) has significant implications for economic stability in 2026.
- Market Volatility: Because such a large portion of national wealth is tied to the stock market, the US economy is increasingly sensitive to market "corrections." A 10% drop in the S&P 500 now removes trillions of dollars in paper wealth from the top 1%, which can lead to reduced venture capital and private investment.
- Social Mobility: High wealth concentration often correlates with lower social mobility. When the "cost of entry" for assets like housing and education rises faster than the median wage, it becomes harder for the bottom 50% to move into the 50-90% bracket.
- Political Discourse: The "Wealth Tax" debate remains a central pillar of 2026 politics. Proponents argue that the current concentration is unsustainable, while opponents suggest that taxing unrealized gains would stifle the innovation that has kept the US economy ahead of global competitors.
Frequently Asked Questions
Is the top 1% share of wealth increasing or decreasing in 2026?
As of 2026, the share of wealth held by the top 1% is slightly increasing or stable. While there was a brief period of "wealth leveling" during the high-inflation years of 2022-2023 when the bottom 50% saw wage gains, the subsequent surge in equity markets and AI-related stocks in 2024 and 2025 has largely benefited those who already owned significant capital.
Does the 7% figure refer to the bottom 50%?
Actually, the bottom 50% holds even less—historically between 1% and 3.5%. The "7 percent" figure is most commonly associated with the share held by the top 0.1% in 1978 or perhaps the share of total liquid cash (checking and savings accounts) held by a specific middle-income bracket. It is not an accurate representation of the top 1%'s total net worth in the 21st century.
What is the minimum net worth to be in the top 1% in 2026?
To enter the top 1% of US households in 2026, a net worth of approximately $13.5 million to $14 million is generally required. This figure includes all assets (real estate, stocks, businesses) minus all liabilities (mortgages, loans).
Why is the Federal Reserve's data considered the most accurate?
The Federal Reserve combines data from the Survey of Consumer Finances (SCF) with the Financial Accounts of the United States. This allows them to capture both the "macro" view of the whole economy and the "micro" view of individual household behaviors, providing a more comprehensive picture than IRS tax records alone, which may miss non-taxable wealth.
How does the US compare to other countries in wealth concentration?
The US has one of the highest levels of wealth concentration among developed nations. While the top 1% in the US holds over 30%, the top 1% in many European nations (like France or the UK) typically holds between 20% and 25%. This is often attributed to different social safety net structures and inheritance tax laws.
Final Recommendation
For those researching US wealth statistics in 2026, it is vital to use the Federal Reserve’s Distributional Financial Accounts as the primary source of truth. If you encounter the "7 percent" figure, verify the context: it likely refers to a historical data point for the top 0.1% or a specific, non-representative asset class.
For investors and policy analysts, the takeaway is clear: the US economy is increasingly driven by asset appreciation rather than labor income. To build significant wealth in this environment, moving from "wage-earning" to "asset-owning" remains the most effective—albeit difficult—path. Those tracking these trends should monitor capital gains tax legislation and interest rate pivots, as these are the two primary levers that will determine if the top 1% share remains at 30% or moves toward even higher levels of concentration in the late 2020s.