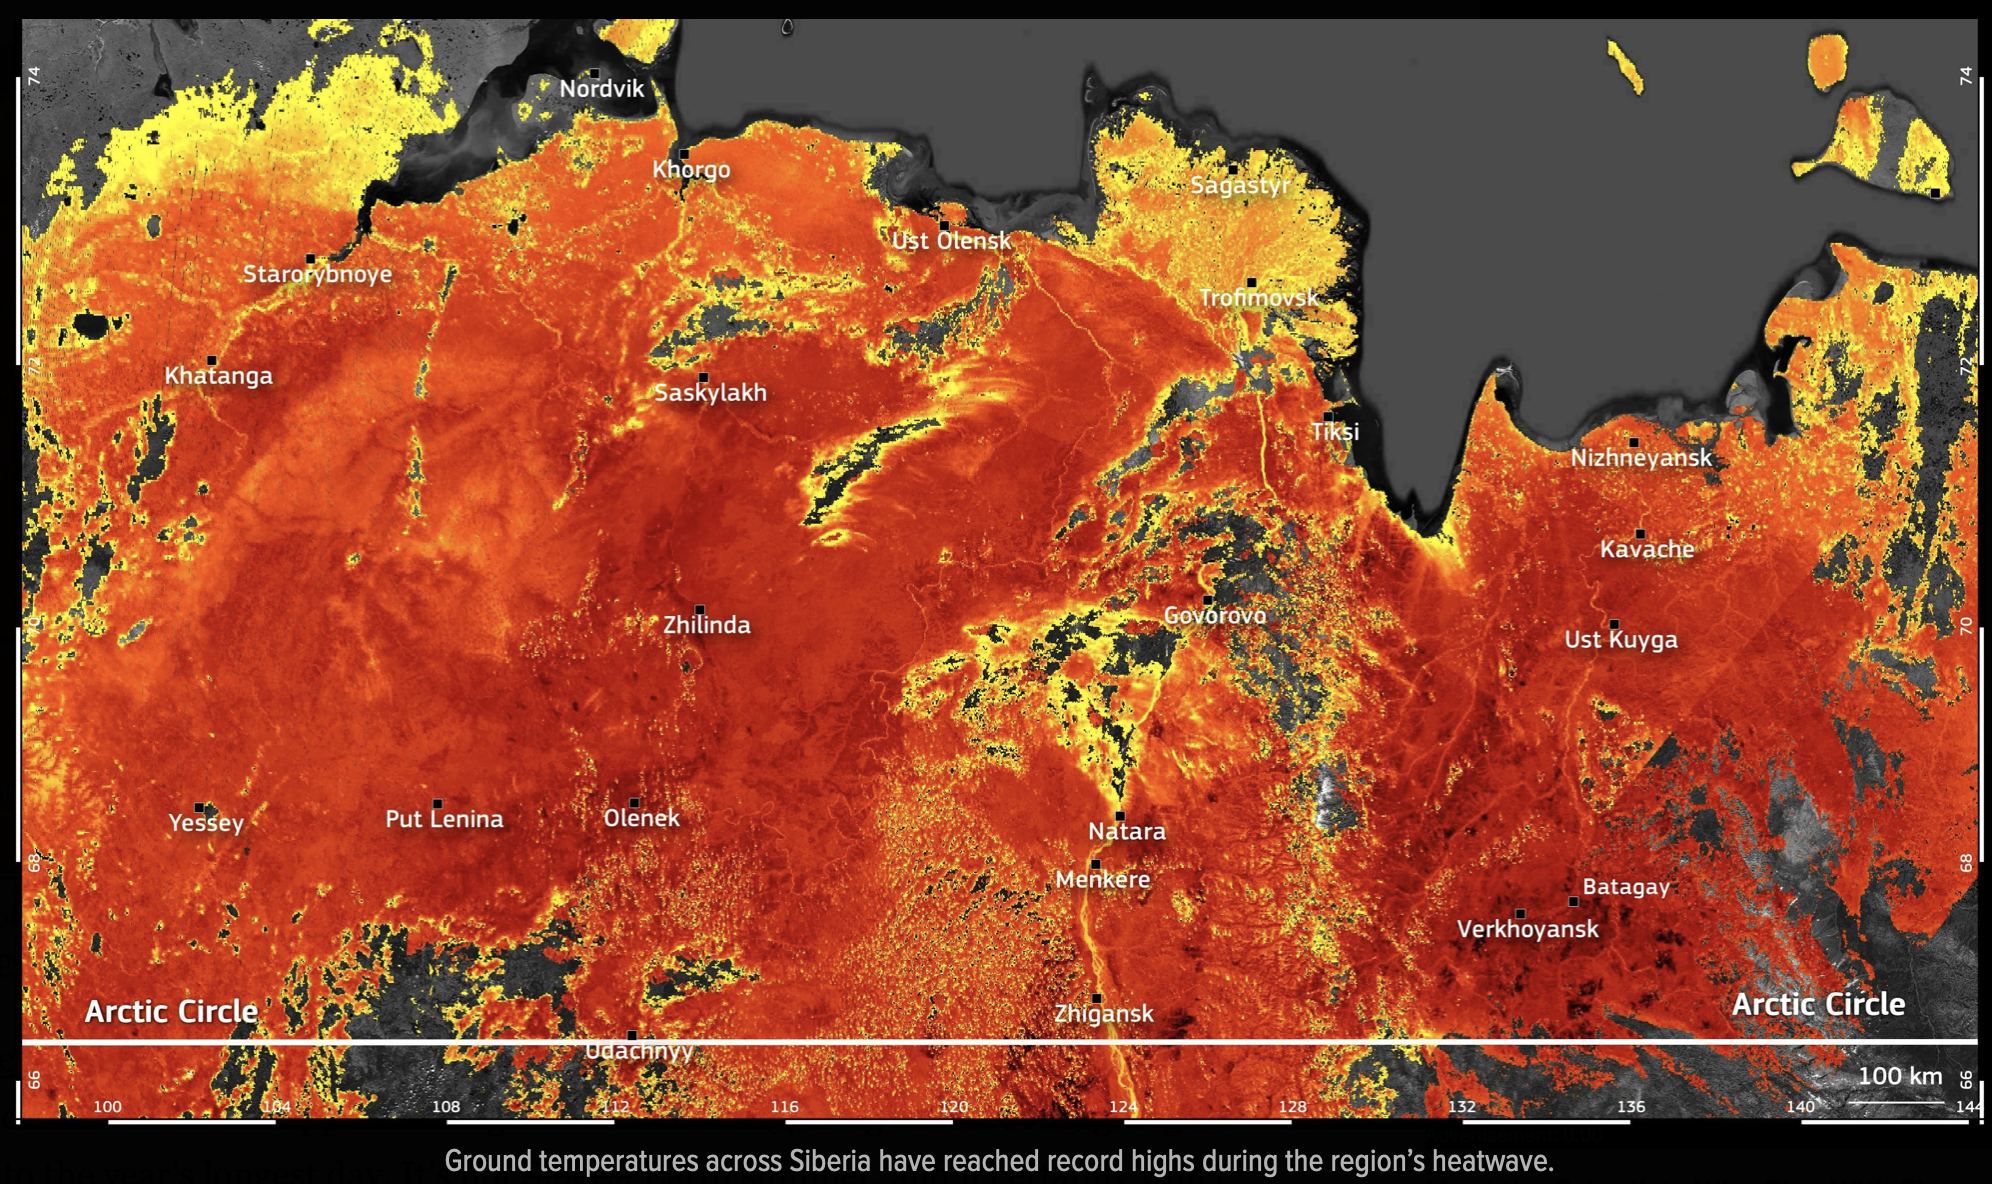
Temperatures within the Arctic Circle range from winter lows of -40°C (-40°F) in continental interiors to summer highs occasionally exceeding 30°C (86°F) in sub-Arctic regions. These fluctuations are driven by the Earth's axial tilt, the albedo effect, and heat transport from ocean currents, resulting in a rapidly warming climate known as Arctic amplification.
Defining the Arctic Circle and Its Thermal Boundaries
The Arctic Circle is a geographic line of latitude located at approximately 66° 33′ North. It marks the southernmost point at which the sun remains above the horizon for 24 continuous hours during the summer solstice and below the horizon for 24 hours during the winter solstice. However, temperature is not dictated solely by this line. In the world of climatology, the "Arctic" is often defined by the 10°C (50°F) July isotherm—the boundary where the average temperature of the warmest month does not exceed 10°C.
As of 2026, the thermal boundaries of the Arctic are shifting northward. The geographic Arctic Circle remains fixed, but the "climatic Arctic" is shrinking as global temperatures rise. To understand Arctic temperatures, one must distinguish between the maritime Arctic, the continental Arctic, and the high-altitude ice caps. Each of these zones reacts differently to solar radiation and atmospheric pressure systems.
The fundamental driver of Arctic cold is the angle of solar incidence. Because the Earth is a sphere, the sun’s rays hit the poles at an oblique angle, spreading the same amount of solar energy over a much larger surface area than at the equator. Furthermore, during the long "polar night," the region receives zero solar input, allowing heat to radiate back into space unimpeded by incoming sunlight.
Seasonal Dynamics: The Polar Night and Midnight Sun
The Arctic experiences the most extreme seasonal light variations on the planet. These variations create a thermal lag, where the coldest temperatures often occur in February or March, and the warmest in July or August.
Winter: The Season of Radiative Cooling
During the winter months, the Arctic Circle is tilted away from the sun. In areas like Utqiaġvik, Alaska, or Svalbard, Norway, the sun may not rise for over two months. Without solar heating, the land and ice emit longwave radiation into the atmosphere. If the sky is clear, this heat escapes into space, leading to "radiative cooling." Under stable high-pressure systems, cold air—which is denser than warm air—settles in valleys and basins, creating temperature inversions where the air near the ground is significantly colder than the air a few hundred feet above.
Summer: The Energy Absorption Phase
Conversely, the "midnight sun" provides continuous solar radiation for weeks or months. While the sun is never high in the sky, the cumulative 24-hour exposure allows for significant surface heating. In the 2020s, including our current year of 2026, we have observed that land surfaces in Siberia and Northern Canada are reaching record highs more frequently. This is because land has a lower heat capacity than water; it heats up rapidly once the winter snowpack melts.
Regional Variability: Why the Arctic is Not Uniformly Cold
It is a common misconception that the entire Arctic Circle shares the same temperature profile. In reality, the difference between a coastal town in Norway and a village in central Siberia can be as much as 40 degrees Celsius on the same day.
The Influence of Ocean Currents
The North Atlantic Current, an extension of the Gulf Stream, carries warm water from the tropics into the North Atlantic and the Barents Sea. This acts as a massive radiator for Northern Europe. As a result, coastal locations like Tromsø, Norway, remain relatively mild, with winter temperatures often hovering near freezing (0°C). Without this heat transport, Northern Europe would be as frozen and inhospitable as the Canadian Arctic Archipelago.
Continental Extremes in Siberia and North America
In contrast, the "Pole of Cold" in the Northern Hemisphere is found in the Sakha Republic (Siberia). Locations like Oymyakon and Verkhoyansk are far from the moderating influence of the ocean. In winter, they experience intense continental cooling, with temperatures historically dropping below -60°C (-76°F). However, these same locations can reach 30°C in the summer, representing a staggering temperature swing of 90 degrees Celsius within a single year.
The Physics of Arctic Amplification
As of 2026, the Arctic is warming at roughly three to four times the global average rate. This phenomenon is known as Arctic Amplification. It is driven by several feedback loops that accelerate the rise in temperature beyond what is seen in temperate or tropical zones.
- The Ice-Albedo Feedback: Fresh snow and sea ice have a high albedo, meaning they reflect up to 80-90% of incoming sunlight. As global temperatures rise, sea ice melts, revealing the dark ocean beneath. The ocean has a low albedo, absorbing about 90% of solar radiation. This absorbed heat further melts the ice, creating a self-reinforcing cycle of warming.
- Water Vapor Feedback: A warmer atmosphere can hold more moisture. Water vapor is a potent greenhouse gas. As the Arctic warms, increased evaporation from open leads in the sea ice adds water vapor to the air, trapping more heat near the surface.
- Lapse Rate Feedback: In the tropics, deep atmospheric convection spreads heat vertically. In the Arctic, the atmosphere is more stable, and the warming is concentrated in a thin layer near the surface, making the temperature increase more "felt" at ground level.
The National Snow and Ice Data Center (NSIDC) provides real-time tracking of these ice levels, which are critical indicators of the Arctic's thermal health.
Comparative Temperature Data Across the Arctic
The following table illustrates the diversity of temperature profiles across different sectors of the Arctic Circle, based on standardized climate averages and notable records.
| Location | Coordinates | Avg. Jan Temp (°C) | Avg. July Temp (°C) | Record Low (°C) | Record High (°C) |
|---|---|---|---|---|---|
| Tromsø, Norway | 69°N | -3.0 | 12.0 | -18.4 | 30.2 |
| Utqiaġvik, USA | 71°N | -23.0 | 5.0 | -49.0 | 26.0 |
| Oymyakon, Russia | 63°N* | -46.0 | 15.0 | -67.7 | 34.6 |
| Summit Station, Greenland | 72°N | -42.0 | -12.0 | -63.0 | 3.6 |
| Svalbard (Longyearbyen) | 78°N | -13.0 | 7.0 | -46.3 | 21.7 |
*Note: Oymyakon is slightly south of the Arctic Circle but is the primary reference for Arctic continental cold.
Atmospheric Pressure and the Arctic Oscillation
Temperatures are also heavily influenced by the Arctic Oscillation (AO), a climate pattern characterized by atmospheric pressure winds around the North Pole.
When the AO is in a "positive phase," a strong ring of winds (the polar vortex) traps cold air over the Arctic. This often leads to warmer winters in the mid-latitudes but extremely cold, stable temperatures within the Arctic Circle. When the AO is in a "negative phase," the jet stream becomes wavy and weak. This allows frigid Arctic air to spill south into North America and Europe, while simultaneously pulling warmer air north into the Arctic.
In 2026, researchers are paying close attention to these "sudden stratospheric warming" events, which can disrupt the polar vortex and cause localized temperature spikes in the high Arctic that reach 20°C above the seasonal norm.
Practical Impacts of Temperature Shifts
The thermal state of the Arctic is not just a scientific curiosity; it has profound implications for global infrastructure, ecology, and economics.
Permafrost Degradation
Large portions of the Arctic are underlain by permafrost—ground that has been frozen for two or more consecutive years. As average annual temperatures rise above 0°C, this ground thaws. This compromises the structural integrity of buildings, pipelines, and roads in cities like Norilsk or Fairbanks. Furthermore, thawing permafrost releases stored methane and carbon dioxide, adding to the global greenhouse effect.
Sea Ice and Shipping
The rise in summer temperatures has led to a significant reduction in multi-year sea ice. As of 2026, the Northern Sea Route and the Northwest Passage are increasingly viable for commercial shipping during late summer months. While this reduces transit times between Asia and Europe, it introduces environmental risks to a fragile ecosystem that is ill-equipped for large-scale industrial accidents.
Wildlife and Ecosystems
Species such as the polar bear, ringed seal, and Arctic fox are thermally adapted to extreme cold. Higher temperatures force these species to migrate or compete with sub-Arctic species moving north. For example, the "greening of the Arctic"—the northward expansion of shrubs and trees—is altering the habitat of caribou and reindeer, who struggle to find lichen under deeper, crustier snow resulting from increased winter rain-on-snow events.
Frequently Asked Questions
What is the coldest temperature ever recorded in the Arctic Circle?
While the official record for the Northern Hemisphere is -67.7°C (-89.9°F), recorded in Oymyakon and Verkhoyansk, Russia, satellite measurements of the Greenland Ice Sheet have suggested even lower temperatures in unpopulated high-altitude areas. For inhabited areas, the Sakha Republic remains the benchmark for extreme cold.
Why does the Arctic warm faster than the Antarctic?
The Arctic is an ocean surrounded by land, while Antarctica is a landmass surrounded by ocean. The Arctic's sea ice is much thinner and more susceptible to the albedo feedback loop. Additionally, the Southern Ocean around Antarctica acts as a massive heat sink, buffering the continent from the rapid warming seen in the north.
Can it rain at the North Pole?
Yes, and it is becoming more common. In the past, precipitation in the high Arctic was almost exclusively snow. However, as 2026 data confirms, "Atlantic surges" of warm, moist air are reaching higher latitudes, resulting in rain events even in the middle of winter. These events are devastating for wildlife, as the rain freezes into a layer of ice that prevents animals from grazing.
Does the "Polar Vortex" always mean it's cold in the Arctic?
Actually, the term "Polar Vortex" refers to the cyclone of cold air at the poles. When the vortex is "strong" and stable, the Arctic stays very cold. When people in the United States or Europe complain about a "Polar Vortex" hitting them, it actually means the vortex has broken or weakened, allowing the cold air to leave the Arctic and move south. This often results in the Arctic itself being warmer than usual.
How do scientists measure temperatures in such remote areas?
Scientists use a combination of automated weather stations (AWS), drifting buoys in the Arctic Ocean, and satellite infrared sensors. The National Oceanic and Atmospheric Administration (NOAA) and the Copernicus Climate Change Service integrate this data to create global "reanalysis" maps that provide temperature estimates for every square kilometer of the Arctic.
Summary of Next Actions for Observers
For those looking to monitor Arctic temperatures throughout 2026, the best approach is to follow integrated data platforms. Sudden shifts in the Arctic temperature profile often precede extreme weather events in the mid-latitudes by two to three weeks.
- Monitor Sea Ice Extent: Use the NSIDC Sea Ice Index to track how summer temperatures are impacting the ice pack.
- Track the Arctic Oscillation Index: Follow NOAA’s Climate Prediction Center to see if the polar vortex is stable or leaking cold air southward.
- Stay Informed on Permafrost: Review reports from the International Permafrost Association to understand how rising temperatures are affecting northern infrastructure.
The Arctic remains the world's most sensitive thermometer. Understanding its temperature patterns is essential for predicting the future of the global climate system.