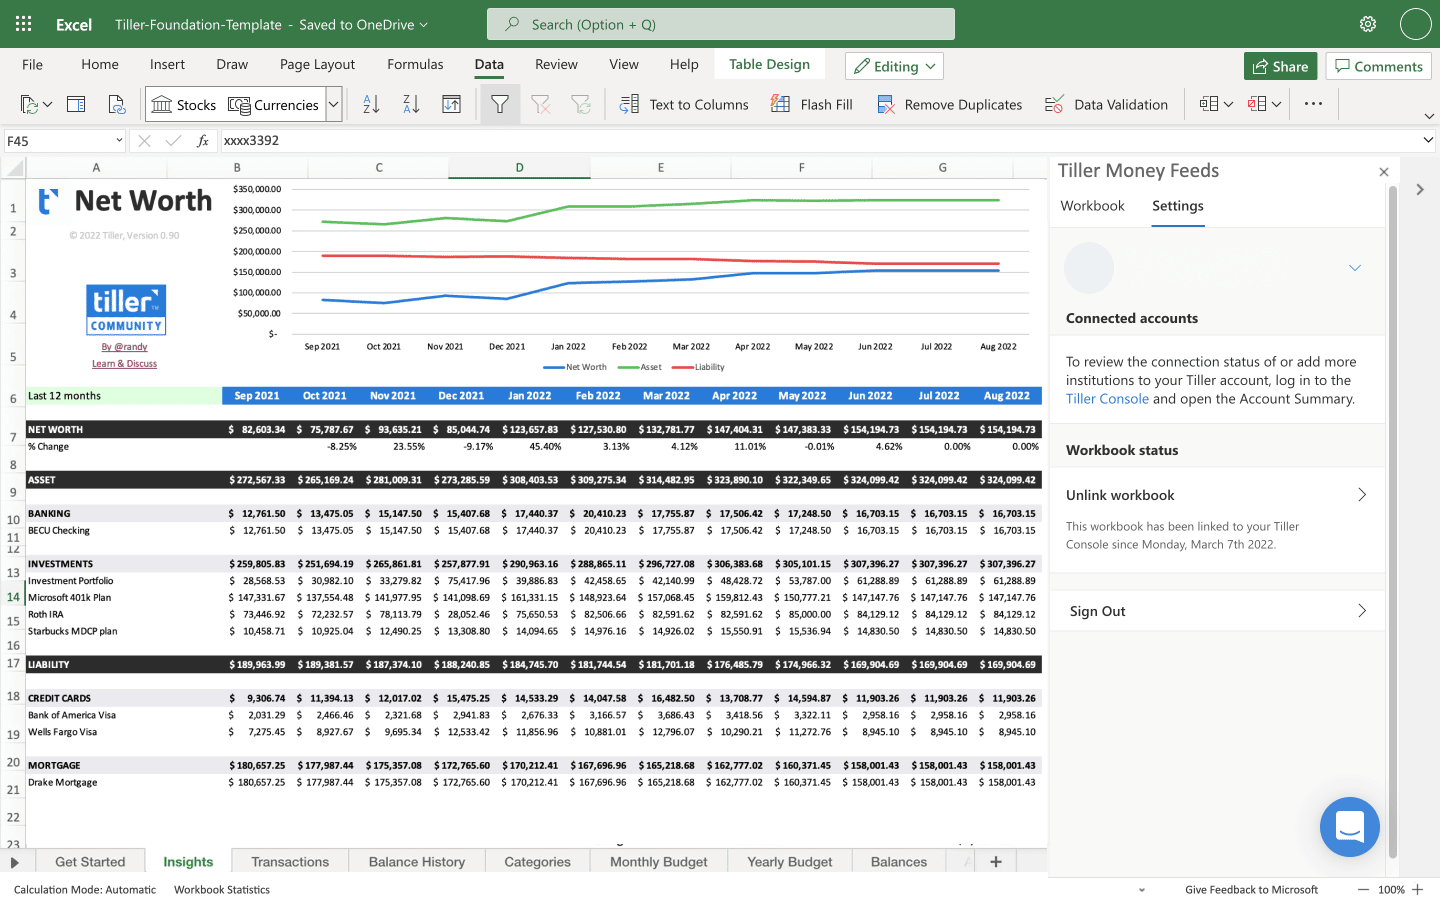
Visualizing a net worth graph in three dimensions transforms standard two-dimensional financial tracking into an immersive spatial experience, allowing you to perceive trends across time, asset classes, and liability categories simultaneously. By incorporating depth, rotation, and volumetric layering, you can identify complex financial correlations that often remain hidden in flat, linear charts.
Introduction to Three-Dimensional Financial Modeling
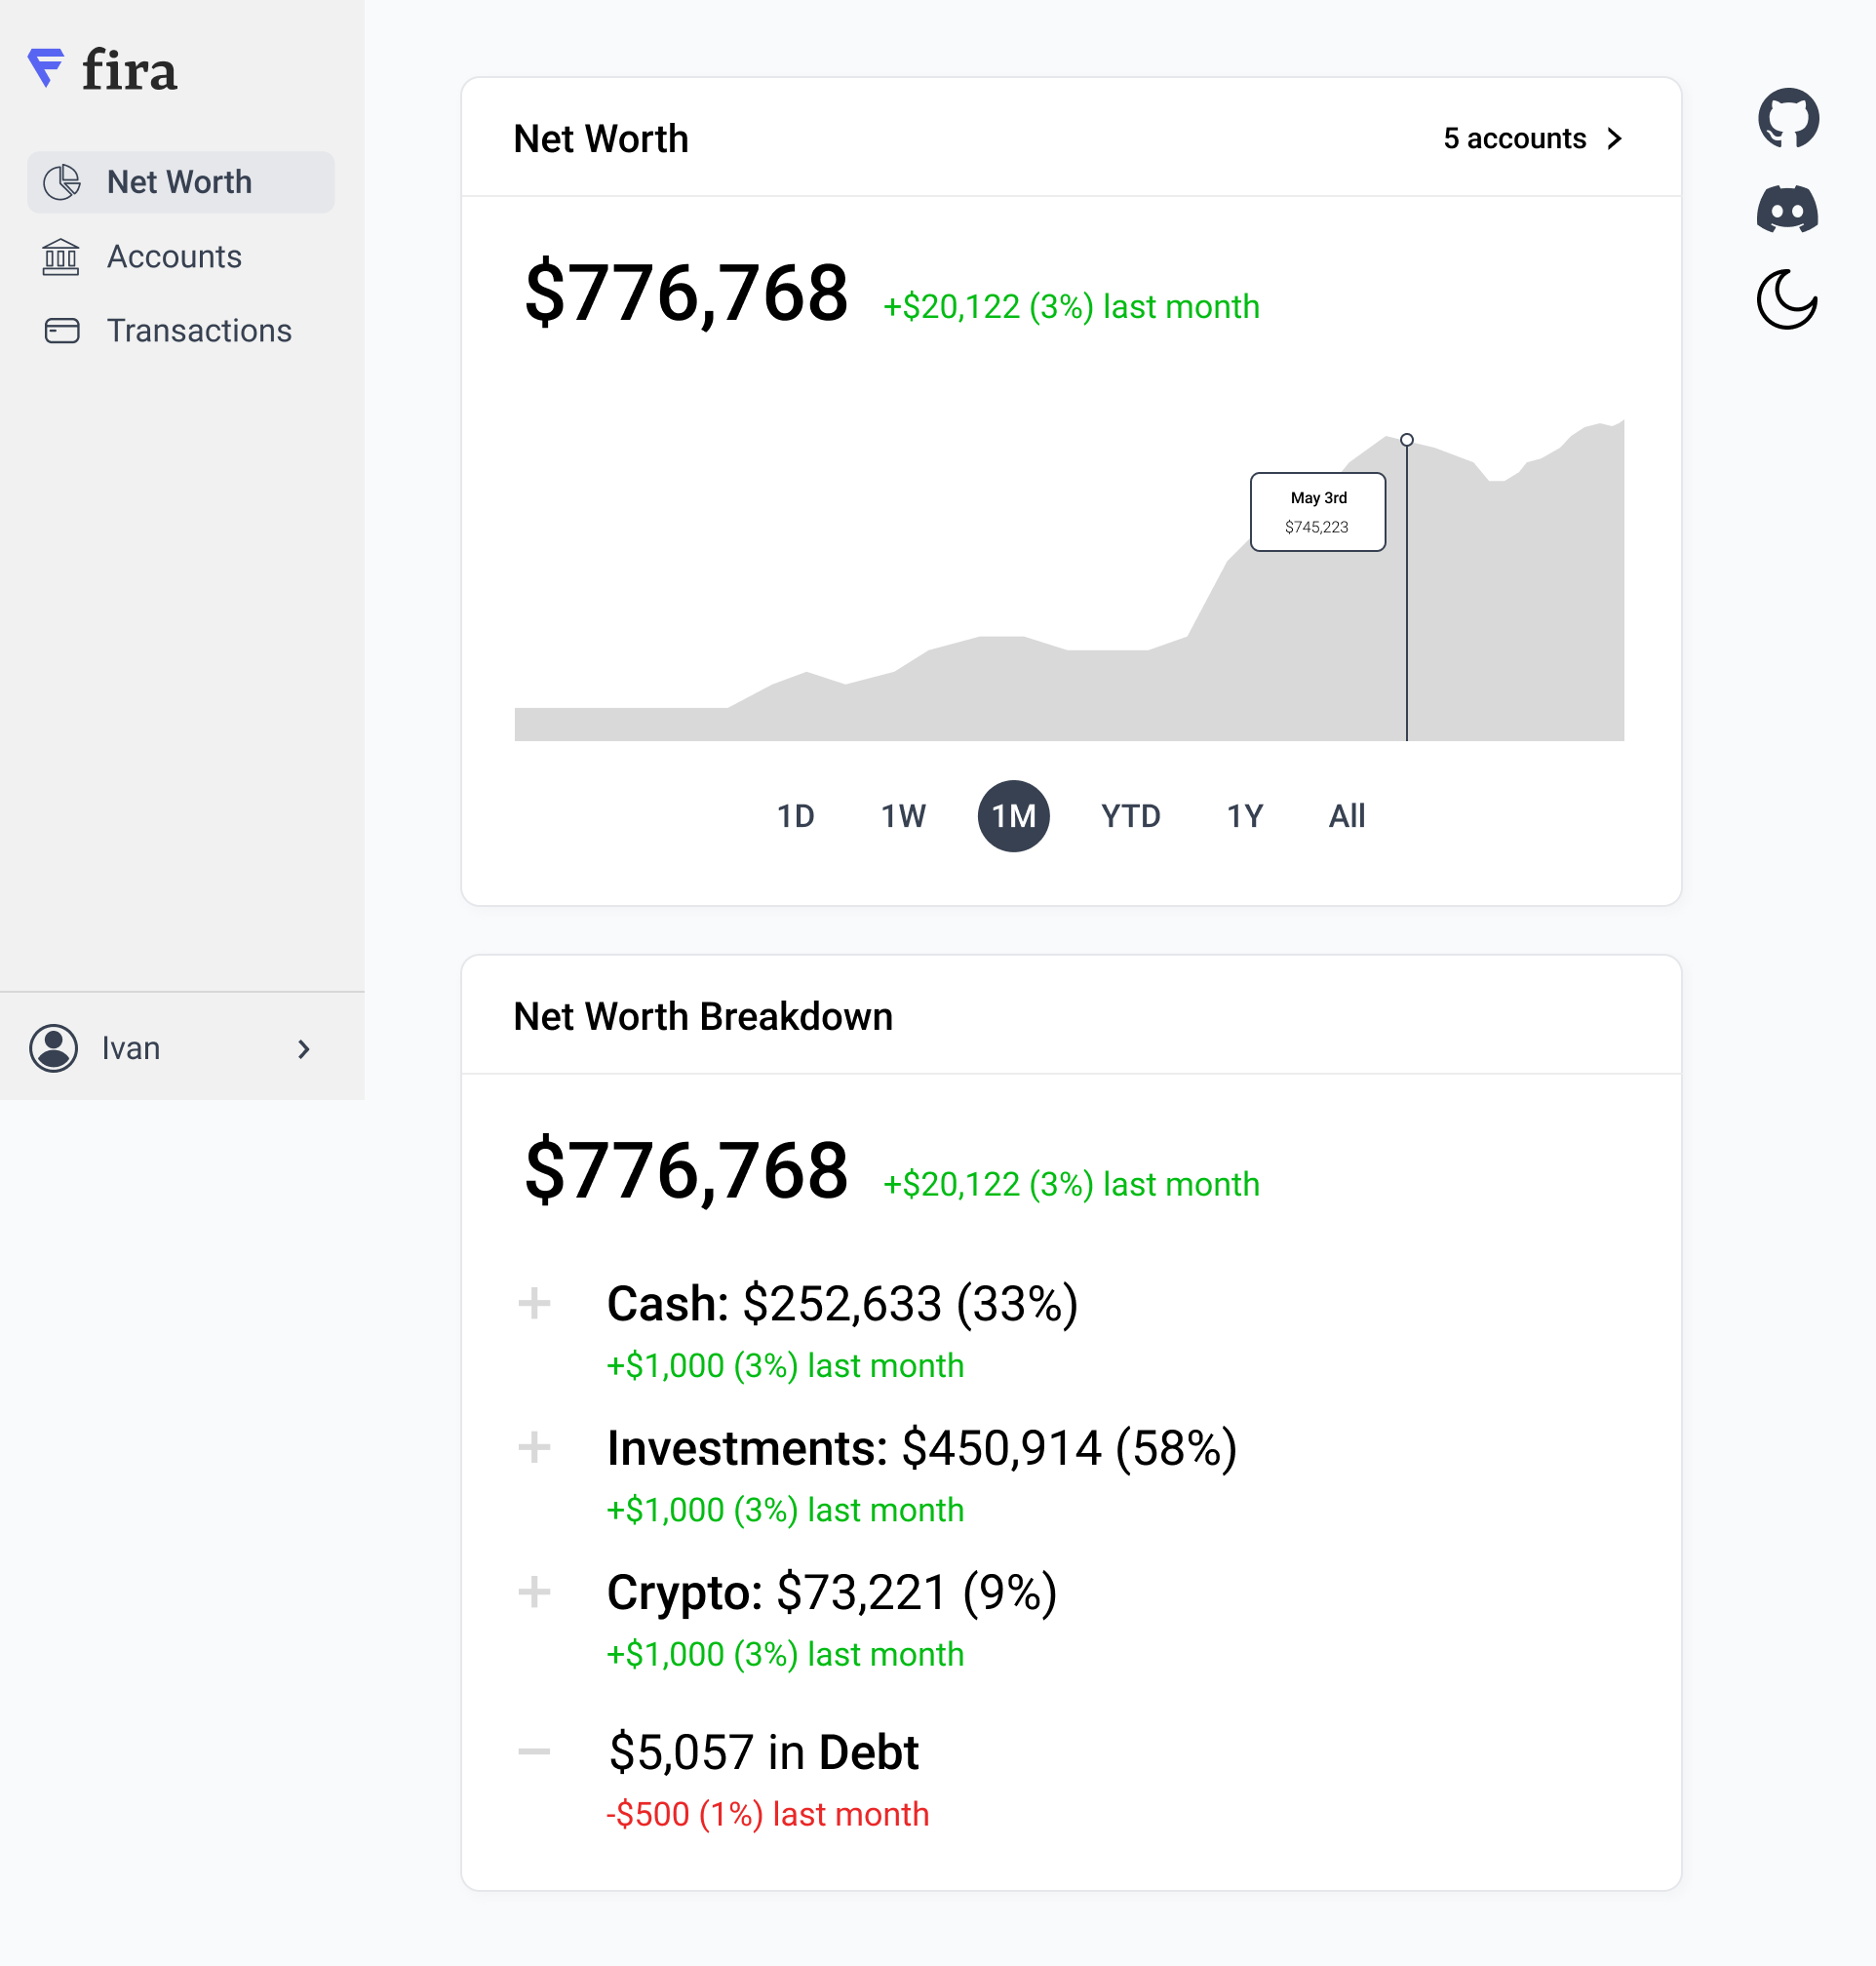
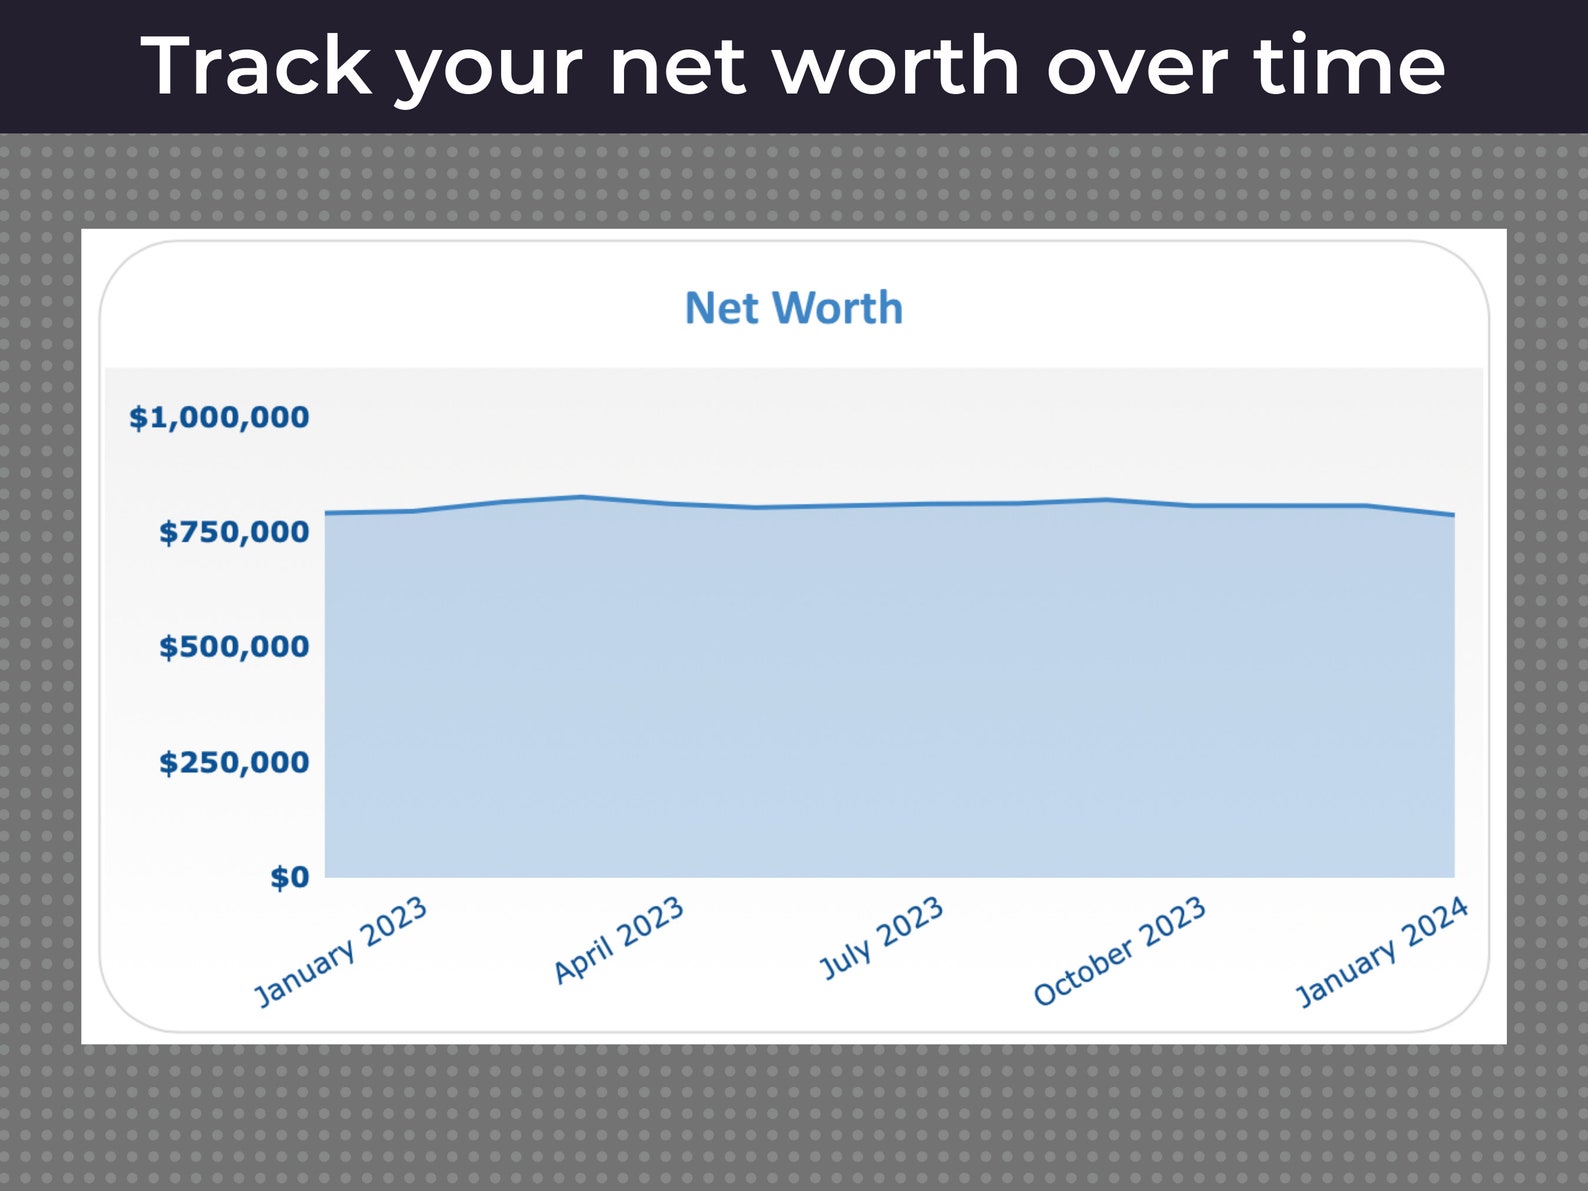
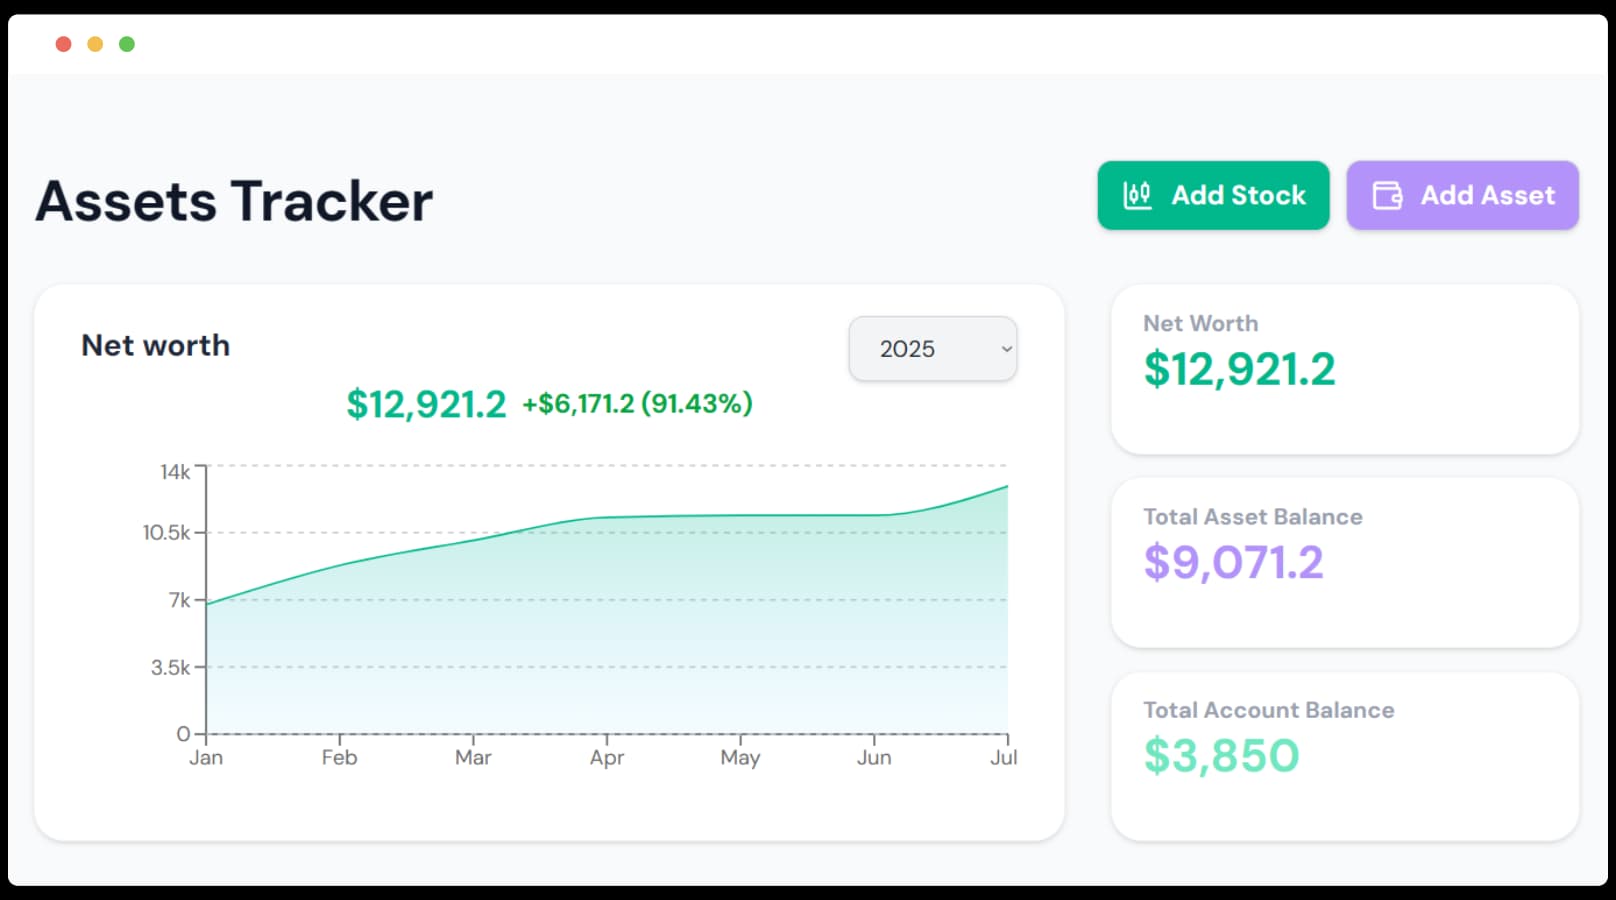
Traditional personal finance dashboards rely on two-dimensional line charts, bar graphs, and area charts. While effective for tracking overall growth over time, these conventional formats struggle when you need to analyze multiple variables at once—such as cash, real estate equity, investment portfolios, and liabilities—interacting across multiple calendar years. A three-dimensional net worth graph introduces a spatial axis, letting depth represent an additional data dimension like asset volatility, risk exposure, or compounding velocity.
Transitioning your personal finance data into a 3D environment requires careful data preparation, compatible spreadsheet or visualization software, and an understanding of how spatial distortion can sometimes obscure rather than clarify trends. Whether you are an individual managing a growing portfolio or a financial professional presenting data to clients, mastering 3D net worth visualization unlocks a more intuitive grasp of long-term wealth accumulation.
Method 1: Using Advanced Spreadsheet Software (Excel and Google Sheets)
Spreadsheet applications remain the most accessible starting point for financial data organization. While Microsoft Excel and Google Sheets are traditionally known for flat 2D charts, both platforms support robust 3D charting engines that can map net worth across time and category variables.
Data Structuring and Formatting Requirements
To build a 3D surface or column chart in a spreadsheet, your data must be structured in a strict matrix format. Instead of a simple two-column list of dates and total net worth amounts, you need a multi-variable grid:
- X-Axis (Rows): Time periods, typically broken down by months or quarters.
- Y-Axis (Columns): Asset and liability categories (e.g., Liquid Cash, Equities, Real Estate, Retirement Accounts, Liabilities).
- Z-Axis (Values): The exact monetary value for each intersection of time and category.
| Date | Cash Equivalents | Equities | Real Estate |
|---|---|---|---|
| Q1 2024 | $15,000 | $120,000 | $250,000 |
| Q2 2024 | $18,000 | $135,000 | $252,000 |
| Q3 2024 | $22,000 | $128,000 | $255,000 |
Step-by-Step Generation in Excel
- Highlight your complete data matrix, including header rows and column labels.
- Navigate to the Insert tab on the top ribbon.
- Click on Recommended Charts or select the Surface or 3D Column chart icon from the chart menu.
- Choose the 3D Wireframe Surface, 3D Contoured Surface, or Clustered 3D Column option.
- Right-click the newly generated chart area and select 3D Rotation to adjust the perspective, elevation, and right-angle axes for optimal visibility.
Advantages and Limitations
Spreadsheet 3D charts require no external coding knowledge and update automatically as you input new monthly data. However, native spreadsheet 3D engines are notoriously prone to visual clutter. If your categories overlap or your time series is too long, bars in the foreground can completely obscure critical data points in the background, requiring manual rotation to inspect hidden quarters.
Method 2: Leveraging Dedicated Data Visualization and BI Tools
When spreadsheet tools reach their limits, dedicated Business Intelligence (BI) platforms and data visualization engines—such as Tableau, Power BI, and Plotly—offer professional-grade 3D rendering capabilities with interactive camera controls.
Integration and Data Pipeline Setup
To use BI tools for a 3D net worth graph, you typically connect the software to an underlying relational database, a CSV export from your budgeting software, or an automated API feed from your financial aggregators.
- Data Cleansing: Ensure all negative values (such as credit card debt or mortgage balances) are correctly formatted as signed integers.
- Normalization: Scale your values if you have massive disparities between accounts (e.g., a $2 million commercial real estate holding alongside a $5,000 emergency fund), as extreme outliers can distort the spatial scaling of the 3D model.
Building Interactive 3D Scatter and Surface Plots
Using Python-based visualization libraries like Plotly within a Jupyter Notebook, or using native 3D custom visuals in Microsoft Power BI, you can plot your net worth as an interactive mesh:
- Plotly Example Code Concept: You define
xas time,yas asset type, andzas the financial valuation. Thego.Surfaceorgo.Scatter3dfunction generates a rotatable web-browser graphic. - Interactivity: Users can hover over specific peaks and valleys to reveal precise currency figures, dates, and account identifiers without cluttering the screen.
import plotly.graph_objects as go
Sample configuration for a 3D net worth surface plot fig = go.Figure(data=[go.Surface(z=net_worth_matrix, x=time_axis, y=asset_categories)]) fig.update_transit(title="3D Net Worth Topography", autosize=False, width=800, height=800, margin=dict(l=65, r=50, b=65, t=90)) fig.show()
Advantages and Limitations
BI tools and plotting libraries offer unmatched aesthetic customization, smooth rotation, zoom functionality, and precise data tooltips. The primary drawback is the technical barrier to entry. Setting up automated pipelines, writing code, or configuring advanced BI connectors requires specialized data literacy that goes beyond standard personal finance management.
Method 3: Utilizing Immersive FinTech Apps and WebGL Dashboards
The most modern approach to viewing financial data in three dimensions involves specialized WebGL-powered financial dashboards and virtual reality (VR) wealth-tracking applications. These tools are built specifically for personal balance sheet visualization.
WebGL and Browser-Based Rendering
WebGL allows modern web browsers to render interactive 3D graphics hardware-accelerated directly on your screen without requiring external software installations. Web-based portfolio trackers use engines like Three.js to render your net worth as a dynamic landscape—often styled as a topological terrain map or a modern city skyline where building heights correspond to asset valuations.
Connecting Financial Accounts Safely
Unlike static spreadsheets, immersive FinTech dashboards often connect directly to financial institutions via secure APIs (such as Plaid or Finicity) to pull real-time balances:
- Authenticate your bank, brokerage, and loan accounts through the encrypted integration portal.
- Map incoming account categories to the application's 3D spatial taxonomy.
- Select your preferred 3D visual theme (e.g., Terrain Topography, Stacked Cylinders, or Volumetric Bars).
- Customize the color gradients to represent asset growth (green/blue palettes) versus debt reduction or liability drag (red/orange palettes).
Advantages and Limitations
WebGL dashboards deliver the most engaging user experience, turning routine balance-sheet reviews into an intuitive, visually stimulating exercise. Real-time syncing eliminates manual data entry. However, security and privacy remain primary considerations; users must trust third-party aggregators with read-only credentials, and subscription fees for niche wealth visualization software can add up over time.
Comparing 3D Net Worth Visualization Methods
To determine which approach best suits your technical skill level, budget, and data complexity, review the comparative matrix below:
| Visualization Method | Technical Barrier | Customization Level | Real-Time Sync | Cost | Best Suited For |
|---|---|---|---|---|---|
| Spreadsheet Software (Excel/Google Sheets) | Moderate | Medium | Manual or Macro-based | Low (Included in Office/Workspace) | DIY enthusiasts comfortable with data grids and matrix formatting. |
| BI Tools & Coding Libraries (Power BI/Plotly) | High | Very High | Automated via Database | Medium to High | Data professionals and advanced users requiring custom analytics. |
| WebGL & FinTech Apps (Three.js Dashboards) | Low | Medium | Fully Automated (API) | Free to Subscription | Users seeking automated tracking with immersive, modern interfaces. |
Best Practices for Interpreting 3D Financial Graphs
While three-dimensional visualizations offer a striking perspective on wealth accumulation, they introduce cognitive biases and visual distortions if not designed carefully.
Avoiding Perspective Distortion
In computer graphics, perspective projection makes objects closer to the "camera" appear larger than identical objects in the background. In a net worth graph, this can accidentally make older data look more significant than recent data simply due to its placement on the Z-axis. Whenever possible, use orthographic projection or ensure your charting tool allows you to normalize depth scaling so that asset comparisons remain mathematically objective.
Color Theory and Emotional Detachment
Financial charts evoke emotional responses. Using alarming colors like saturated red for standard liabilities can create unnecessary anxiety, whereas monochromatic gradients can make it difficult to distinguish between liquid cash and illiquid real estate equity. Establish a clear, neutral color scheme where hues distinguish asset classes rather than signaling moral judgments about debt.
Common Mistakes to Avoid When Building 3D Financial Models
- Overcomplicating the Axes: Attempting to plot too many variables (e.g., time, asset class, geographic location, currency type, and tax status all at once) turns your graph into an unreadable cloud of data points. Stick to three primary axes: Time, Category, and Value.
- Ignoring Liabilities: Failing to subtract or properly map debts results in an asset-only graph that misrepresents your true financial standing. Ensure liabilities are either plotted on a negative Z-axis or represented as negative volume values.
- Neglecting Mobile Responsiveness: 3D charts rendered via WebGL or heavy spreadsheets often break or lag on mobile device screens. Always test your visualization across desktop monitors and mobile displays to ensure interactive controls remain functional.
Frequently Asked Questions
Why use a 3D net worth graph instead of a standard 2D line chart?
A standard 2D line chart only shows your total net worth changing over a single timeline. A 3D graph allows you to visualize how individual asset and liability categories evolve simultaneously across that same timeline, offering immediate spatial insight into which specific accounts are driving your financial growth or stagnation.
Do I need coding experience to create a 3D financial graph?
No. While advanced libraries like Python's Plotly require coding, you can build 3D surface and column charts using native charting features in Microsoft Excel, Google Sheets, or pre-built WebGL financial dashboard applications without writing a single line of code.
How do I handle negative net worth or debt in a 3D chart?
Negative values require charting engines that support below-zero scaling on the Z-axis. In spreadsheet surface charts or 3D column charts, ensure your vertical axis scale is explicitly set to accommodate negative numbers so that debt valleys drop below the baseline plane rather than causing rendering errors.
Are WebGL financial visualization apps safe to use?
Reputable WebGL dashboards use read-only financial aggregators with bank-grade encryption to pull account balances. However, you should always review the privacy policy, enable multi-factor authentication, and avoid sharing login credentials directly with unverified third-party visualization tools.
Next Actions for Your Financial Visualization Setup
Start by auditing your current financial tracking system. If you already maintain a detailed monthly balance sheet in a spreadsheet, highlight your data matrix and test Excel or Google Sheets' 3D surface charting tools to preview your wealth topography. If you prefer automated tracking, explore WebGL-enabled FinTech portfolio dashboards that connect securely via API. By moving beyond flat 2D lines, you will gain a clearer, more dynamic spatial awareness of your long-term financial trajectory.