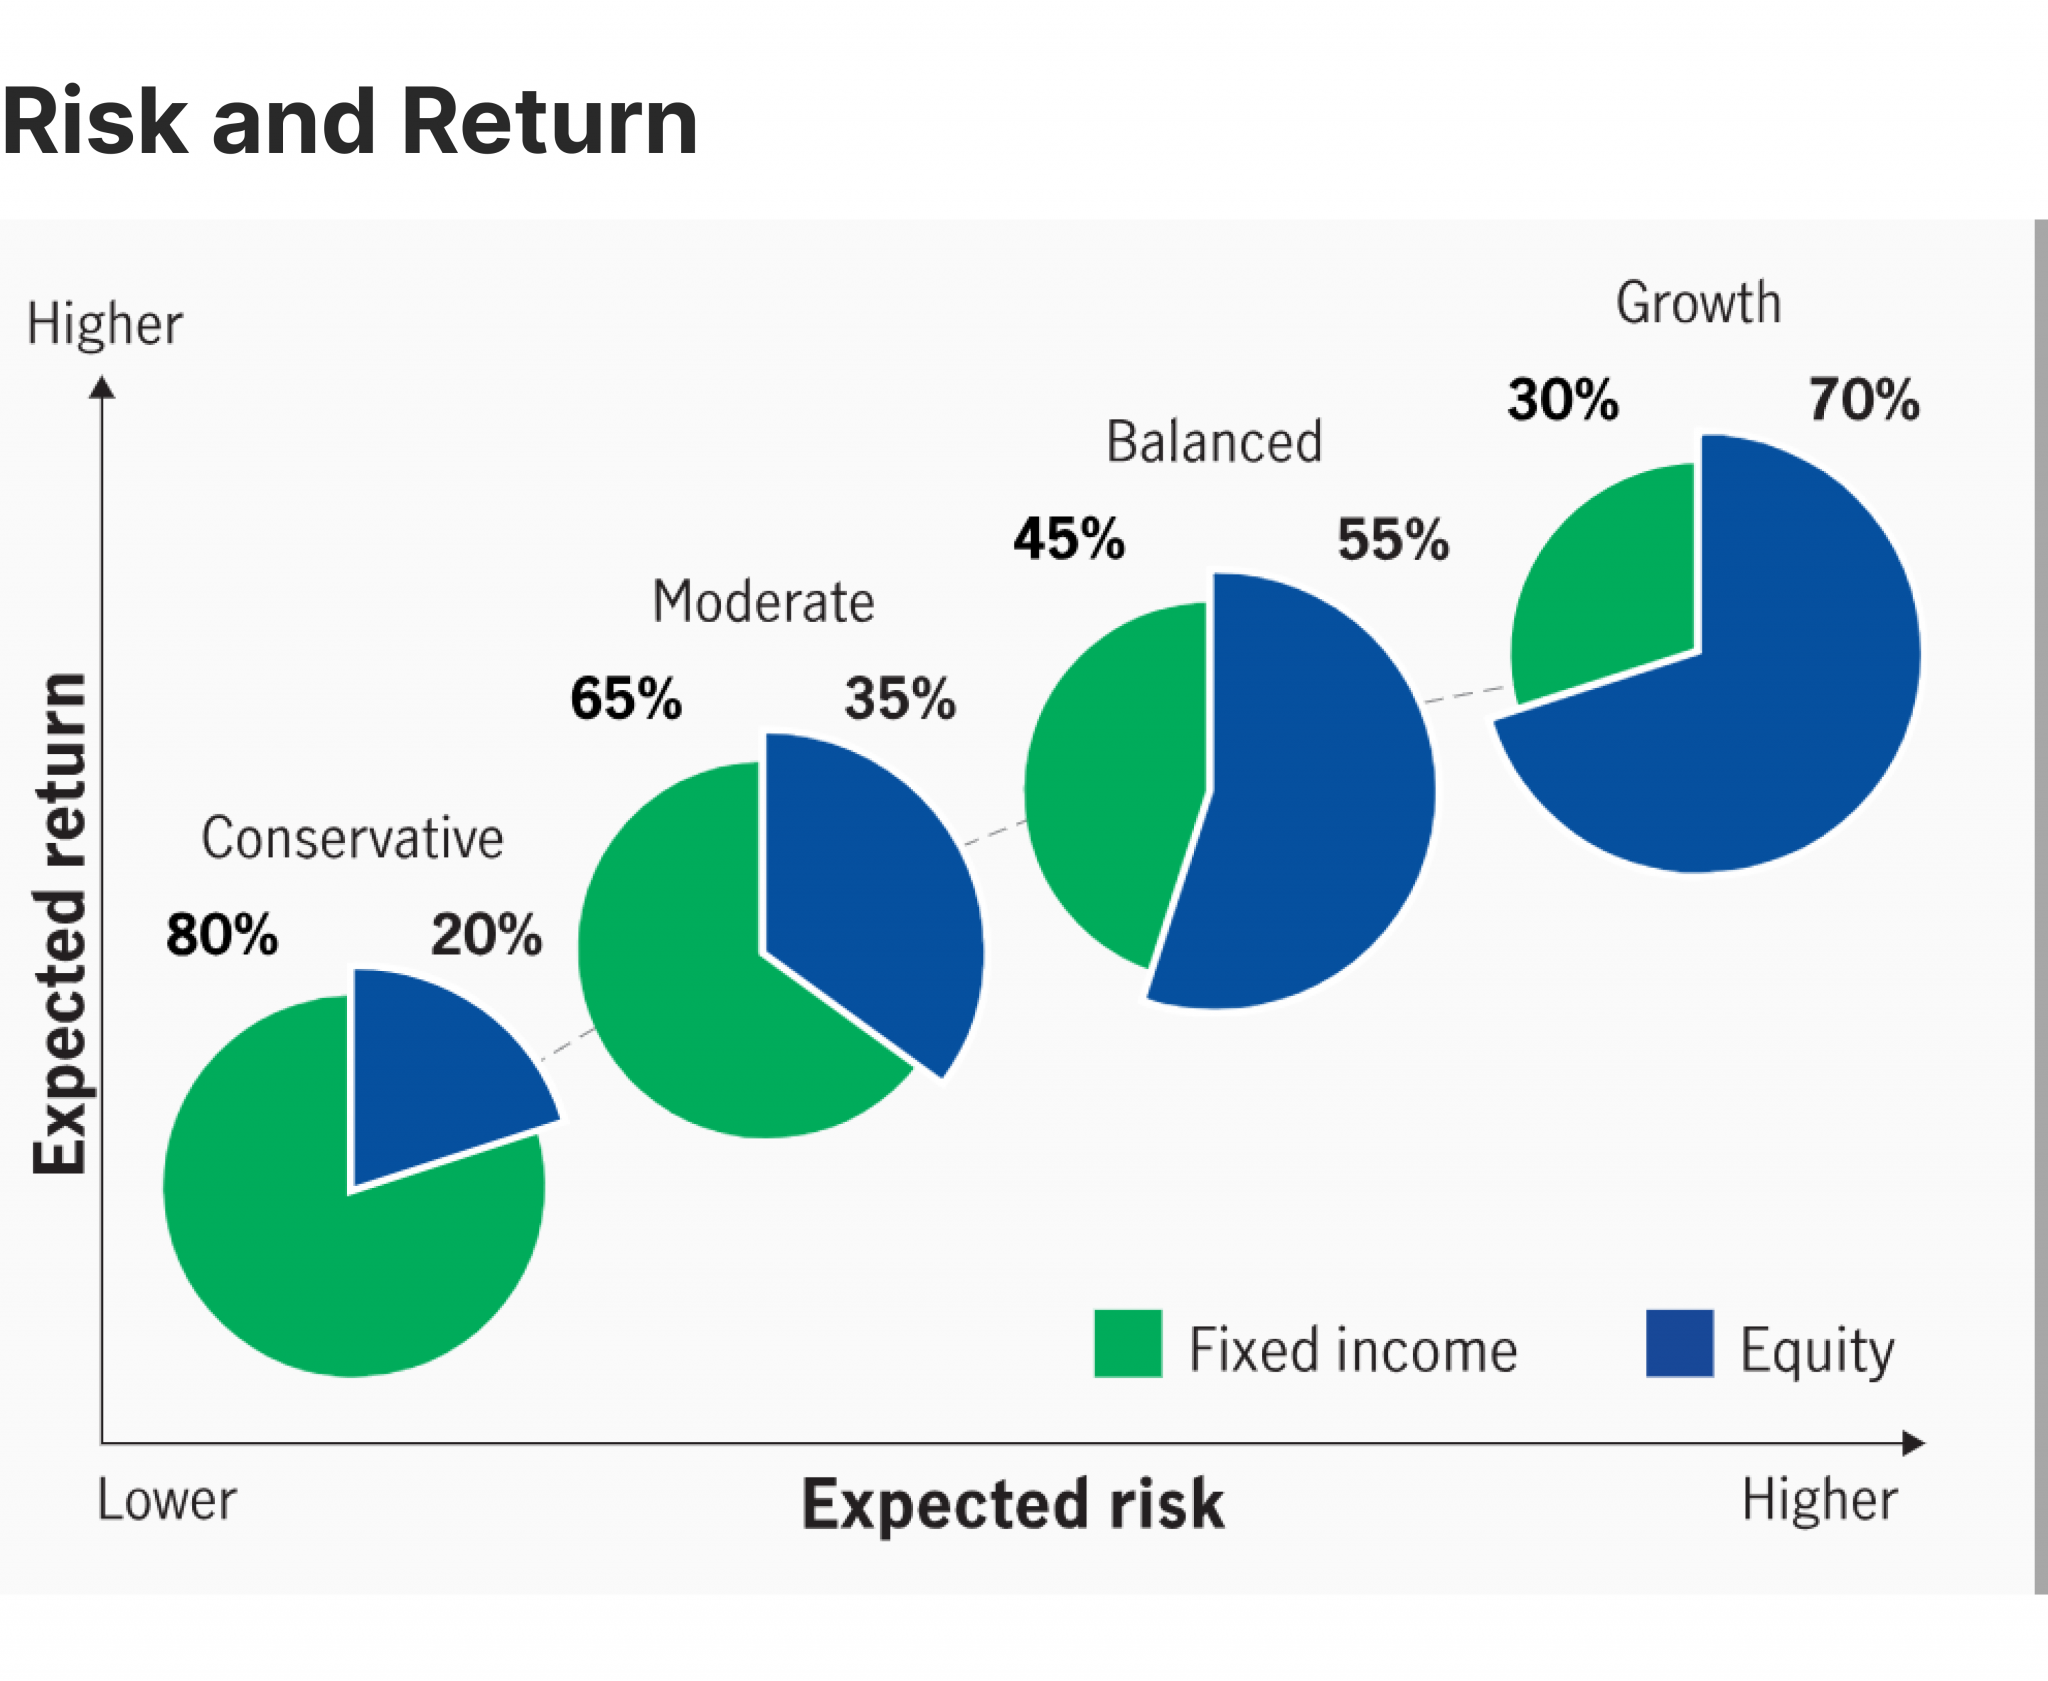
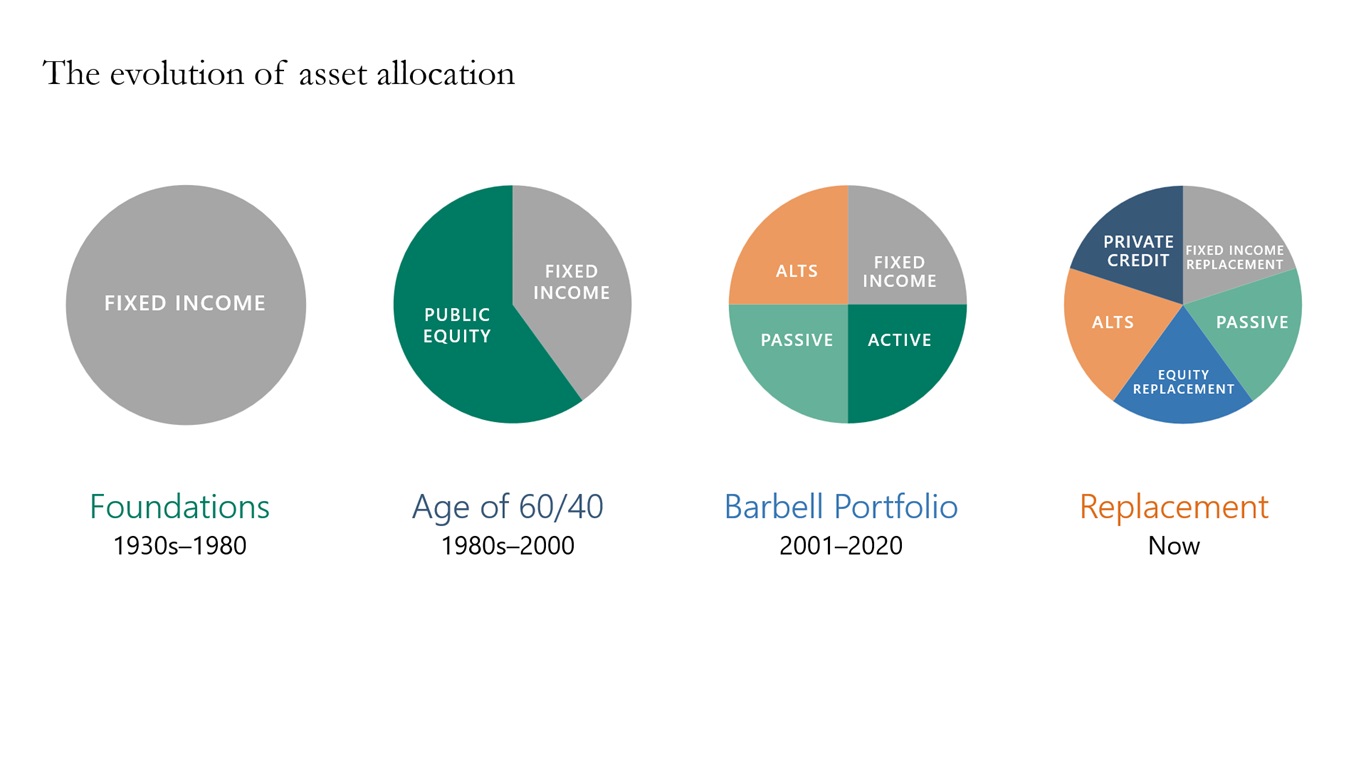
An asset allocation by age chart is a visual and mathematical guideline designed to help investors structure their investment portfolios by balancing high-growth equities with stable fixed-income assets based on their current life stage and time horizon.
Introduction to Asset Allocation by Age
For decades, individual investors, financial planners, and institutional managers have sought reliable frameworks to determine how much money should be exposed to the volatility of the stock market versus the stability of bonds and cash equivalents. One of the most enduring and accessible tools for this purpose is the asset allocation by age chart. These charts simplify the complex process of portfolio diversification by providing a sliding scale of risk, typically decreasing equity exposure as an investor ages.
However, relying solely on a generic chart without understanding the underlying mechanics, psychological risk tolerance, and modern economic realities can lead to suboptimal financial outcomes. This guide explores the structure of age-based asset allocation, the mathematics and philosophy driving these recommendations, the variations found across the financial industry, and how to tailor these principles to your unique circumstances. Whether you are a young professional building your first retirement account or an older adult planning for capital preservation, understanding how to read and apply an asset allocation by age chart is essential for long-term financial security.
The Core Philosophy: Time Horizon and Risk Tolerance
At the heart of every asset allocation model are two foundational pillars: time horizon and risk tolerance. Understanding these concepts helps explain why age-based charts recommend the specific breakdowns they do.
The Mathematics of Time Horizon
Your time horizon is the total length of time that you expect to be investing money before you begin systematically withdrawing it. Younger investors possess a massive structural advantage: time. If a twenty-something-year-old investor experiences a severe 40% market downturn, they have decades ahead of them for the market to recover, compound, and reach new highs.
Conversely, an investor who is five years away from retirement does not have the luxury of a multi-decade recovery window. If a severe bear market strikes the eve of their retirement, a heavy equity concentration could permanently impair their principal balance, forcing them to delay retirement or drastically cut their living standards—a phenomenon known as sequence-of-returns risk. Therefore, age-based models systematically reduce equity exposure to shield aging portfolios from catastrophic drawdowns right when cash flow needs are highest.
Balancing Risk Capacity Versus Risk Willingness
While risk capacity is objective and tied directly to your age, income, and time horizon, risk willingness is entirely psychological. A twenty-year-old might have a high risk capacity due to their age, but if they panic and sell at the absolute bottom of every market correction, their actual risk willingness is low. Asset allocation charts attempt to anchor investors by providing a rules-based structure that removes emotion from the equation, substituting disciplined rebalancing for reactionary decision-making.
Classic Rules of Thumb: The "Rule of 100" and Beyond
To fully appreciate modern asset allocation charts, one must examine the historical rules of thumb that spawned them. These simple formulas laid the groundwork for visual charts used by brokerages today.
The Traditional Rule of 100
For generations, the gold standard rule of thumb for equity allocation was subtracting your age from 100.
- Formula: $\text{Percentage in Stocks} = 100 - \text{Your Age}$
- Application: If you are 30 years old, the formula suggests keeping 70% of your portfolio in stocks and 30% in bonds or cash. If you are 60 years old, the proportion shifts to 40% stocks and 60% fixed income.
The Modernized "Rule of 110" or "Rule of 120"
As global life expectancies increased and traditional defined-benefit pensions declined, financial researchers realized that the Rule of 100 was too conservative. Living into your nineties or hundreds means your money needs to outpace inflation for a much longer retirement span. Consequently, modern asset allocation charts frequently utilize a "Rule of 110" or "Rule of 120."
- Formula (Rule of 120): $\text{Percentage in Stocks} = 120 - \text{Your Age}$
- Application: Under this modern adjustment, a 60-year-old investor would maintain a 60% equity allocation instead of 40%, ensuring greater growth potential to combat the erosive effects of inflation over a potentially thirty-year retirement.
| Investor Age | Traditional Rule of 100 (Stocks / Bonds) | Modern Rule of 120 (Stocks / Bonds) | Typical Life Stage Focus |
|---|---|---|---|
| 25 | 75% / 25% | 95% / 5% | Wealth accumulation, career building, maximum growth |
| 35 | 65% / 35% | 85% / 15% | Family formation, peak earning years, long-term compounding |
| 45 | 55% / 45% | 75% / 25% | Mid-career acceleration, asset consolidation |
| 55 | 45% / 55% | 65% / 35% | Pre-retirement planning, risk mitigation |
| 65 | 35% / 65% | 55% / 45% | Early retirement, capital preservation, income generation |
| 75+ | 25% / 75% | 45% / 55% | Late retirement, estate planning, conservative distribution |
Anatomy of a Standard Asset Allocation by Age Chart
When examining an institutional asset allocation chart provided by major financial firms, you will notice that categories extend far beyond a simple binary split of "stocks versus bonds." A comprehensive chart breaks down asset classes into granular sub-components.
1. Domestic and International Equities
Equities represent ownership shares in corporations. In a standard chart, equity allocations are further subdivided into:
- Large-Cap Growth and Value: Stable, established companies (e.g., S&P 500 components) that form the bedrock of the portfolio.
- Small-Cap and Mid-Cap Equities: Smaller companies that historically offer higher growth potential alongside higher volatility.
- International Developed and Emerging Markets: Stocks outside your home country, providing geographical diversification to protect against localized economic downturns.
2. Fixed Income (Bonds and Cash)
Fixed-income assets provide a predictable stream of income and act as a shock absorber during equity market sell-offs. Components include:
- Government Bonds: U.S. Treasuries or sovereign debt, which generally offer the highest safety and liquidity during crises.
- Corporate Bonds: Investment-grade debt issued by corporations, yielding higher returns than government bonds with moderate credit risk.
- TIPS (Treasury Inflation-Protected Securities): Bonds specifically indexed to inflation, safeguarding purchasing power.
- Cash Equivalents: Money market funds and short-term certificates of deposit (CDs) providing ultimate capital stability and emergency liquidity.
3. Alternative Investments
Modern charts for high-net-worth individuals or institutional portfolios sometimes incorporate alternative assets such as Real Estate Investment Trusts (REITs), commodities, or private equity. These assets have low correlation with traditional stock and bond markets, enhancing overall portfolio efficiency.
How Target-Date Funds Automate the Chart
For individual investors who prefer a hands-off approach, the asset allocation by age chart is operationalized through Target-Date Retirement Funds (TDFs). These mutual funds or exchange-traded funds (ETFs) are built around a specific target retirement year (e.g., Target 2050 Fund).
The Glide Path Mechanism
The internal asset allocation of a target-date fund changes automatically over time along a trajectory known as a glide path.
- Far from Target Date: The fund holds an aggressive posture—often 90% or more in global equities.
- Approaching Target Date: The fund gradually sells equities and purchases fixed income every quarter or year.
- At and Beyond Target Date: The glide path eventually flattens out into a static retirement portfolio, balancing income generation with moderate growth.
While target-date funds offer incredible convenience, investors must inspect the specific glide path of individual fund families. Some providers use a "to-retirement" glide path, which reaches its most conservative asset mix the year the investor turns 65. Others use a "through-retirement" glide path, which continues to hold meaningful equity exposure past retirement age to protect against outliving one's assets.
Limitations and Criticisms of Age-Based Allocation
While asset allocation charts provide a useful starting point, relying on them blindly can introduce significant blind spots. Experienced financial planners emphasize several notable limitations.
1. The Death of Fixed Income Yields and Changing Economics
Traditional asset allocation charts assume a historical inverse relationship between stocks and bonds: when stocks fall, high-quality bonds rise, cushioning the portfolio. However, in low-interest-rate environments or periods of stubborn inflation, bonds and stocks can fall simultaneously. Relying on a rigid 40% bond allocation when bond yields fail to beat inflation can quietly erode a retiree's purchasing power.
2. Failure to Account for Human Capital
Standard age-based charts treat every 30-year-old the same. In reality, a tenured civil servant with a guaranteed government pension has immense secure future income (human capital) that acts similarly to a massive bond portfolio. Therefore, that civil servant can afford to hold a 100% equity portfolio in their retirement accounts. Conversely, a commission-based salesperson with zero job security has a much lower risk capacity and may need a more conservative mix despite being young.
3. Personal Net Worth and Spending Flexibility
Asset allocation charts do not factor in an individual's savings rate or lifestyle expenditure flexibility. An aggressive saver who has accumulated ten times their annual salary by age 40 has far more flexibility in their asset mix than someone starting from scratch at the same age.
Customizing Your Chart: Step-by-Step Implementation
To make an asset allocation by age chart work for your actual financial life, you must adjust the baseline numbers using a personalized framework.
Step 1: Assess Your True Time Horizon
Do not use your chronological age in a vacuum. Ask yourself:
- At what exact age do I realistically plan to stop working full-time?
- Do I intend to fund a multi-decade retirement spanning thirty or forty years?
- Do I have health considerations that might shorten or lengthen my distribution phase?
Step 2: Evaluate Your Complete Balance Sheet
Sum up all your investment accounts (401(k), IRA, taxable brokerage accounts, pensions, and real estate equity). View your entire financial life as a single consolidated portfolio rather than managing individual accounts in silos. For instance, if your taxable brokerage account holds conservative dividend stocks, your tax-advantaged retirement accounts can afford a more aggressive growth posture.
Step 3: Implement Regular Rebalancing
An asset allocation chart is only as good as its maintenance. If stocks surge during a bull market, your initial 70% equity allocation might naturally drift to 85% by the end of the year, drastically increasing your portfolio's risk profile without your explicit consent.
- Calendar Rebalancing: Review and adjust your portfolio allocations once or twice a year on a set date.
- Threshold Rebalancing: Rebalance your holdings whenever a specific asset class drifts more than 5% away from its target percentage on your chosen chart.
Frequently Asked Questions
What is the safest asset allocation by age?
There is no universal "safest" allocation because safety depends on your timeline. For a young investor, safety means protecting against inflation by holding equities. For a retiree, safety means protecting against capital loss by holding a mix of short-term cash, high-quality bonds, and dividend-paying stocks. Absolute safety (holding 100% cash) guarantees losses over long periods due to inflation.
Should my asset allocation change if I plan to retire early?
Yes. If you plan to retire at age 45 instead of 65, your time horizon for withdrawals is much longer, but your accumulation window is shorter. You will need a higher equity allocation than a standard 45-year-old chart suggests to ensure your capital lasts for a multi-decade early retirement, while also maintaining a larger cash bucket to fund expenses before tax-advantaged accounts can be accessed penalty-free.
How do I handle employer-sponsored retirement plans when using these charts?
When reviewing your 401(k) or 403(b) lineup, look for index funds or pre-mixed allocation models that match your target percentages. If your plan lacks low-cost index funds, you can replicate a balanced asset allocation by selecting a broad-market U.S. stock index fund, an international stock fund, and a aggregate bond fund in proportions dictated by your chosen age chart.
What is the difference between strategic and tactical asset allocation?
Strategic asset allocation is the long-term baseline mix derived from your age and risk tolerance (e.g., maintaining 80% stocks and 20% bonds). Tactical asset allocation is a short-term, active deviation from that baseline designed to exploit temporary market mispricings or macroeconomic shifts. Most individual investors achieve the best long-term results by sticking strictly to a disciplined strategic allocation.
Can I completely eliminate bonds from my portfolio if I am young?
Technically yes, some aggressive investors choose a 100% equity portfolio in their twenties and thirties. However, behavioral finance shows that holding a small percentage of bonds (such as 5% to 10%) can provide cash reserves to buy equities during severe market crashes, serving a psychological purpose even when mathematical growth is the primary objective.
Conclusion and Next Actions
An asset allocation by age chart serves as an invaluable navigational compass, replacing emotional decision-making with structural discipline. By recognizing that your time horizon shortens as you age, these charts provide a systematic method to dial down portfolio risk and protect your hard-earned wealth.
Your immediate next action is to audit your current investments. Log into your financial accounts, calculate your current aggregate asset breakdown between equities and fixed income, and compare it against a modern age-based benchmark. If your portfolio has drifted significantly, schedule a rebalancing session to realign your investments with your long-term financial goals.