Bonds are neither strictly long-term nor short-term investments; rather, they span a wide spectrum of maturities ranging from less than a year to 30 years or more. A bond’s classification depends entirely on its maturity date, which determines how long the issuer has to repay the principal to the bondholder.
Disclaimer: This guide is provided for educational and informational purposes only and does not constitute personalized financial, investment, legal, or tax advice. Consult a licensed financial professional to evaluate your specific situation.
Understanding Bond Maturity: How Term Lengths Are Defined
When an investor purchases a bond, they are effectively extending a loan to an issuing entity—such as a government, municipality, or corporation. In exchange for this capital, the issuer promises to pay periodic interest (known as coupon payments) and return the bond’s original face value (the principal or par value) on a specified date. That final repayment date is the bond's maturity date.
The financial industry broadly categorizes bonds into three primary maturity buckets: short-term, intermediate-term (or medium-term), and long-term. Understanding where a security falls along this continuum is essential for evaluating its potential return, price volatility, and suitability within a broader investment portfolio.
- Short-Term: 0 to 3 Years
- Intermediate-Term: 3 to 10 Years
- Long-Term: 10 to 30+ Years
Short-Term Bonds (Maturity of 0 to 3 Years)
Short-term debt instruments mature relatively quickly. In institutional practice, money market instruments mature in less than one year, while short-term bonds generally carry maturities between one and three years.
- Common Examples: U.S. Treasury bills (T-bills, which mature in 4, 8, 13, 17, 26, or 52 weeks), short-term corporate notes, commercial paper, and short-dated municipal bonds.
- Primary Objective: Capital preservation and liquidity. Because the principal is returned within a brief window, short-term bonds carry lower exposure to interest rate fluctuations.
- Yield Profile: Yields on short-term bonds closely track benchmark interest rates set by central banks, such as the Federal Reserve.
Intermediate-Term Bonds (Maturity of 3 to 10 Years)
Intermediate-term bonds bridge the gap between short-term liquidity and long-term income generation. They typically carry maturity horizons of 3 to 10 years.
- Common Examples: 3-year, 5-year, 7-year, and 10-year U.S. Treasury notes, medium-term corporate bonds, and medium-term municipal obligations.
- Primary Objective: A balance between yield generation and price stability. Intermediate bonds are widely considered the core building blocks of fixed-income allocations.
- Yield Profile: They generally offer higher yields than short-term paper without exposing the investor to the extreme price sensitivity of 20- or 30-year debt.
Long-Term Bonds (Maturity of 10 to 30+ Years)
Long-term bonds represent multi-decade credit commitments. The standard upper threshold for conventional government and corporate bonds is 30 years, though ultra-long issues (such as 50-year or 100-year bonds) exist in specific markets.
- Common Examples: 20-year and 30-year U.S. Treasury bonds, long-term corporate debt issued by stable blue-chip companies, and long-term municipal infrastructure bonds.
- Primary Objective: Maximizing long-term predictable income streams and matching long-dated liabilities (such as pension payouts or insurance underwriting obligations).
- Yield Profile: Historically, long-term bonds offer higher yields to compensate investors for holding debt over extended periods, a concept known as the term premium.
How Maturity Affects Risk and Return Profiles
Choosing between short-, intermediate-, and long-term bonds involves evaluating several distinct risk factors. A bond's maturity directly dictates how sensitive its market value is to broader economic shifts.
Interest Rate Risk and Macaulay Duration
Interest rate risk is the risk that a bond's market value will decline when market interest rates rise. Bond prices and interest rates share an inverse relationship: when rates go up, existing bond prices fall, and vice versa.
The metric used to quantify this sensitivity is duration (specifically Macaulay duration and modified duration). Duration measures the weighted average time until a bond's cash flows are received, expressed in years.
- Short-Term Duration: A 2-year bond with a duration of roughly 1.9 years will lose approximately 1.9% of its market value if prevailing interest rates rise by 1 percentage point.
- Long-Term Duration: A 30-year bond with a duration of 18 years will lose approximately 18% of its market value under the same 1 percentage point rate increase.
Because long-term bonds lock in coupon payments for decades, a shift in market rates makes those fixed coupons significantly more or less attractive relative to newly issued bonds, resulting in higher price volatility.
Yield Curve Mechanics
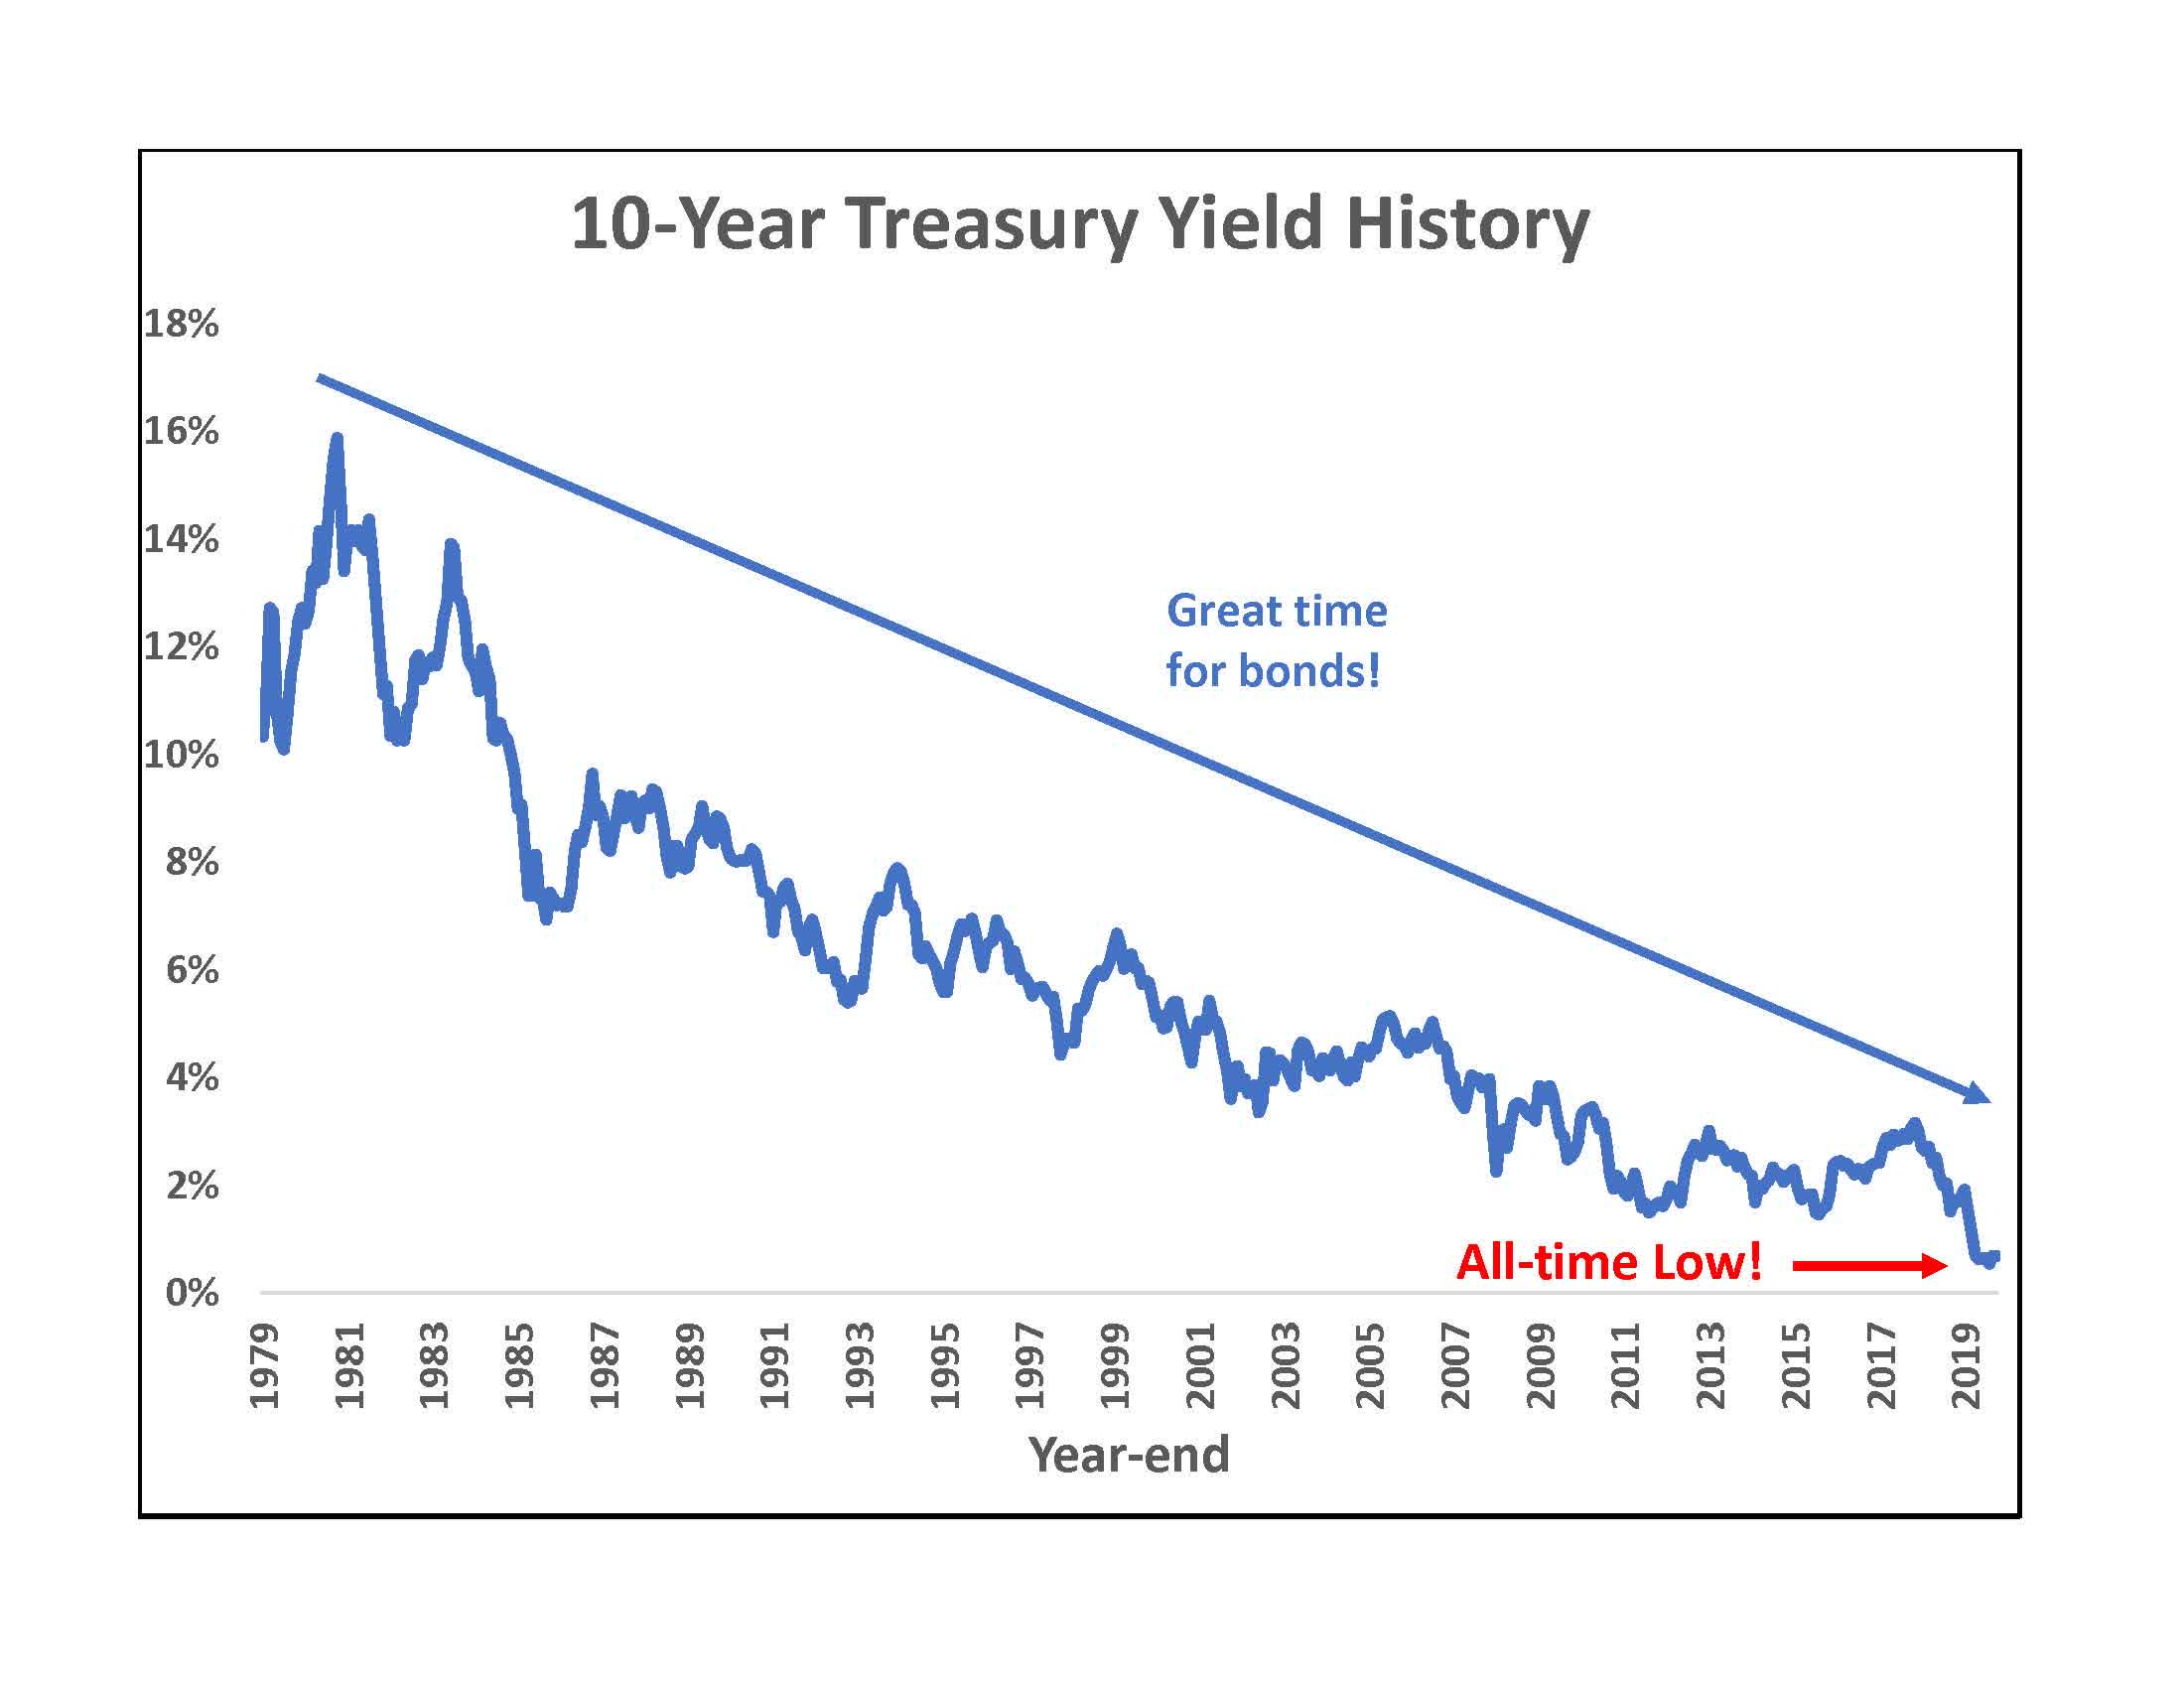
The relationship between bond yields and their respective maturity dates is visualized through the yield curve. Under normal economic conditions, the yield curve slopes upward, meaning longer maturities carry higher annual yields to compensate for locking up capital.
- Short-Term (0-3 Yrs)
- Intermediate-Term (3-10 Yrs)
- Long-Term (10-30 Yrs)
However, economic cycles can alter this shape:
- Normal Yield Curve: Long-term yields are higher than short-term yields, reflecting healthy economic growth and positive inflation expectations.
- Inverted Yield Curve: Short-term yields exceed long-term yields. This typically occurs when central banks raise short-term policy rates aggressively to combat inflation, signal economic slowing, or signal impending recessions.
- Flat Yield Curve: Yields across short, intermediate, and long maturities are nearly identical, signaling economic transition or uncertainty.
Investors can review official Treasury market data through the U.S. Department of the Treasury to track current yield curve dynamics.
Inflation Risk (Purchasing Power Erosion)
Inflation reduces the purchasing power of fixed payments over time. A dollar received 25 years from now will buy substantially less than a dollar received today.
- Short-term bonds face minimal inflation risk because they mature quickly, allowing investors to reinvest their principal at updated, inflation-adjusted market yields.
- Long-term bonds carry substantial inflation risk. If inflation accelerates unexpectedly, the purchasing power of a fixed 4% or 5% coupon payment erodes significantly over a 30-year holding period.
To mitigate this risk, government institutions issue inflation-indexed debt, such as Treasury Inflation-Protected Securities (TIPS), which adjust their principal value based on the Consumer Price Index (CPI), as documented by TreasuryDirect.
Credit and Default Risk Over Time
Credit risk is the probability that the borrower will fail to make scheduled interest or principal payments. Over a 2-year horizon, predicting a corporation's solvency is relatively straightforward. Over a 30-year period, technological disruptions, competitive shifts, or financial distress can compromise even robust corporate balance sheets. Consequently, long-term corporate debt requires deeper credit analysis and generally demands a higher yield premium over risk-free government obligations.
Comparing Short-Term vs. Long-Term Bonds
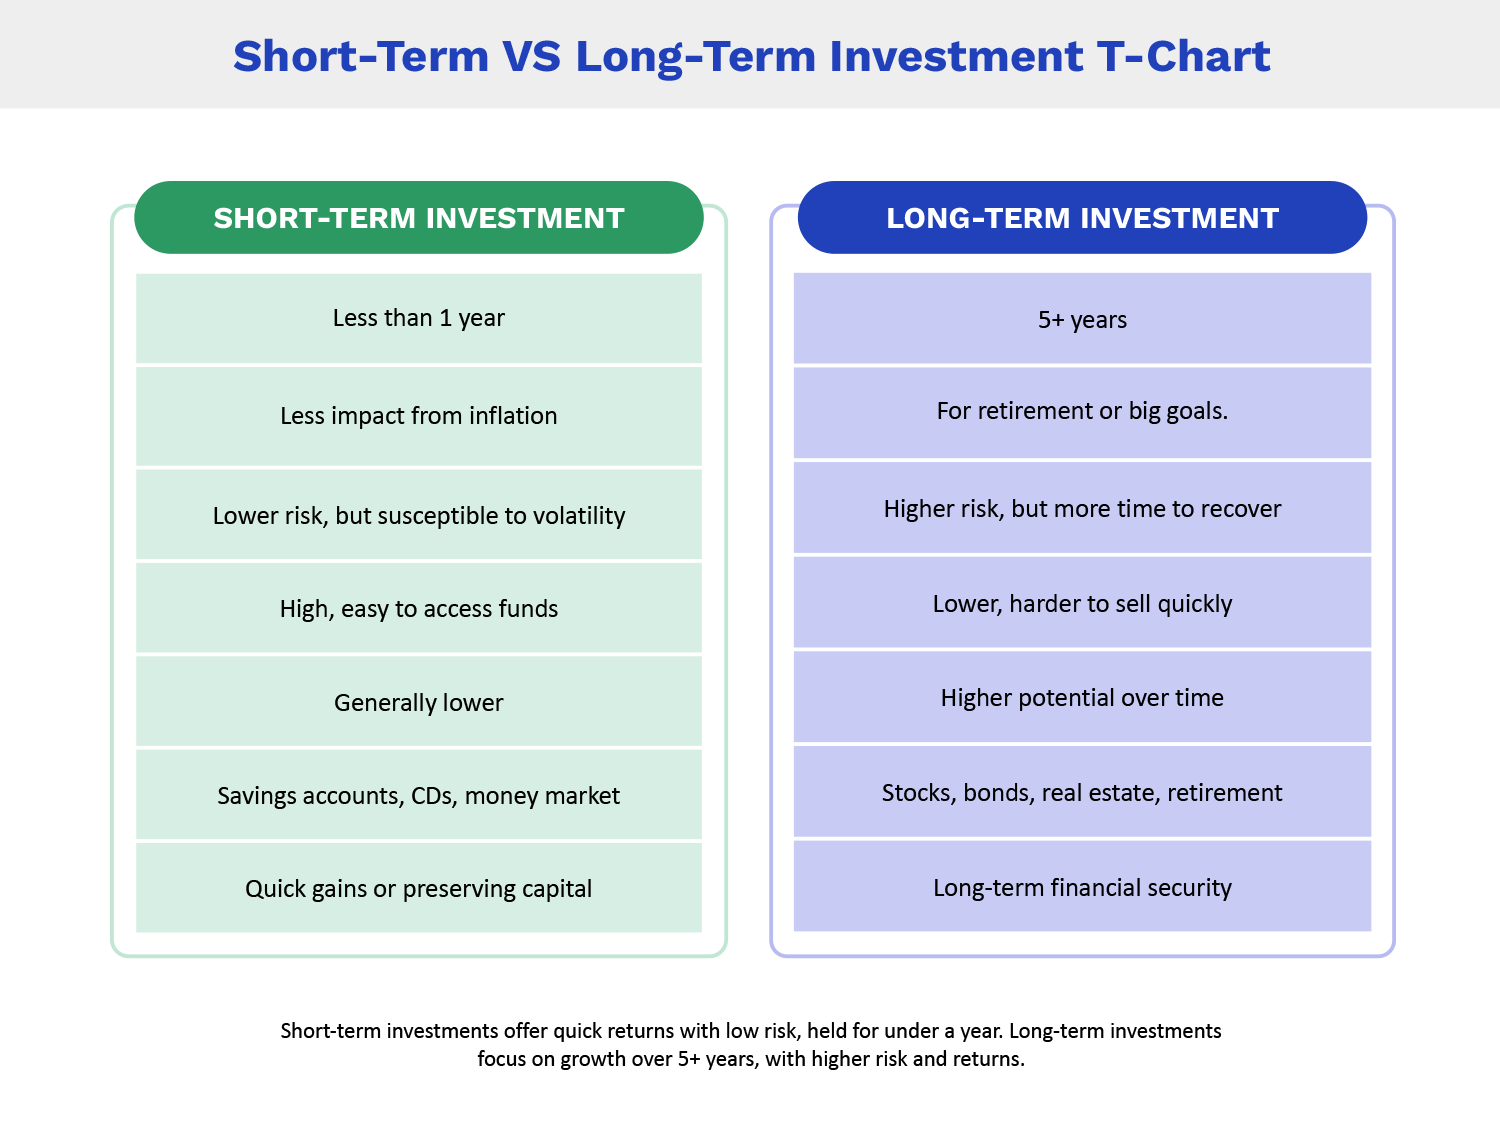
The table below contrasts the primary characteristics across short-term, intermediate-term, and long-term fixed-income instruments.
| Feature / Metric | Short-Term Bonds (0–3 Years) | Intermediate-Term Bonds (3–10 Years) | Long-Term Bonds (10–30+ Years) |
|---|---|---|---|
| Primary Goal | Liquidity & Capital Preservation | Balanced Growth & Steady Income | Maximum Long-Term Cash Flow |
| Price Volatility | Very Low | Moderate | High to Very High |
| Interest Rate Sensitivity (Duration) | Low (Typically < 3 years) | Moderate (Typically 3 to 7 years) | High (Often 12 to 20+ years) |
| Inflation Vulnerability | Low | Moderate | High |
| Typical Yield Level (Normal Curve) | Lower | Moderate | Higher |
| Reinvestment Risk | High (Must reinvest frequently) | Moderate | Low (Locks in yield for decades) |
| Primary Risk Factor | Reinvestment & Policy Rate Risk | Market & Benchmark Shifts | Inflation & Duration Risk |
Matching Bond Maturities to Financial Goals
Selecting the appropriate bond maturity requires matching the asset’s timeframe with your specific financial liability—a practice known in institutional management as asset-liability matching.
| Horizon | Target Goal | Ideal Bond Type |
|---|---|---|
| 0 - 3 Years | Emergency Fund, Down Payment | Short-Term |
| 3 - 10 Years | College Tuition, Major Home Renovation | Intermediate-Term |
| 10+ Years | Retirement Income, Estate Planning | Long-Term |
Short-Term Allocations: Liquidity and Immediate Expenses
If you require cash within one to three years—for a home down payment, a business purchase, or an emergency reserve—short-term bonds and money market instruments are generally appropriate. They shield capital from major market downturns while generating modest income.
- Trade-off: When rates fall, short-term bonds mature quickly, forcing you to reinvest at lower available yields (reinvestment risk).
Intermediate-Term Allocations: Core Wealth Accumulation
For financial objectives scheduled 3 to 10 years out, intermediate-term bonds offer a balance of return and stability. Financial planners frequently use intermediate bond funds as a central ballast in diversified portfolios to cushion against equity market volatility.
- Trade-off: They experience moderate price movements when central bank interest rates fluctuate, but their yields are typically higher than short-term instruments.
Long-Term Allocations: Secular Income and Liability Coverage
Long-term bonds suit investors who prioritize consistent cash flow over capital preservation and do not plan to access their principal for decades. Retirees seeking a predictable stream of coupon income, or institutions funding pension mandates, often utilize long-term bonds to lock in yield rates.
- Trade-off: Selling a long-term bond prior to maturity during a high-interest-rate environment can lead to significant capital losses on the secondary market.
Strategic Approaches to Managing Bond Maturities
Rather than selecting a single maturity length, sophisticated investors employ structured management strategies to balance liquidity, interest rate risk, and yield potential.
1. Bond Laddering
A bond ladder involves purchasing individual bonds with staggered maturity dates. For instance, an investor might allocate capital equally across bonds maturing in 1, 2, 3, 4, and 5 years.
Year 1 Maturity: Reinvest in Year 5
Year 2 Maturity: Holds Value
Year 3 Maturity: Holds Value
Year 4 Maturity: Holds Value
Year 5 Maturity: Locks in Long Yield
How it Works: As the 1-year bond matures, the returned principal is reinvested into a new 5-year bond at current market rates.
Benefits: This continuous cycle provides regular liquidity, reduces reinvestment risk, and averages out interest rate fluctuations over time. Detailed guidance on structuring bond holdings can be reviewed via the Financial Industry Regulatory Authority (FINRA).
2. Barbells and Bullets
- Barbell Strategy: Capital is split between short-term instruments (for liquidity and rate adjustments) and long-term bonds (for high yield), bypassing intermediate maturities entirely.
- Bullet Strategy: Multiple bonds are purchased at different times but configured to mature simultaneously in a single target year. This approach is often used to fund a specific future expenditure, such as a child's college tuition.
3. Individual Bonds vs. Bond Funds
It is important to distinguish between holding an individual bond and holding a bond mutual fund or ETF:
- Individual Bonds: Feature a fixed maturity date. If held to maturity (and assuming no issuer default), the investor receives 100% of the principal face value, regardless of market volatility during the holding period.
- Bond Funds: Maintain a target average duration by continuously buying and selling securities. Because bond funds rarely hold all underlying securities to maturity, they do not guarantee principal return on a specific date, leaving investors exposed to ongoing market price fluctuations.
For institutional regulatory frameworks regarding fund disclosure and bond safety, investors can refer to resources maintained by the U.S. Securities and Exchange Commission (SEC).
Frequently Asked Questions
What happens to a long-term bond's risk profile as it nears maturity?
As a long-term bond approaches its maturity date, its effective remaining term shortens, and its price volatility decreases. A 30-year bond issued 28 years ago now functions as a 2-year short-term bond. Its duration declines, making its market price far less sensitive to interest rate adjustments.
Is a 10-year Treasury note considered intermediate or long-term?
In most institutional and benchmark financial definitions, a 10-year Treasury note sits at the upper edge of intermediate-term debt. Maturities between 3 and 10 years are generally classified as intermediate, while obligations exceeding 10 years (such as 20-year and 30-year issues) are classified as long-term.
Do bond funds ever mature like individual bonds?
Standard open-end bond mutual funds and broad exchange-traded funds (ETFs) do not mature; they maintain a perpetual portfolio within a specific duration target. However, defined-outcome or "target-maturity" bond ETFs do mature in a designated year, distributing capital back to shareholders similarly to an individual bond.
Which maturity spectrum is best when central banks are raising rates?
When central banks raise policy rates to combat inflation, short-term bonds generally perform better than long-term bonds. Short-term issues experience minimal price erosion due to their low duration, and mature quickly enough to allow reinvestment into higher-yielding securities.
Why would an investor buy long-term bonds during an inverted yield curve?
Even when short-term yields exceed long-term yields, an investor might purchase long-term bonds to lock in income rates before expected economic slowing leads central banks to cut rates. If market yields fall across the board, long-term bonds experience the largest price appreciation, providing capital gains opportunities alongside yield protection.
Implementation Checklist for Bond Investors
To select the right bond maturity spectrum for your portfolio, consider taking these practical steps:
- Map Out Your Horizon: Identify exactly when you will need to withdraw your invested capital. Select maturities that match or precede those dates.
- Evaluate Your Duration Tolerance: Assess how much short-term fluctuation in principal value you can comfortably tolerate. If market drawdowns cause distress, tilt your portfolio toward shorter durations.
- Analyze the Prevailing Yield Curve: Review current yield curve data from TreasuryDirect or official central bank resources to determine whether you are being adequately compensated for taking on longer-term duration risk.
- Consider Structure: Decide whether individual bonds (which guarantee principal repayment at maturity if issuers do not default) or bond ETFs (which offer broad diversification and liquidity) best align with your strategy.