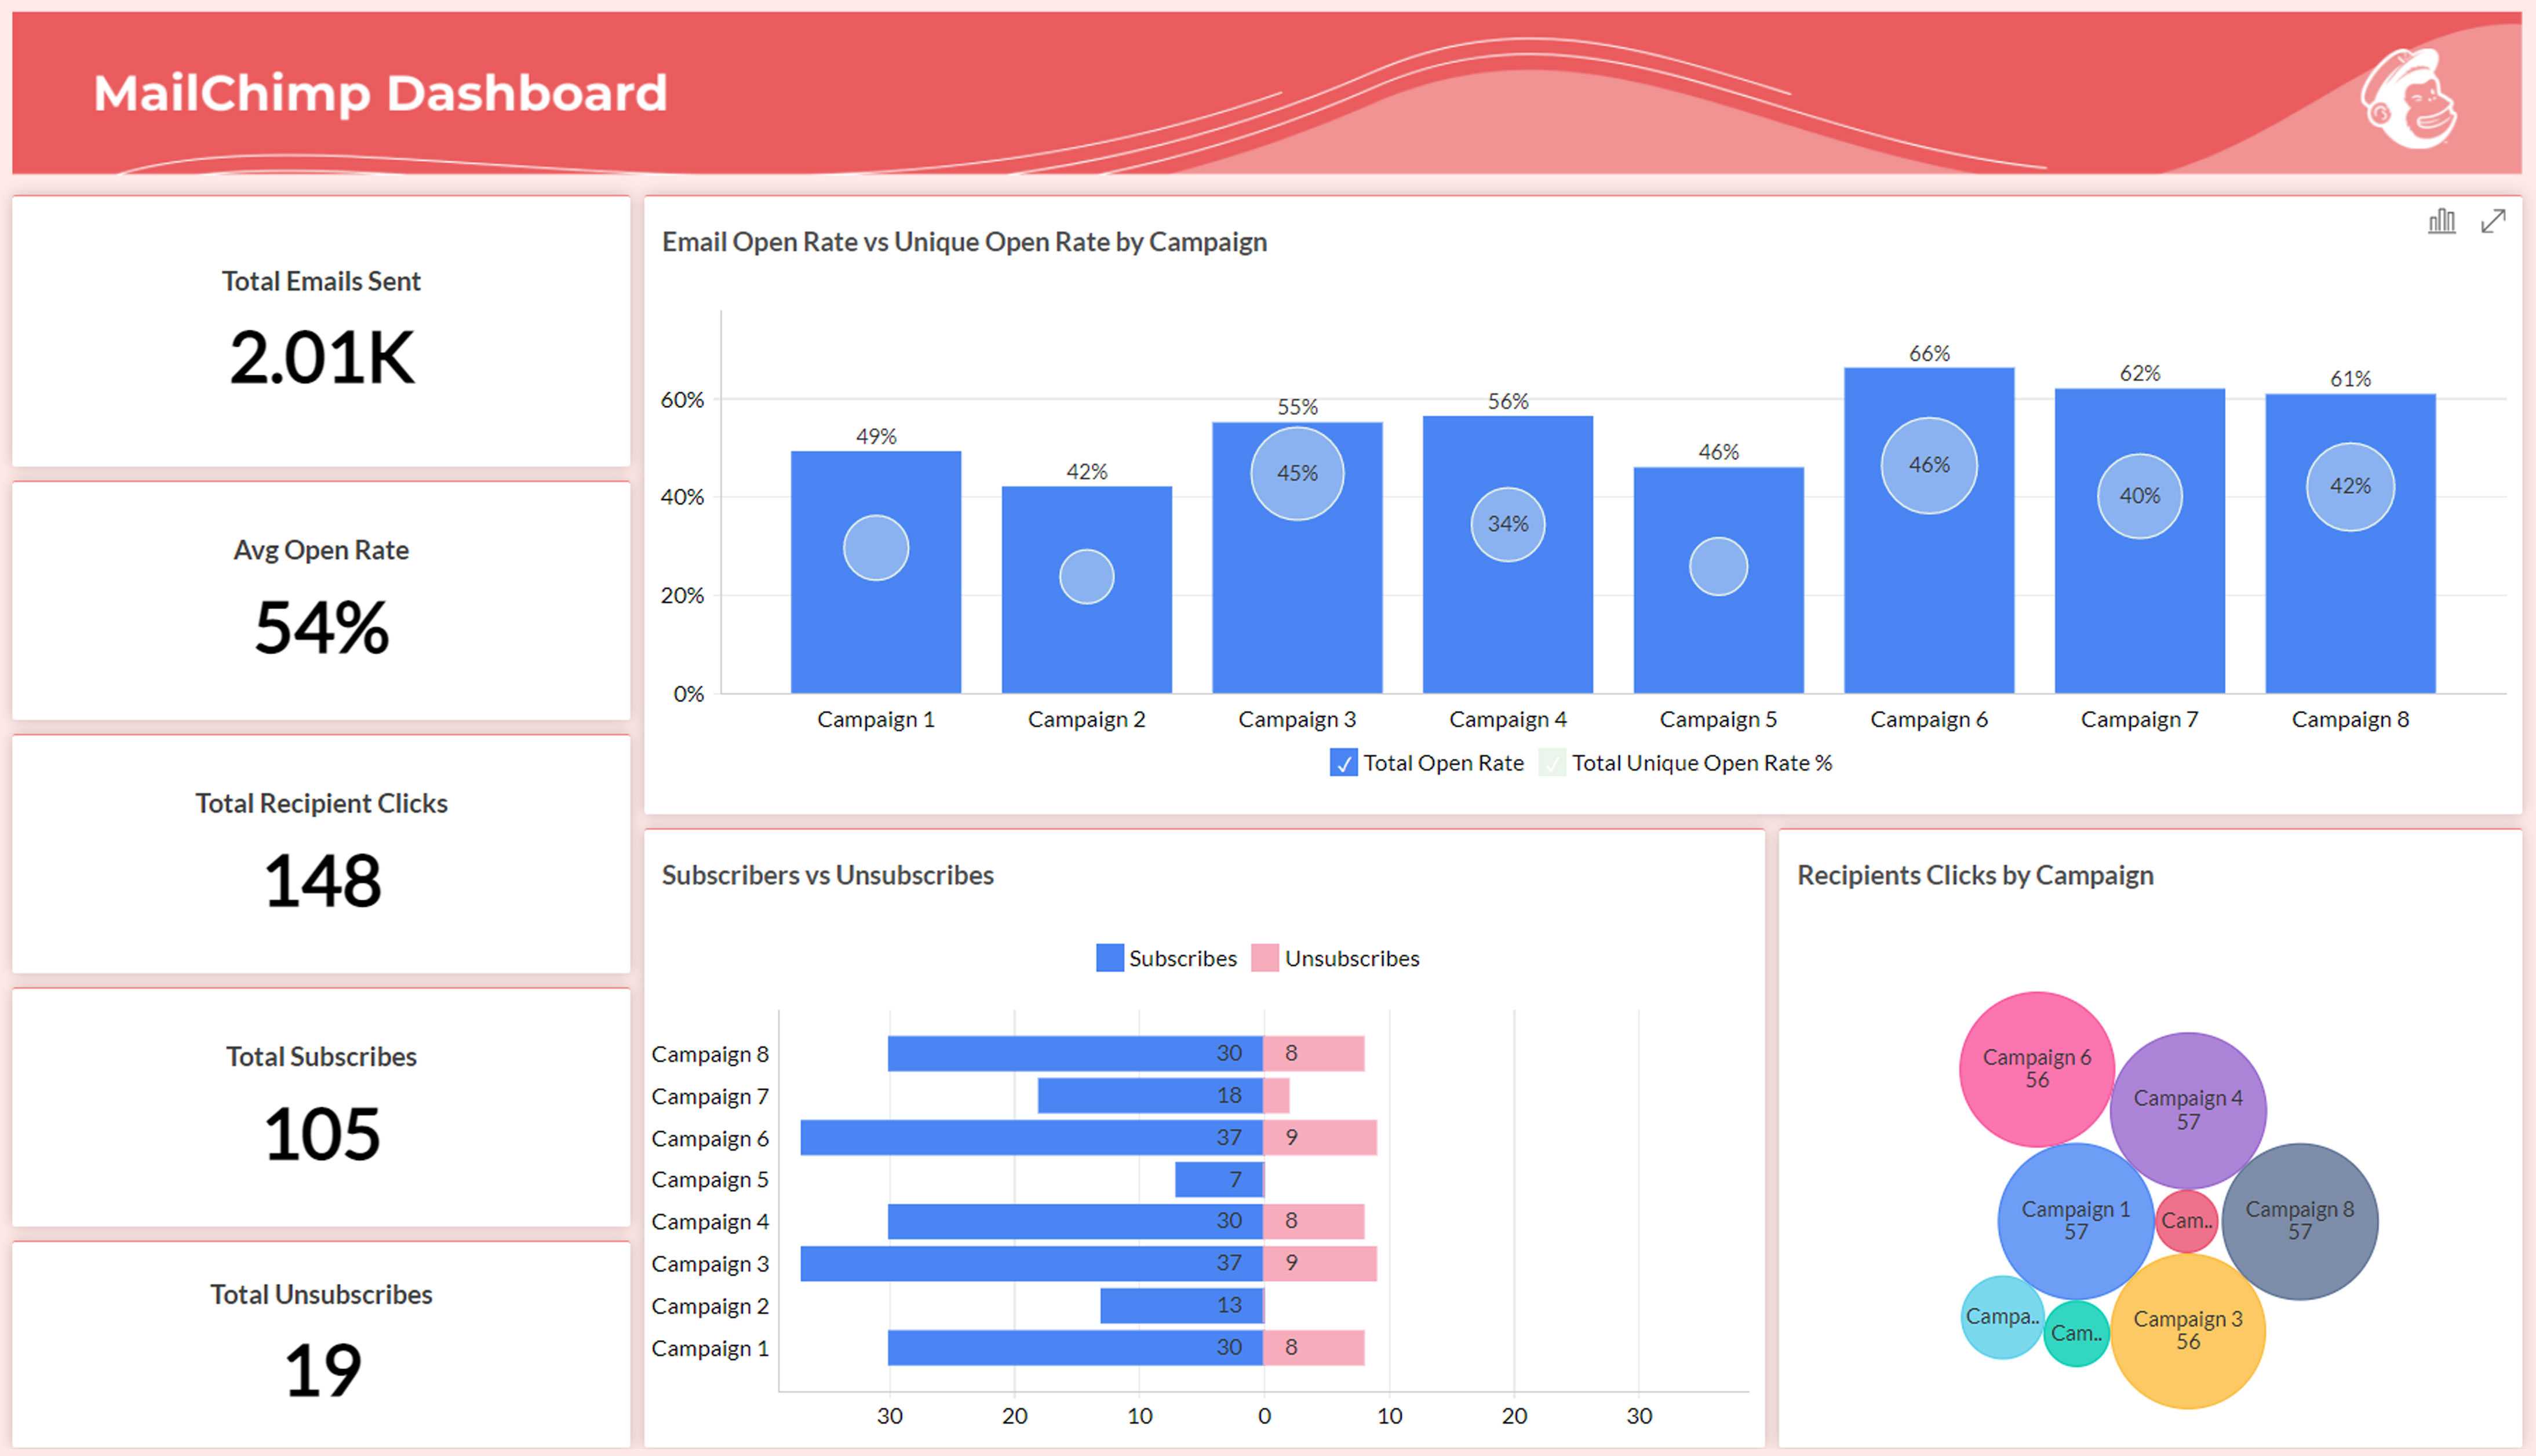
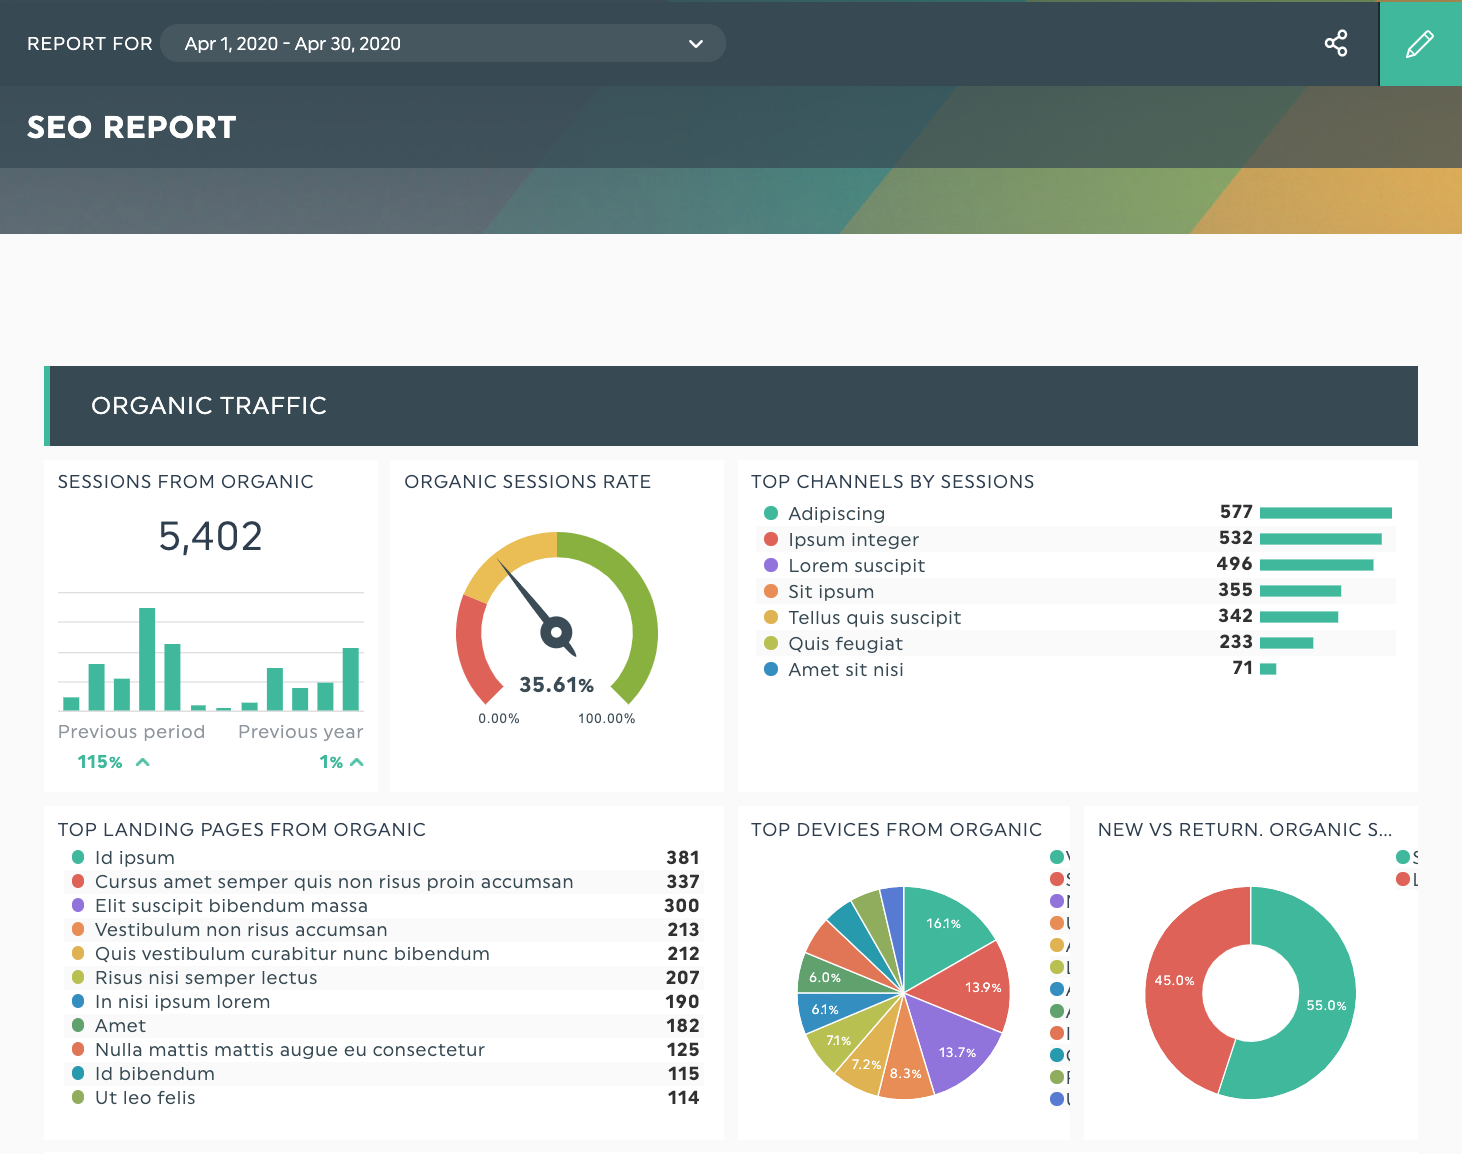
Analytics reporting tools serve as the essential bridge between raw data streams and actionable business intelligence, allowing organizations to visualize performance metrics, track key performance indicators (KPIs), and automate the distribution of insights. Choosing the right platform involves balancing technical integration capabilities, data security compliance, and the specific needs of end-users for real-time reporting.
Understanding the Landscape of Analytics Reporting Tools
Analytics reporting tools encompass a wide spectrum of software, ranging from lightweight, plug-and-play dashboarding applications to enterprise-grade business intelligence (BI) suites. Their primary purpose is to consolidate data from disparate sources—such as customer relationship management (CRM) software, website traffic logs, social media platforms, and financial databases—into a centralized, readable format.
In the current data ecosystem, these tools do not merely present static charts; they facilitate dynamic data exploration. A modern reporting tool must support data connectors (APIs) to external databases, automated report scheduling, and granular permission controls. For businesses operating in 2026, the shift is increasingly toward "self-service analytics," where non-technical stakeholders can build their own reports without constant intervention from data engineering teams.
Core Prerequisites for Analytics Deployment
Before selecting a tool, an organization must establish a robust data infrastructure. Without a "single source of truth," even the most expensive analytics platform will produce misleading insights.
- Data Governance and Hygiene: Before connecting an analytics tool, ensure your source data is clean. This involves removing duplicate records, standardizing naming conventions, and verifying that PII (Personally Identifiable Information) is handled according to regional data protection regulations like GDPR or CCPA.
- Define Primary KPIs: Avoid the trap of collecting "vanity metrics." A successful implementation begins by defining the specific business questions you need to answer. Are you tracking conversion rates, customer lifetime value, or operational uptime?
- Technical Compatibility: Audit your existing tech stack. If your data resides primarily in a specific cloud warehouse, such as Snowflake, Google BigQuery, or Amazon Redshift, verify that your chosen reporting tool provides a native, high-performance connector to that specific environment.
Comparing Analytics Reporting Categories
When selecting a tool, categorize your requirements based on the complexity of your data and the technical proficiency of your team. The following table highlights common categories of tools available as of 2026.
| Category | Primary User Persona | Best For | Technical Barrier |
|---|---|---|---|
| Business Intelligence Suites | Data Analysts, Engineers | Complex data modeling, deep SQL-based queries | High |
| Embedded Analytics | Product Managers, Developers | Adding dashboards directly into customer-facing apps | Very High |
| Marketing Dashboards | Marketing Managers | Quick visualization of ad spend and social media metrics | Low |
| Spreadsheet-Based BI | Financial Analysts | Familiar interface, rapid ad-hoc analysis | Medium |
Business Intelligence (BI) Suites
BI suites are the gold standard for organizations with high-volume data requirements. These tools support complex data transformations (ELT/ETL processes) and allow users to create sophisticated relationships between datasets. Because they often require knowledge of proprietary query languages or SQL, they are best suited for teams with dedicated data analysts.
Marketing and Specialized Dashboards
These tools are designed for speed and simplicity. They often provide pre-built templates for platforms like Google Ads, Meta Business Suite, or Shopify. The main advantage here is the reduction in "time-to-insight," as these tools typically offer "one-click" integrations that do not require an engineering team to maintain.
Common Challenges and Troubleshooting
Implementation rarely goes perfectly on the first attempt. Even with robust software, organizations frequently encounter "the reporting gap," where reports are generated but never used to drive strategy.
Data Latency Issues
If your stakeholders are making decisions based on reports that are 24 hours out of date, but your business moves in real-time, the tool is failing its purpose. Check your refresh settings. Most professional tools offer "Direct Query" options that pull data directly from the source rather than relying on cached extracts. If query speeds become too slow, you may need to optimize the database index rather than the report itself.
The "Too Many Cooks" Problem
When every department creates its own version of a "Sales Report," discrepancies arise. If the Marketing department uses one definition for "Lead" and the Sales department uses another, the data will never align. Establish a centralized data dictionary where metrics are defined at the organizational level to ensure consistency across all departments.
Security and Access Failures
Unauthorized access to sensitive data is a critical risk. Ensure that your reporting platform supports Role-Based Access Control (RBAC). This allows you to restrict sensitive financial data to the finance team, while providing operational staff with only the high-level metrics they need to perform their daily tasks. Regularly audit these permissions to ensure that former employees or transitioned staff no longer have access to proprietary data.
Strategic Selection Process
To select the right analytics reporting tool, follow this systematic evaluation process:
- Inventory Data Sources: List every platform where your data lives. Does your tool of choice integrate with all of them, or will you need middleware (such as Fivetran or Airbyte) to pipe data into a centralized warehouse first?
- Estimate Total Cost of Ownership (TCO): Do not look only at the per-seat subscription price. Consider the cost of data storage, the maintenance of API connections, and the training hours required to onboard your staff.
- Pilot Testing: Select one small, non-critical department to test the tool. Use this "sandbox" to see if the reporting interface is intuitive enough for non-technical users and if the customer support response times meet your expectations.
Frequently Asked Questions
What is the difference between an analytics tool and a reporting tool?
While often used interchangeably, "reporting" usually refers to the process of organizing data into summaries to monitor how a business is performing, whereas "analytics" involves deep-diving into that data to uncover patterns and answer "why" something happened. Most modern platforms now offer both capabilities.
How do I ensure my analytics data remains compliant with privacy laws?
Always prioritize tools that offer regional data residency options, allowing you to store data on servers located within your jurisdiction. Furthermore, ensure the tool supports automated data retention policies, which help you purge old data in compliance with your legal obligations.
Can analytics tools automate report delivery?
Yes. Almost all enterprise-grade reporting tools include a scheduling feature. You can configure the system to email PDF or interactive dashboard links to stakeholders on a daily, weekly, or monthly basis, often with built-in alerts if specific KPIs deviate from expected ranges.
Is it better to build an in-house reporting tool or buy a SaaS solution?
For 99% of organizations, buying a SaaS solution is more cost-effective. Building in-house creates a significant "technical debt," requiring constant engineering resources to maintain API integrations as third-party platforms update their code. Unless your core business is analytics software, lean toward established third-party solutions.
What should I look for in a tool’s support documentation?
Look for a robust developer portal, an active user community forum, and a detailed knowledge base with video tutorials. If a provider lacks transparent documentation, their platform will likely be difficult to troubleshoot when you encounter complex configuration requirements.
Final Recommendation
The most effective analytics reporting tool is the one that your team actually uses. Avoid selecting a platform based solely on a high feature count if it creates a steep learning curve that discourages adoption. Start by auditing your current data silos, define your non-negotiable KPIs, and prioritize platforms that offer intuitive user interfaces alongside powerful backend connectivity. For many mid-sized firms, beginning with a cloud-native dashboarding tool that integrates directly with existing CRM and ERP systems provides the best balance of speed, cost, and long-term scalability.