In 2017, the compensation gap between corporate leaders and typical employees reached a striking milestone, with the CEO-to-worker pay ratio hitting 312-to-1 according to prominent economic research. This figure highlights a sustained multi-decade divergence in executive remuneration and median employee earnings within major publicly traded corporations, serving as a critical data point for economists, policymakers, and labor analysts examining modern economic inequality.
Understanding the Economic Context of 2017 Executive Compensation
The year 2017 occupies a unique position in the ongoing discourse regarding corporate governance and wage distribution. To understand the significance of the 312-to-1 metric, one must examine how executive pay structures evolved in the decades leading up to 2017, driven by shifts in regulatory requirements, market philosophies, and corporate tax codes.
During the late 20th and early 21st centuries, executive compensation packages underwent a fundamental transformation. Rather than relying solely on base salaries, public corporations increasingly tied CEO pay to stock options, restricted stock units (RSUs), and performance-based equity incentives. This shift was designed to align the financial interests of executives with those of shareholders. However, as stock markets experienced historic bull runs following the 2008 financial crisis, the value of these equity grants surged dramatically, propelling overall CEO compensation figures upward at a pace far exceeding inflation or median wage growth.
Concurrently, median worker compensation remained largely stagnant across many sectors of the United States economy. Factors such as globalization, the decline of private-sector labor union density, technological automation, and changes in outsourcing models contributed to a flattened wage trajectory for production and nonsupervisory employees. By 2017, the compounding effect of these divergent trends produced a structural widening of the corporate pay gap, drawing intense scrutiny from institutional investors, academic researchers, and public policy advocates.
Methodologies Behind Measuring the CEO-to-Worker Pay Gap
Calculating a national or aggregate CEO-to-worker pay ratio requires standardized data collection and distinct methodological frameworks. The most widely cited figures regarding the 312-to-1 ratio for 2017 stem from the Economic Policy Institute (EPI), a labor-focused think tank that has tracked executive compensation trends for decades.
The Economic Policy Institute's Realized Compensation Measure
The EPI's methodology calculates the CEO-to-worker pay ratio using realized compensation. Realized compensation includes:
- Base salaries
- Bonuses
- Stock awards realized through vesting or exercise during the calendar year
- Non-equity incentive plan payouts
- Other forms of taxable compensation
This approach differs from granted compensation, which estimates the value of stock options and awards on the day they are issued rather than when they are actually cashed out. By focusing on realized compensation, researchers capture the actual financial gains executives secure, reflecting the true market value realized from soaring stock prices.
The Scope of Evaluated Corporations
To establish the 312-to-1 ratio for 2017, analysts evaluated the top 350 publicly owned firms in the United States by revenue. These firms span diverse industries, including technology, finance, healthcare, manufacturing, and retail. The median worker earnings within these specific firms are derived from data reported to the U.S. Bureau of Labor Statistics (BLS) through specific industry occupation classifications or, in subsequent years, via mandatory SEC disclosures.
Regulatory Milestones: The SEC Pay Ratio Rule
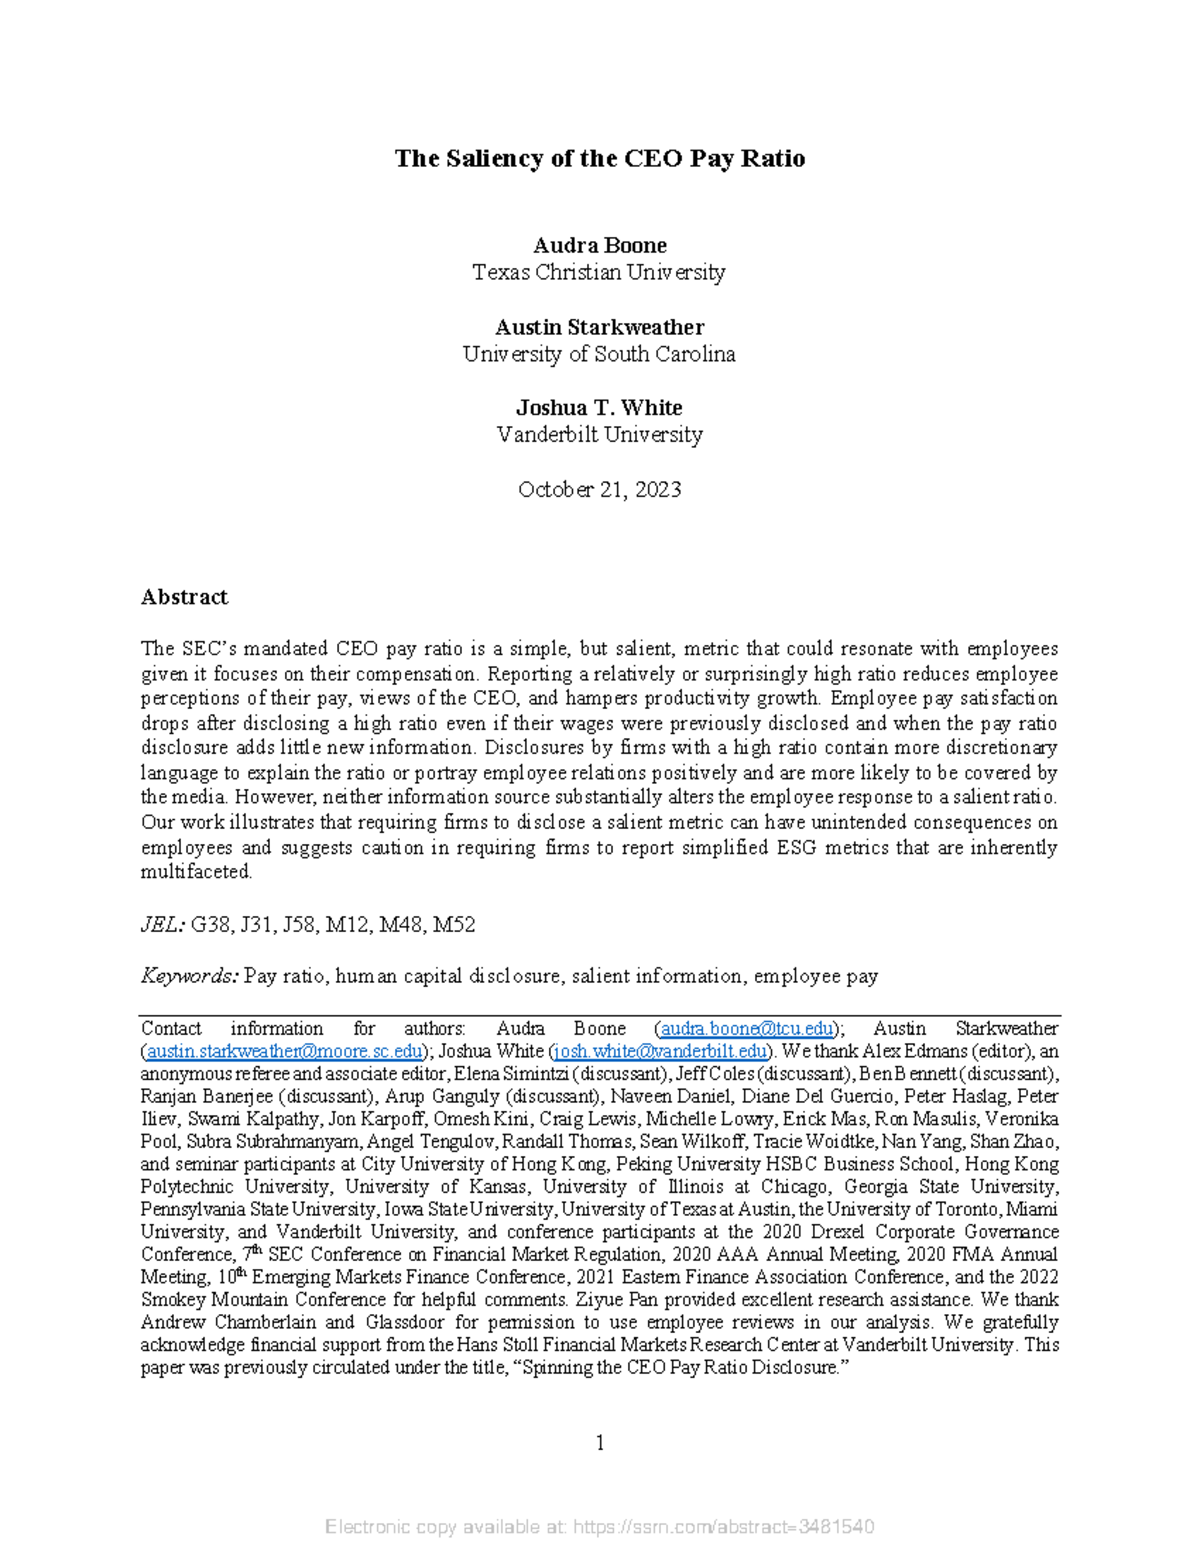
The year 2017 was also significant because it marked the implementation window for a major regulatory reporting requirement established by the Dodd-Frank Wall Street Reform and Consumer Protection Act of 2010. The U.S. Securities and Exchange Commission (SEC) adopted a rule requiring public companies to disclose the ratio of the compensation of their chief executive officer to the median compensation of all their employees.
While the SEC rule mandated disclosures for fiscal years beginning on or after January 1, 2017, many companies published their initial ratios in proxy statements released throughout 2018. This regulatory requirement provided researchers with unprecedented granular data regarding internal corporate wage structures. Previously, researchers relied on macro-level estimates and approximations; the SEC mandate required standardized calculations using internal payroll data, accounting rules, and full-time, part-time, seasonal, or temporary worker inclusion formulas.
Compliance Challenges and Disparities
When firms began calculating their internal ratios under the SEC guidelines, significant variances emerged across different business sectors:
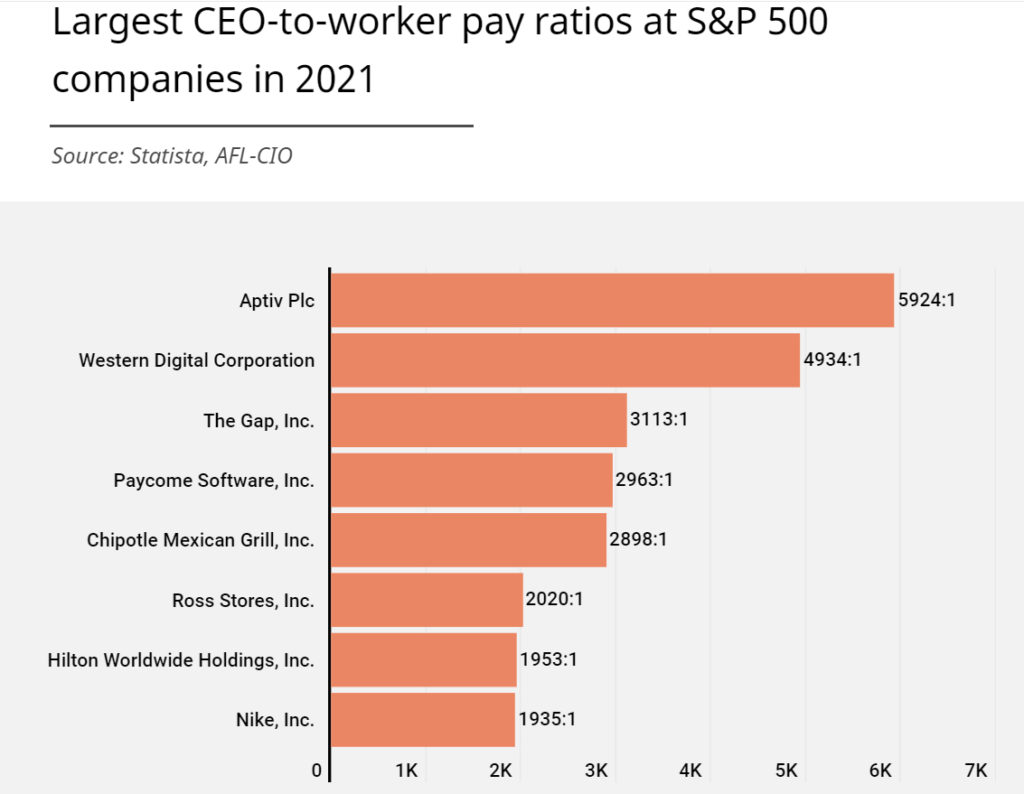
- Retail and Hospitality: Companies employing large numbers of part-time or hourly frontline workers frequently reported exceptionally high ratios, sometimes exceeding 1,000-to-1, because the median employee wage was low while executive pay remained competitive with other large corporations.
- Technology and Finance: While executive pay in these sectors was often extremely high, median worker compensation was also elevated due to specialized technical and professional roles, resulting in ratios that varied widely depending on the firm's reliance on outsourced or contract labor versus direct staffing.
Historical Comparison of Pay Ratios
To fully grasp the magnitude of the 312-to-1 ratio recorded in 2017, it is essential to review historical benchmarks. The pay gap has not always been at this scale; it has expanded significantly over the past half-century.
| Year / Period | Estimated CEO-to-Worker Pay Ratio | Primary Economic Context |
|---|---|---|
| 1965 | 20-to-1 | Post-war economic expansion, high union density, defined-benefit pension prevalence. |
| 1989 | 59-to-1 | Shift toward equity-based executive compensation and early deregulation waves. |
| 1995 | 123-to-1 | Acceleration of the dot-com stock market boom and widespread stock option grants. |
| 2000 | 344-to-1 (Peak) | Height of the dot-com equity bubble before subsequent market correction. |
| 2007 | 352-to-1 (Peak) | Pre-financial crisis peak driven by private equity and financial sector valuation. |
| 2017 | 312-to-1 | Post-financial crisis equity recovery and sustained corporate profit growth. |
As illustrated by historical data, the 312-to-1 ratio in 2017 represented a continuation of historically elevated levels established around the turn of the century, following the temporary dips that occurred in the immediate aftermath of the 2008 financial crash.
Economic Implications and Debate
The persistence of a 312-to-1 CEO-to-worker pay ratio generated considerable debate among economists, corporate governance experts, and social scientists regarding its broader implications for economic health and corporate performance.
Arguments Regarding Market Efficiency and Talent
Proponents of modern executive compensation structures argue that the market for top-tier managerial talent is global, highly competitive, and specialized. From this perspective, a CEO managing a multinational enterprise with hundreds of thousands of employees and billions of dollars in revenue makes decisions that directly impact shareholder value by orders of magnitude. Consequently, corporations argue they must offer multi-million-dollar compensation packages anchored in equity to attract and retain elite leadership capable of navigating complex global markets. Supporters maintain that high CEO pay is a symptom of market success rather than a cause of worker wage stagnation.
Arguments Concerning Inequality and Corporate Culture
Conversely, critics and labor economists argue that extreme pay disparities undermine employee morale, corporate culture, and broader economic stability. Research suggests that excessively high pay gaps can lead to reduced productivity, higher employee turnover, and a disconnect between executive leadership and frontline operational realities. Furthermore, critics point out that stock-based compensation can sometimes incentivize short-term stock price manipulation—such as aggressive share buybacks—rather than long-term capital investment in research, development, and workforce training.
Frequently Asked Questions
What does the 312-to-1 CEO-to-worker pay ratio mean?
It means that for every $1 earned by the median worker at major U.S. public corporations in 2017, the chief executive officer of that company earned $312 in total realized compensation, including salary, bonuses, and realized stock awards.
How was the 312-to-1 ratio calculated for 2017?
Researchers at the Economic Policy Institute calculated this figure by examining the compensation of CEOs and median workers across the top 350 publicly traded firms in the United States by revenue, utilizing realized compensation data from corporate filings and BLS occupational statistics.
Did the SEC require companies to report pay ratios in 2017?
Yes. The SEC mandate stemming from the Dodd-Frank Act applied to fiscal years beginning on or after January 1, 2017. While companies calculated their ratios based on 2017 data, many officially published these figures in their proxy statements during the 2018 proxy season.
Why is executive pay so much higher than median worker pay?
The divergence is primarily driven by the widespread adoption of equity-based compensation (such as stock options and RSUs) tied to stock market growth, combined with stagnant real wage growth for frontline, production, and nonsupervisory employees over several decades.
Are CEO-to-worker pay ratios higher in specific industries?
Yes. Industries with large numbers of part-time, hourly, or frontline service workers—such as retail, hospitality, and food service—tend to report much higher pay ratios because their median employee earnings are lower, even when executive pay is comparable to other sectors.
Practical Next Actions for Analysis and Research
For researchers, students, and professionals seeking to explore corporate governance and compensation trends further, several practical steps can be taken:
- Review SEC Filings: Access historical proxy statements (DEF 14A filings) via the SEC EDGAR database for specific publicly traded companies from 2018 onward to examine their disclosed pay ratio calculations and methodology notes.
- Examine Economic Reports: Consult archived studies from the Economic Policy Institute and reports from institutional investor advisory firms regarding executive compensation trends.
- Analyze Corporate Governance Guidelines: Study proxy advisory firm voting guidelines regarding say-on-pay proposals and executive compensation structures to understand how institutional shareholders evaluate CEO pay packages.