Sustained 100 system CPU usage occurs when your computer's central processing unit operates at its maximum capacity for an extended period, leading to severe slowdowns, unresponsiveness, thermal throttling, and potential system crashes. Diagnosing and resolving this issue requires identifying the underlying runaway processes, hardware bottlenecks, or background software malfunctions through systematic diagnostic tools and remediation steps.
Introduction to 100 System CPU Usage
When a computer experiences 100 system CPU usage, the operating system's kernel or specific user-space applications are consuming every available processing cycle. This means the CPU queue is completely saturated, leaving no spare capacity to handle new inputs from the user, background maintenance, or critical hardware communication. Users typically notice this phenomenon through sudden, extreme sluggishness, fans spinning at maximum velocity due to rising thermal loads, frozen user interfaces, and audio stuttering.
Resolving this state requires distinguishing between user-space application spikes and kernel-level system bottlenecks. Modern operating systems—such as Windows, macOS, and various Linux distributions—manage processing allocation through schedulers that distribute workloads across multiple cores. When all cores reach maximum utilization, or when a single core bottlenecks execution while others sit idle, the machine struggles to maintain basic stability.
Ambiguity often arises because the term "system" can refer generally to the entire computer or specifically to kernel-level operations (such as the System process in Windows Task Manager or the kernel_task in macOS). In either scenario, the root cause points to runaway execution threads, hardware driver loops, memory leaks spilling into processor-heavy paging, or malicious software. Addressing the problem demands a structured methodology: identifying the exact culprit, evaluating system load metrics, isolating the trigger, and applying targeted technical solutions.
Diagnostic Foundations: How to Identify CPU Bottlenecks
Before taking corrective action, you must accurately measure and locate the source of the high processor utilization. Operating systems provide built-in utilities designed to monitor performance metrics in real time. Knowing how to read these tools prevents guesswork and ensures you target the actual root cause rather than a symptom.
Windows Environments
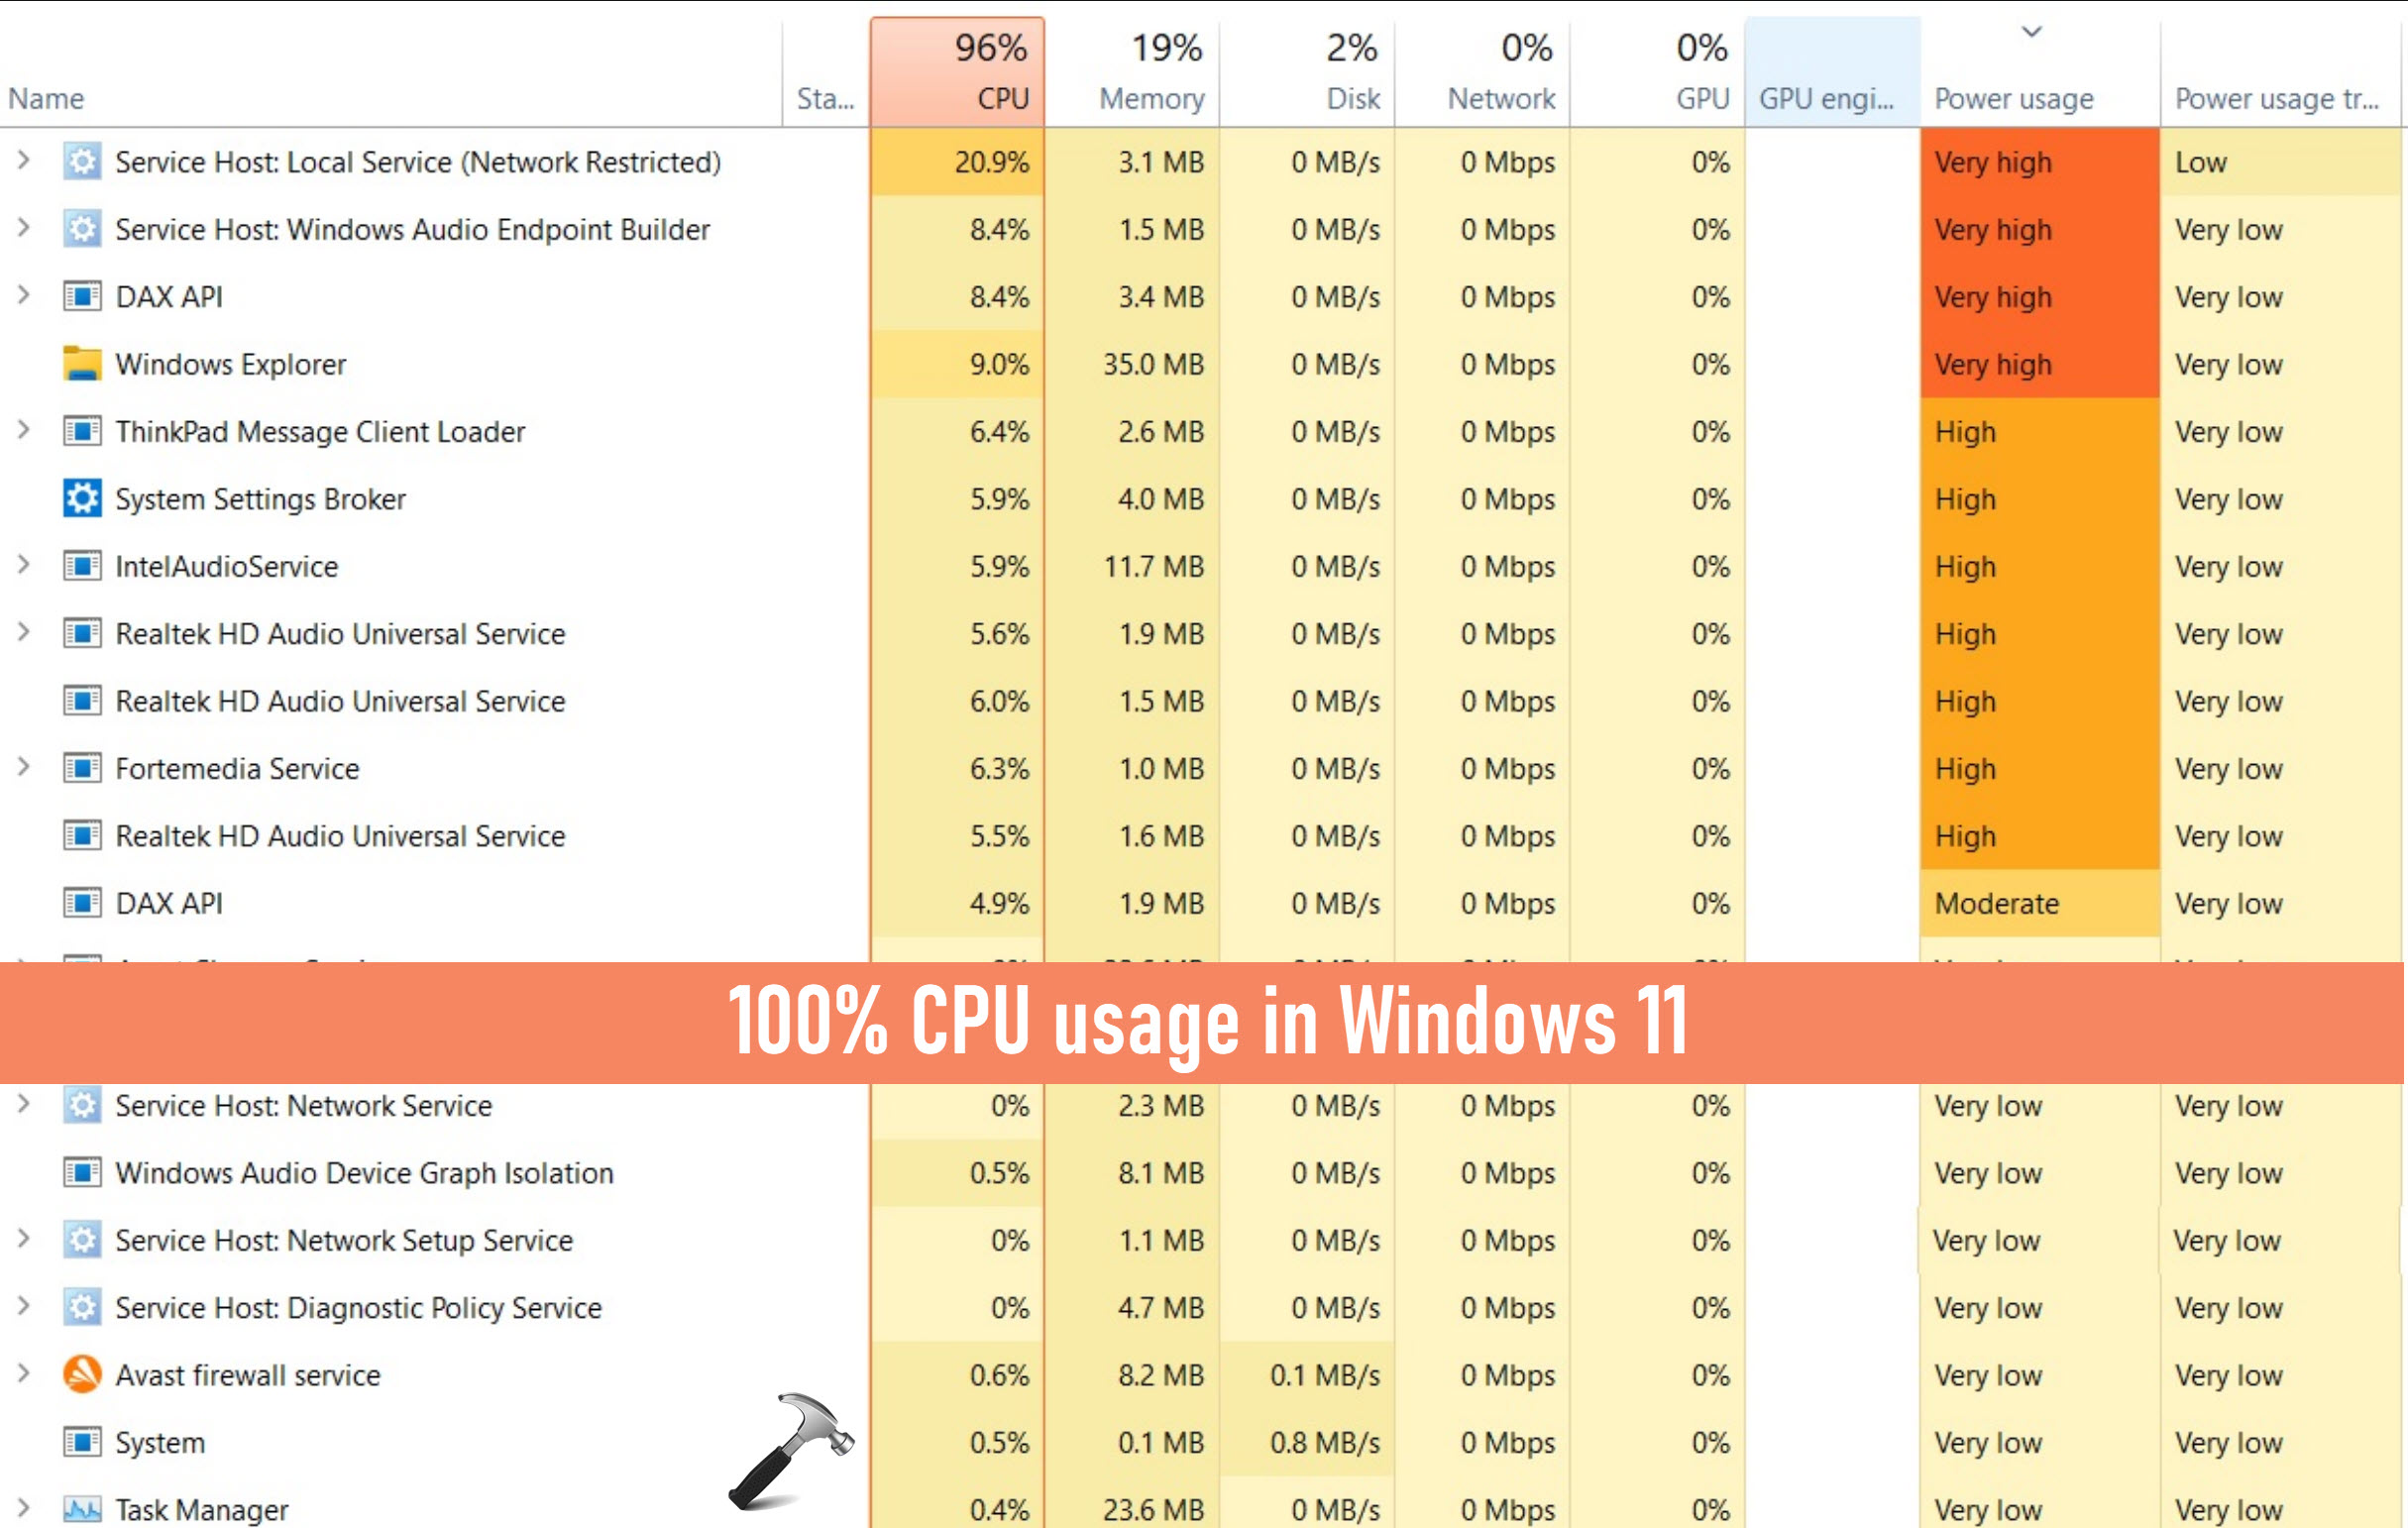
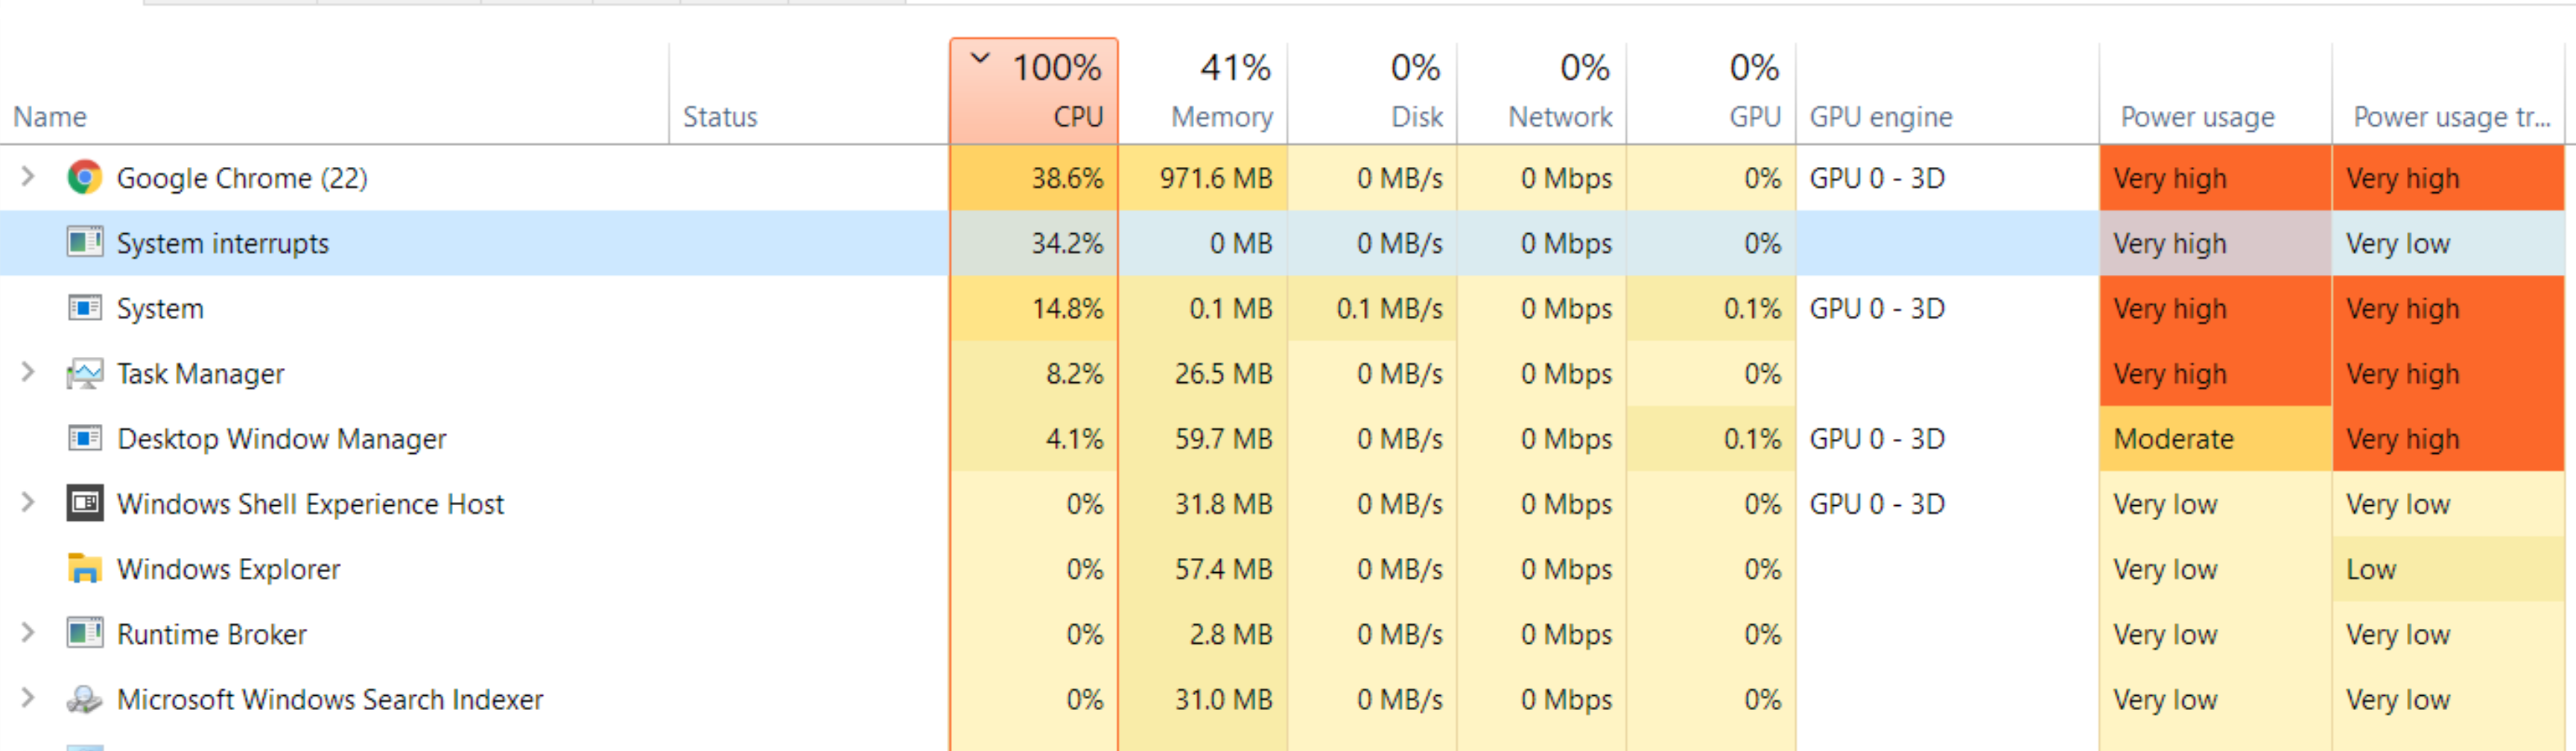
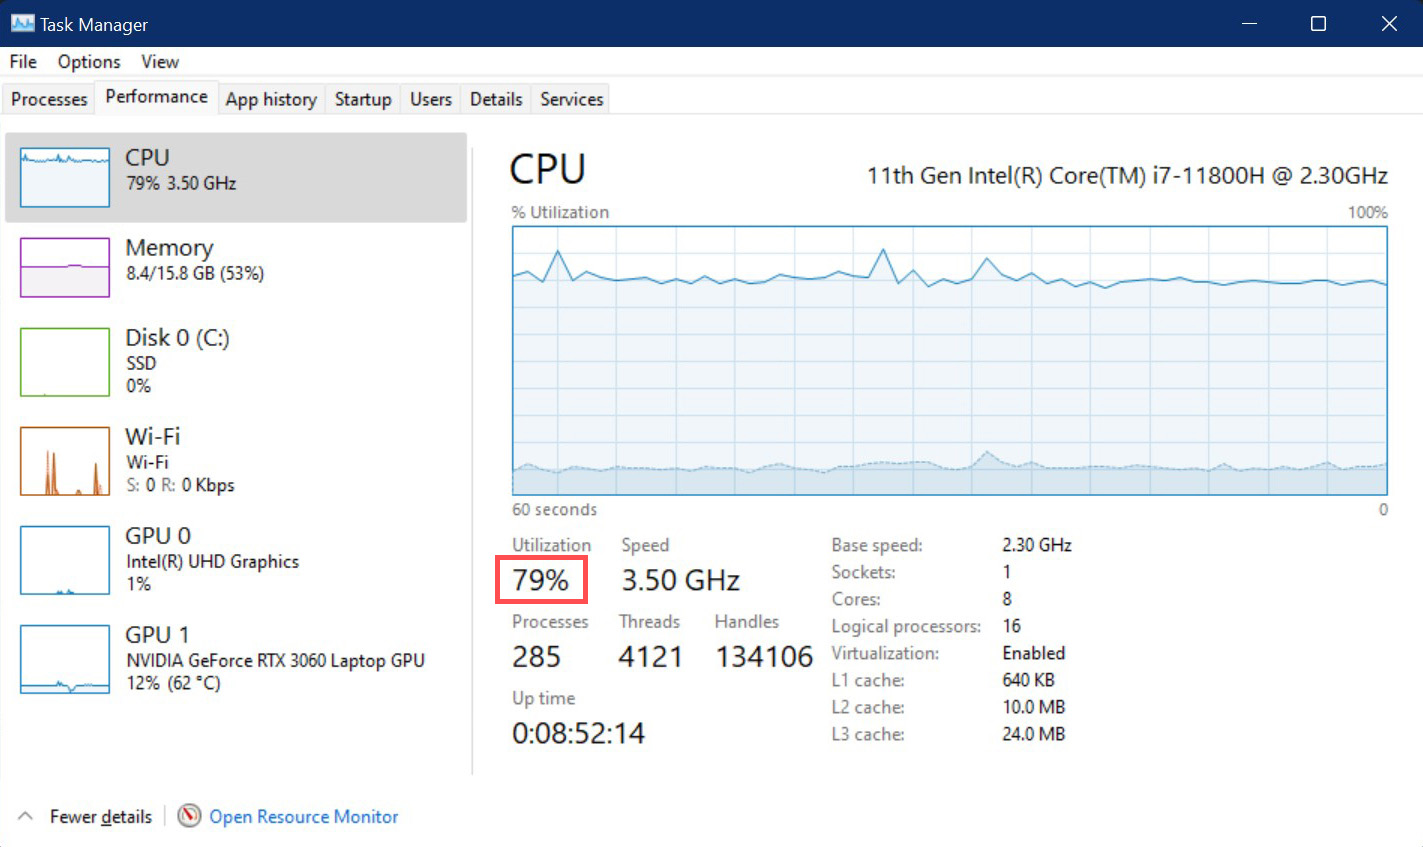
In Windows operating systems, the primary tool for diagnosing high resource consumption is Task Manager. You can access it by pressing Ctrl + Shift + Esc.
- Processes Tab: Sort the CPU column in descending order to see which applications or background services consume the most cycles. Look for non-system applications behaving erratically, or core processes like
System,Registry, orWMI Provider Host. - Performance Tab: Click on the CPU graph to view detailed hardware statistics, including base speed, utilization percentage, processes, threads, handles, and uptime. Notice whether utilization is pinned at 100% across all logical processors or if specific cores are maxed out while others remain underutilized.
- Resource Monitor: For advanced analysis, open the run dialog (
Win + R), typeresmon, and press Enter. The CPU tab here breaks down processes by associated services, handles, and real-time disk/network activity, which often correlates with processor spikes.
macOS Environments
For Apple hardware, the equivalent diagnostic suite includes Activity Monitor and the command-line utility top.
- Activity Monitor: Open via Spotlight or the Utilities folder. Select the CPU tab and click the
% CPUheader to sort processes from highest to lowest usage. The window also features a CPU Load graph at the bottom showing system, user, and idle percentages. - Terminal Utilities: Running the
topcommand orhtop(if installed via Homebrew) provides a granular, real-time look at individual thread behavior, allowing you to spot runaway daemons or stuck background processes immediately.
Linux Environments
Linux administrators rely on a robust suite of command-line tools to diagnose system strain.
topandhtop: These utilities display real-time processor statistics, categorized by user space (us), system space (sy), nice processes (ni), idle time (id), waiting for I/O (wa), and hardware/software interrupts (hi/si).vmstatandmpstat: These commands help determine whether the CPU bottleneck is driven by memory swapping, input/output wait states, or raw computational demand.
Common Causes of Maximum Processor Utilization
Understanding why a processor reaches maximum capacity helps prevent recurring incidents. The triggers range from minor software glitches to deep-seated hardware failures.
Runaway Background Services and Daemons
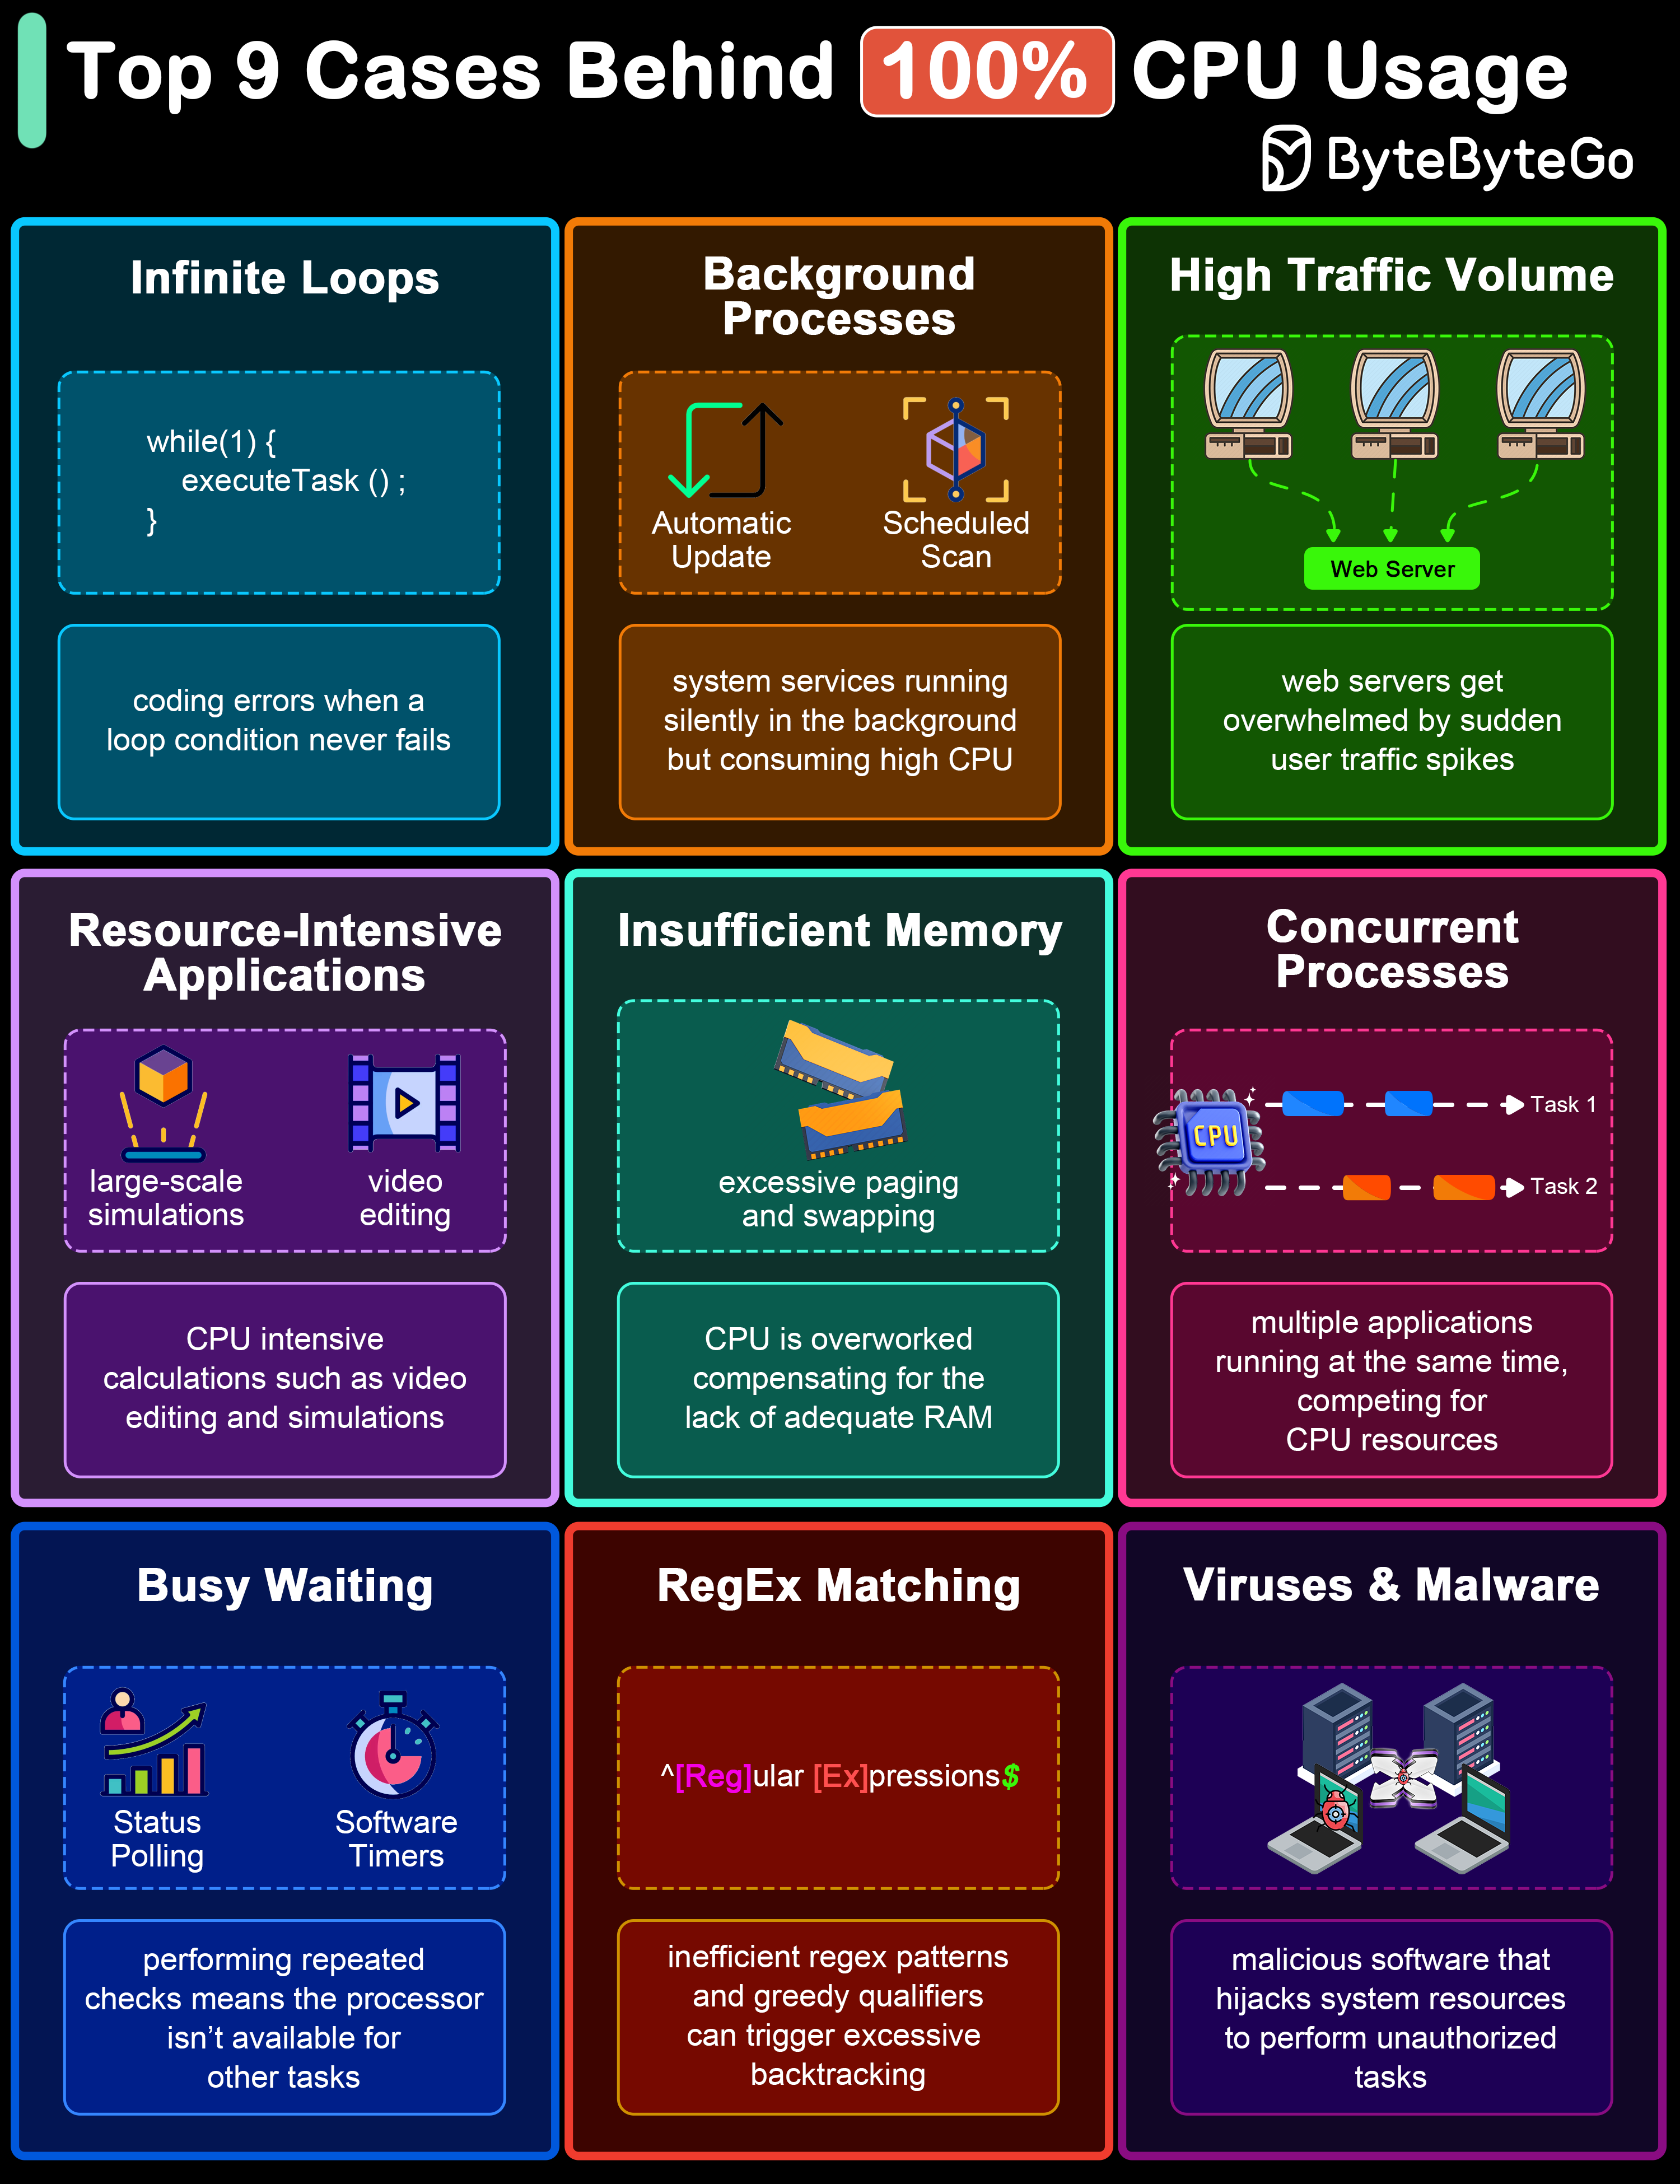
Software bugs frequently cause applications to enter infinite execution loops, consuming 100% of available CPU cycles. In Windows, services related to Windows Update (svchost.exe), Windows Defender, or third-party antivirus scanners occasionally glitch while indexing files or downloading patches. On Unix-like systems, runaway print queues, misconfigured database daemons, or backup utilities can silently overwhelm the processor.
Driver Failures and Interrupt Storms
Hardware communication relies on interrupts—signals sent to the CPU to request immediate attention. If a faulty network card, graphics driver, or storage controller enters an infinite loop of signaling, it creates an interrupt storm. In this state, the CPU spends almost all its time processing hardware interrupts (deferred procedure calls or DPCs), leaving virtually no capacity for standard applications.
Malware and Cryptojacking
Malicious actors frequently compromise systems to mine cryptocurrency in the background. Cryptojacking scripts and trojans are engineered to consume maximum available processing power without alerting the user through obvious interface disruption, though the resulting thermal output and fan noise usually give them away.
Thermal Throttling and Hardware Degradation
When a processor reaches maximum operating temperatures—often caused by failing cooling fans, dried thermal paste, or blocked ventilation—the system reduces clock speeds to prevent physical damage. This reduction in operating frequency severely lowers processing throughput, making even modest tasks push the system toward perceived 100% utilization.
| Diagnostic Tool | Operating System | Primary Metric Evaluated | Best Used For |
|---|---|---|---|
| Task Manager | Windows | Process CPU % and Thread count | Quick identification of runaway user apps and services. |
| Resource Monitor | Windows | Associated services, Handles, Disk I/O | Deep dive into system-level dependencies and file locks. |
| Activity Monitor | macOS | % CPU, kernel_task activity |
Spotting misbehaving applications and stuck Apple daemons. |
htop |
Linux / Unix | Core-by-core utilization, load averages | Advanced server monitoring and real-time process termination. |
Step-by-Step Troubleshooting and Remediation
When your system is frozen or operating at glacial speeds due to a 100% CPU load, executing a structured troubleshooting sequence restores functionality.
Step 1: Isolate and Terminate Rogue Processes
If the system is responsive enough to accept input, open your monitoring utility and locate the process driving the usage to maximum.
- For standard applications: Simply close the application normally. If it refuses to close, use End Task (Windows) or Force Quit (macOS).
- For system processes: Do not immediately terminate core operating system processes without understanding their function. For instance, ending
svchost.exeblindly can crash the operating system. Instead, research the specific service identifier (PID) or associated DLL to determine its origin.
Step 2: Investigate and Update Device Drivers
If diagnostic tools indicate high usage attributed to "System" or "System Interrupts," outdated or corrupted drivers are the primary suspects.
- Open Device Manager (Windows) or check system logs (Linux/macOS).
- Look for yellow warning triangles next to hardware components.
- Update network interface card (NIC) drivers, chipset drivers, and graphics drivers to the latest stable versions provided by the manufacturer. Avoid third-party driver update utilities, as they frequently install incorrect or bundled software.
Step 3: Manage Startup Applications and Background Bloat
Many programs configure themselves to launch automatically upon system startup, immediately consuming background resources.
- Windows: Open Task Manager, navigate to the Startup apps tab, and disable non-essential applications such as update checkers, third-party download managers, and chat clients.
- macOS: Go to System Settings > General > Login Items and remove unnecessary applications and background extensions.
Step 4: Scan for Malware and System Integrity Issues
If resource spikes persist after clearing startup items and updating drivers, run a comprehensive offline or deep system scan using reputable antimalware software. Additionally, verify operating system file integrity:
- On Windows, open Command Prompt as Administrator and run
sfc /scannowto repair corrupted system files. - On Linux, verify package integrity using your distribution's package manager verification tools (
dpkg -Vorrpm -Va).
Step 5: Address Thermal Management and Hardware Limits
If software fixes fail, inspect physical hardware conditions. Clean dust accumulation from heatsinks and cooling fans. Monitor CPU temperatures using hardware sensors (such as Core Temp, HWMonitor, or sensors on Linux). If idle temperatures exceed 60°C to 70°C, reapply thermal paste between the processor IHS and the cooler block, and ensure adequate case airflow.
Frequently Asked Questions
What does it mean when my CPU usage stays at 100%?
It means every available processing cycle within your central processing unit is actively consumed by one or more tasks. This leaves no computational overhead to process new mouse clicks, keyboard inputs, or background requests, causing the system to freeze or slow down drastically.
Can 100% CPU usage permanently damage my computer?
Modern processors feature built-in thermal protection mechanisms, such as thermal throttling and automatic thermal shutdown, designed to prevent catastrophic physical destruction. However, prolonged operation at extreme temperatures accelerates component wear and degrades thermal paste prematurely.
Why is the Windows System process using all my CPU?
The Windows System process encompasses kernel-mode threads, hardware drivers, and memory management routines. When it spikes to 100%, it is typically caused by a malfunctioning device driver, a corrupted paging file, or faulty hardware interrupts flooding the kernel.
How do I stop a frozen computer from staying at 100% CPU?
If the user interface is completely unresponsive, you may need to perform a hard reboot by holding down the power button for 5 to 10 seconds. Use this only as a last resort, as unsaved data will be lost. Upon reboot, immediately check system event logs to identify what triggered the freeze.
Does adding more RAM fix high CPU usage?
No. RAM (Random Access Memory) and CPU (Central Processing Unit) handle entirely different computing functions. While running out of RAM can cause heavy paging that indirectly increases CPU load, upgrading RAM alone will not resolve a processing bottleneck driven by heavy computational tasks or runaway software loops.
Conclusion and Recommended Next Actions
Encountering 100 system CPU usage disrupts workflow and signals an underlying software or hardware malfunction. By utilizing built-in diagnostic dashboards like Task Manager, Activity Monitor, or htop, you can isolate the specific thread or service responsible for the bottleneck. Follow a methodical approach: terminate runaway processes, update unstable drivers, eliminate unnecessary startup items, scan for malware, and ensure your physical cooling system is functioning properly. If software remediation fails to stabilize performance, audit your hardware components for thermal degradation or potential hardware failure.