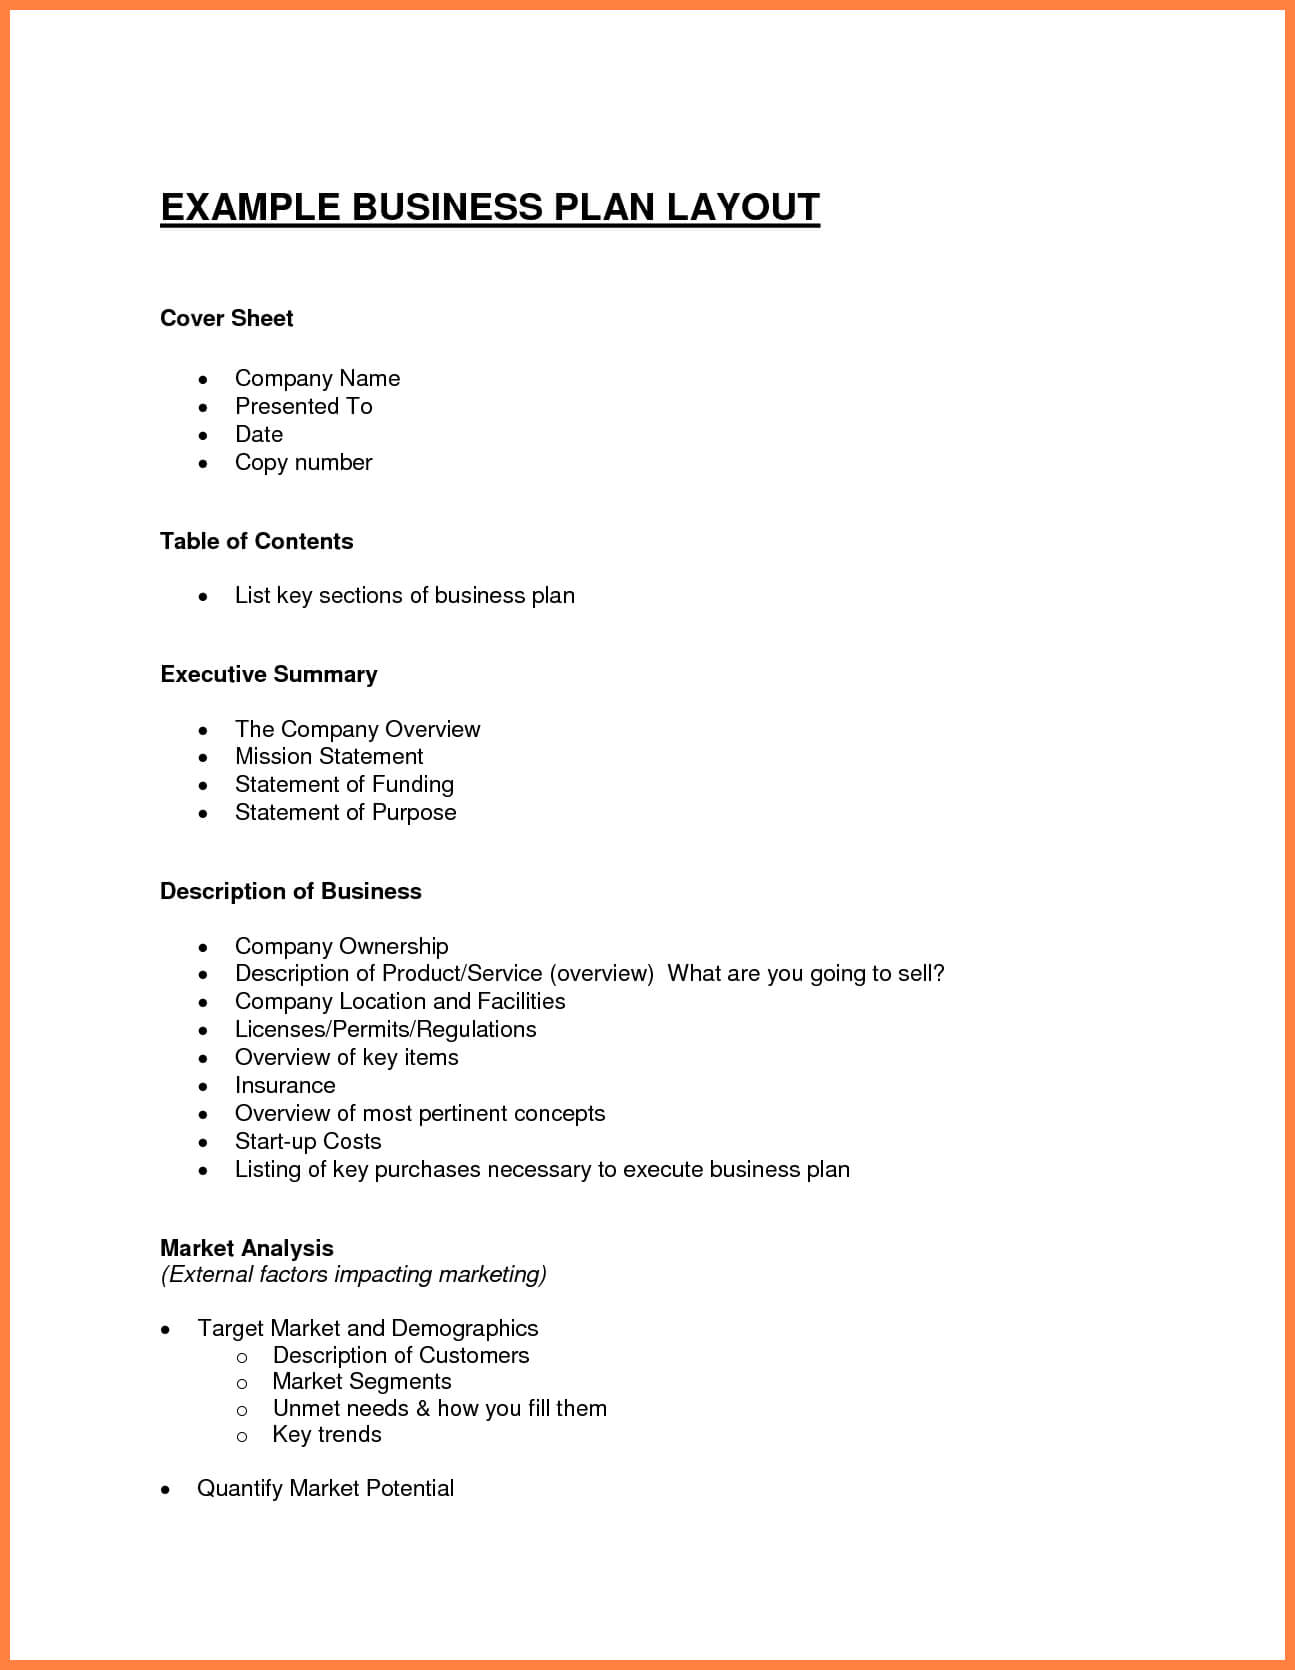
A business plan analysis evaluates the feasibility, strategic clarity, financial viability, and operational capability of a proposed or existing commercial project. It involves rigorously assessing market assumptions, financial projections, competitive positioning, operational timelines, and risk mitigation strategies to validate potential return on investment and organizational sustainability before committing capital or operational resources.
Core Objectives of Conducting a Business Plan Analysis
Performing a thorough analysis of a business plan is a vital prerequisite for capital allocation, strategic pivoting, and corporate governance. Whether conducted by venture capitalists, angel investors, commercial lending officers, corporate strategy teams, or entrepreneurs validating their own ideas, the process systematically strips away aspirational narrative to examine underlying commercial mechanics.
The primary objective is to separate realistic market opportunities from unsubstantiated assumptions. A well-constructed plan may present a compelling story, but rigorous analytical scrutiny exposes structural vulnerabilities, such as unviable unit economics, understated customer acquisition costs, or unrealistic operational milestones.
Business plan analysis serves distinct purposes depending on the stakeholder performing the evaluation:
- Equity Investors and Venture Capitalists: Focus primarily on scalabilities, total addressable market (TAM), competitive moats, leadership capability, expected internal rate of return (IRR), and realistic exit horizons.
- Commercial Lenders and Banks: Prioritize risk mitigation, debt-service coverage ratios (DSCR), cash flow stability, asset collateralization, and downside liquidity.
- Corporate Strategy Teams: Evaluate strategic alignment, operational synergies, resource allocation requirements, market expansion potential, and integration challenges.
- Founders and Management Teams: Conduct internal stress testing to identify strategic blind spots, refine resource requirements, calibrate pricing models, and establish measurable key performance indicators (KPIs) prior to launch.
The 6-Step Framework for Business Plan Analysis
An objective business plan evaluation requires a structured approach. Analyzing elements in isolation risks missing systemic flaws, such as a marketing strategy that contradicts the financial budget or operational capabilities that cannot support projected sales volumes.
- Executive Summary & Value Proposition Audit
- Market Analysis & Target Customer Assessment
- Operational & Management Capability Review
- Financial Model & Cash Flow Verification
- Risk Identification & Scenario Stress-Testing
- Strategic Alignment & Exit Horizon Evaluation
Step 1: Executive Summary & Value Proposition Audit
The executive summary outlines the business thesis. An effective analysis begins here to understand the core narrative, but immediately seeks evidence to support every assertion made in this introductory section.
Evaluators must determine whether the business solves an identifiable, acute pain point for a defined customer segment. The unique selling proposition (USP) must be clearly articulated rather than relying on broad buzzwords. If the executive summary fails to explain how the enterprise generates sustainable margin within two pages, the overall plan often lacks strategic focus.
Step 2: Market Analysis & Target Customer Assessment
Market analysis validation requires verifying the total addressable market (TAM), serviceable addressable market (SAM), and serviceable obtainable market (SOM). Evaluators must challenge top-down market sizing models (e.g., "capturing 1% of a $100 billion industry") and demand bottom-up calculations based on realistic pricing and target buyer volume.
Customer segmentation must define specific demographics, firmographics, and behavioral characteristics. The analysis assesses whether the value proposition aligns with proven buying behaviors, current macroeconomic conditions, and regulatory trends.
Step 3: Operational & Management Capability Review
Execution capability often dictates success more than strategy. Evaluating the operational plan involves reviewing supply chain mechanics, manufacturing partner dependencies, technology infrastructure, distribution channels, and compliance obligations.
The management review audits the track record, functional skills, and industry knowledge of key executives. Key questions include:
- Does the team possess past experience scaling similar ventures?
- Are there critical skill gaps in finance, technical development, or sales execution?
- Is the proposed organizational structure capable of supporting projected growth phases?
Step 4: Financial Model & Cash Flow Verification
Financial analysis forms the foundation of business plan evaluation. It requires auditing historical financial statements (if an existing business) and dissecting multi-year financial projections (income statement, balance sheet, and cash flow statement).
Evaluators must audit underlying driver assumptions rather than accepting net revenue figures at face value. This includes scrutinizing gross margins, operating expenses, working capital requirements, pricing power, and monthly cash burn rate. The core focus is verifying when the enterprise reaches cash-flow break-even and how much equity or debt capital is required to survive until that threshold.
Step 5: Risk Identification & Scenario Stress-Testing
A complete business plan explicitly identifies risks and outlines contingency plans. Analysts evaluate strategic, financial, operational, technological, regulatory, and macroeconomic vulnerabilities.
Stress-testing requires altering key assumptions—such as extending sales cycles by 50%, reducing gross margins by 15%, or doubling customer acquisition costs—to observe the impact on solvency. Plans that fail under mild stress reveal brittle business models.
Step 6: Strategic Alignment & Exit Horizon Evaluation
The final phase evaluates whether the plan aligns with stakeholder objectives and provides a viable path to liquidity or long-term dividends. Equity investors evaluate exit options, such as acquisition targets, secondary sales, or initial public offerings (IPOs), alongside historical transaction multiples in the sector. Commercial lenders verify that debt amortization schedules match projected operating cash flows.
Deep-Dive Component Analysis
Auditing Market Size and Competitive Moats
Evaluators must rigorously differentiate between top-down industry claims and realistic market capture. Standard frameworks evaluate competitive advantage through structural barriers to entry, often mapped using Michael Porter’s Five Forces: threat of new entrants, bargaining power of buyers, bargaining power of suppliers, threat of substitute products, and competitive rivalry.
- Competitive Moat
- Threat of New Entrants
- Power of Suppliers
- Power of Buyers
- Threat of Substitutes
A defensible competitive moat typically stems from one or more of four sources:
- Network Effects: The product or service increases in value as user adoption grows (e.g., two-sided marketplaces).
- Switching Costs: High technical, operational, or financial friction prevents customers from migrating to competitors.
- Cost Advantage: Proprietary process technology, exclusive supply access, or scale advantages that enable lower operational costs.
- Intangible Assets: Patents, regulatory licenses, strong brand equity, or trade secrets that legally block direct duplication.
Plans claiming competitive advantage based solely on "first-mover status" or "superior quality" without structural defensibility require immediate scrutiny.
Stress-Testing Financial Projections & Unit Economics
Evaluating financial projections requires isolating core unit economics. Gross margin and contribution margin metrics reveal whether a business model can scale profitably.
$$ \text{Customer Lifetime Value (LTV)} = \frac{\text{Average Revenue Per User (ARPU)} \times \text{Gross Margin %}}{\text{Churn Rate}} $$
$$ \text{LTV to CAC Ratio} = \frac{\text{Customer Lifetime Value}}{\text{Customer Acquisition Cost}} $$
Key unit economic benchmarks to evaluate during analysis include:
- LTV to CAC Ratio: A healthy benchmark for software-as-a-service (SaaS) and subscription models is generally $3:1$ or higher. Ratios below $1:1$ indicate unsustainable growth, where expanding marketing burns cash without generating enterprise value.
- CAC Payback Period: The time required to recover the cost of acquiring a customer. Lower payback periods (typically under 12 months for B2B ventures) reduce working capital requirements.
- Burn Multiple: Calculated as Net Burn divided by Net New Annual Recurring Revenue (ARR). A burn multiple above 2.0x signals inefficient capital allocation.
- Gross Margin Viability: High-margin models (70%+) offer flexibility to absorb operational errors, whereas low-margin models (under 20%) require flawless operational execution and high volume.
Scrutinizing Operational Realities & Supply Chain Vulnerabilities
An unviable operational strategy can derail strong demand. Business plan analysts must map the fulfillment sequence from supplier procurement to end-customer delivery.
Evaluators should check for single-point-of-failure vulnerabilities, such as reliance on a single contract manufacturer, exclusive reliance on a single advertising channel, or unverified regulatory compliance pathways. The plan should account for inventory holding costs, supply chain lead times, working capital buffer requirements, and quality control procedures.
Quantitative vs. Qualitative Evaluation Matrix
Evaluating a business plan requires balancing narrative quality with numerical validation. The table below outlines key evaluation parameters across core domains:
| Domain | Qualitative Evaluation Parameters | Quantitative Benchmark / Metric | Red Flags to Flag Immediately |
|---|---|---|---|
| Market Potential | Clear problem definition, ideal customer profile (ICP), favorable regulatory tailwinds. | TAM/SAM/SOM validation, CAGR, customer interview validation metrics. | Top-down TAM capture claims without bottom-up channel math. |
| Competitive Position | Proprietary IP, high switching costs, clear moat defense strategy. | Market share %, pricing power elasticity, NPS / Retention rates. | Claiming "no competitors exist" or ignoring indirect substitutes. |
| Management Capability | Functional domain expertise, history of execution, balanced leadership skill sets. | Founder equity vesting split, team key hire retention rate, previous exit track record. | Key functional leadership missing (e.g., tech start-up without technical co-founder). |
| Unit Economics | Clear monetization strategy, repeat purchase behavior, pricing strategy clarity. | LTV/CAC ratio ($\ge 3:1$), CAC payback ($< 12$ mos), Gross margin $%$. | LTV calculated without accounting for customer churn or cost of goods sold (COGS). |
| Financial Projections | Realistic revenue drivers, clear cash allocation strategy, contingency planning. | DSCR ($\ge 1.25x$), Net burn rate, Runway ($18-24$ mos minimum post-funding). | "Hockey-stick" revenue growth paired with static or declining sales expense. |
| Operations & Risk | Supply chain redundancies, regulatory compliance pathways, asset scalability. | Working capital cycle days, supplier concentration %, disaster recovery SLA. | Sole-source supplier dependency without contractual backup SLA. |
Red Flags and Common Pitfalls in Business Plan Analysis
Identifying structural flaws early prevents bad investment and management decisions. During business plan review, analysts should watch for these common issues:
Overly Optimistic "Hockey-Stick" Projections
Financial forecasts showing flat short-term growth followed by steep, exponential revenue expansion with flat operating expenses are common. Analysts must verify that scaling customer volume accounts for proportional increases in customer support, sales headcount, server infrastructure, and working capital.
Revenue Projection Reality Check
- Exponential Narrative (Red Flag):
- Revenue: Unrealistic margin expansion over time
- Cost: Static expenses (unrealistic over time)
- Operational Reality (Validated):
- Revenue: Grows over time
- Cost: Scales alongside revenue growth over time
Unrealistic Customer Acquisition Costs (CAC)
Plans often assume low acquisition costs based on "viral marketing" or organic social traffic. In mature markets, paid search, targeted outreach, and field sales teams represent real, rising expenses. CAC estimates must reflect competitive ad auctions and true sales force commission structures.
Ignored Indirect Competition
Founders frequently state that they face no direct competition. Every business competes for customer budgets or alternative workarounds. An analyst must identify non-consumption options, manual processes, and legacy software that act as substitutes.
Underestimating Working Capital Requirements
Revenue growth often drains cash before generating profit. Expanding accounts receivable and inventory inventories consume cash faster than profits accrue. Plans that focus solely on net income while ignoring balance sheet cash cycles often run out of money during high-growth phases.
Essential Tools and Methodologies for Business Plan Evaluation
Strategic and financial frameworks provide objective structure when performing business plan analysis.
Strategic Auditing: SWOT and PESTLE Analysis
Combining internal and external evaluation frameworks provides comprehensive analysis:
- SWOT Analysis (Internal Focus): Evaluates internal Strengths (patents, team), Weaknesses (limited capital, brand awareness gaps), external Opportunities (expanding adjacent markets), and Threats (new entrants, platform shifts).
- PESTLE Framework (External Focus): Scrutinizes Political, Economic, Sociocultural, Technological, Legal, and Environmental macro factors that could disrupt business assumptions over a 3- to 5-year timeline.
Financial Auditing: Discounted Cash Flow (DCF) & Sensitivity Analysis
To evaluate financial return, analysts perform Discounted Cash Flow modeling to estimate the net present value (NPV) of future cash flows:
$$ \text{NPV} = \sum_{t=1}^{n} \frac{\text{Free Cash Flow}_t}{(1 + r)^t} - \text{Initial Investment} $$
Where $r$ represents the discount rate (Weighted Average Cost of Capital or targeted hurdle rate) and $t$ represents the time period.
Sensitivity tables should vary two core inputs simultaneously—such as pricing discount rates versus customer churn—to determine the threshold where NPV becomes negative.
Sensitivity Analysis Matrix: Net Present Value (NPV) Impact
Customer Churn Rate (Monthly)
| Price Discount | 1.0% | 2.0% | 3.0% | 4.0% |
|---|---|---|---|---|
| 0% | +$4.2M | +$2.8M | +$1.1M | -$0.4M |
| 5% | +$3.1M | +$1.7M | +$0.2M | -$1.2M |
| 10% | +$1.9M | +$0.5M | -$0.9M | -$2.1M |
| 15% | +$0.6M | -$0.8M | -$2.1M | -$3.5M |
Note: Negative values represent unviable parameter combinations.
Risk Modeling: Monte Carlo Simulations
For high-capital projects, analysts run Monte Carlo simulations. By applying probability distributions to variable inputs (such as raw material costs, conversion rates, and sales cycles), computer models run thousands of scenarios to estimate the probability of achieving target returns or running out of capital.
Legal and Financial Disclaimer
Disclaimer: This guide is for educational, strategic, and analytical purposes only and does not constitute formal financial, investment, accounting, or legal advice. Financial valuation, capital allocation, and business evaluation require professional assessment tailored to specific jurisdictional statutes, corporate structures, and market conditions. Consult certified public accountants (CPAs), chartered financial analysts (CFAs), or corporate attorneys before executing financial transactions or investment decisions.
Frequently Asked Questions
What is the difference between a business plan analysis and a feasibility study?
A feasibility study is conducted before creating a business plan to determine whether an idea is viable technically, economically, and legally. A business plan analysis evaluates a fully developed plan to assess operational strategies, market positioning, execution risks, and financial returns before capital deployment.
How long should an effective business plan analysis take?
A preliminary strategic review of an executive summary and financial overview typically takes 2 to 4 hours. A comprehensive diligence review—including financial model audit, customer interviews, competitor analysis, and risk stress-testing—generally requires 10 to 30 business days, depending on corporate complexity and industry.
What is the most critical section to analyze in a business plan?
While all sections are interconnected, the financial model (specifically cash flow projections and unit economics) combined with management team capability represent the most critical areas. A business with strong demand will fail if unit economics are negative or management lacks execution capability.
How do you evaluate a business plan with no historical financial data?
When analyzing pre-revenue ventures, focus on validating unit economics, bottom-up market calculations, proxy benchmark comparisons from comparable companies, and direct customer validation tests. The analysis shifts from auditing historical financial statements to testing core driver assumptions.
What tool is best for stress-testing financial assumptions in a business plan?
Financial modeling software and robust spreadsheet platforms (such as Microsoft Excel or Google Sheets using Data Tables and Scenario Manager) are standard for sensitivity and scenario stress-testing. Specialized platform solutions like Monte Carlo simulation add-ins provide advanced probabilistic risk modeling.
Next Actions: Implementing Your Business Plan Review
To conduct an actionable business plan analysis, follow this operational checklist:
- Establish Clear Evaluation Criteria: Define your target investment parameters, required hurdle rate (IRR), acceptable payback timelines, and risk tolerance thresholds prior to reading the proposal.
- Verify Primary Assumptions: Contact potential customers, industry experts, suppliers, and regulatory advisors to validate pricing assumptions, sales cycle lengths, and fulfillment complexities independently.
- Audit the Spreadsheet Calculations: Never review static financial tables in isolation. Demand access to the underlying dynamic financial model to verify formula integrity, variable links, and driver logic.
- Run Downside Sensitivity Scenarios: Test how cash runways alter if revenue growth hits only 50% of target, gross margins drop by 10%, or operational launches encounter 6-month regulatory delays.
- Synthesize Findings into an Actionable Memo: Consolidate your analysis into an executive memo highlighting core value drivers, structural risks, unverified assumptions, and mandatory conditions precedent required before committing resources.