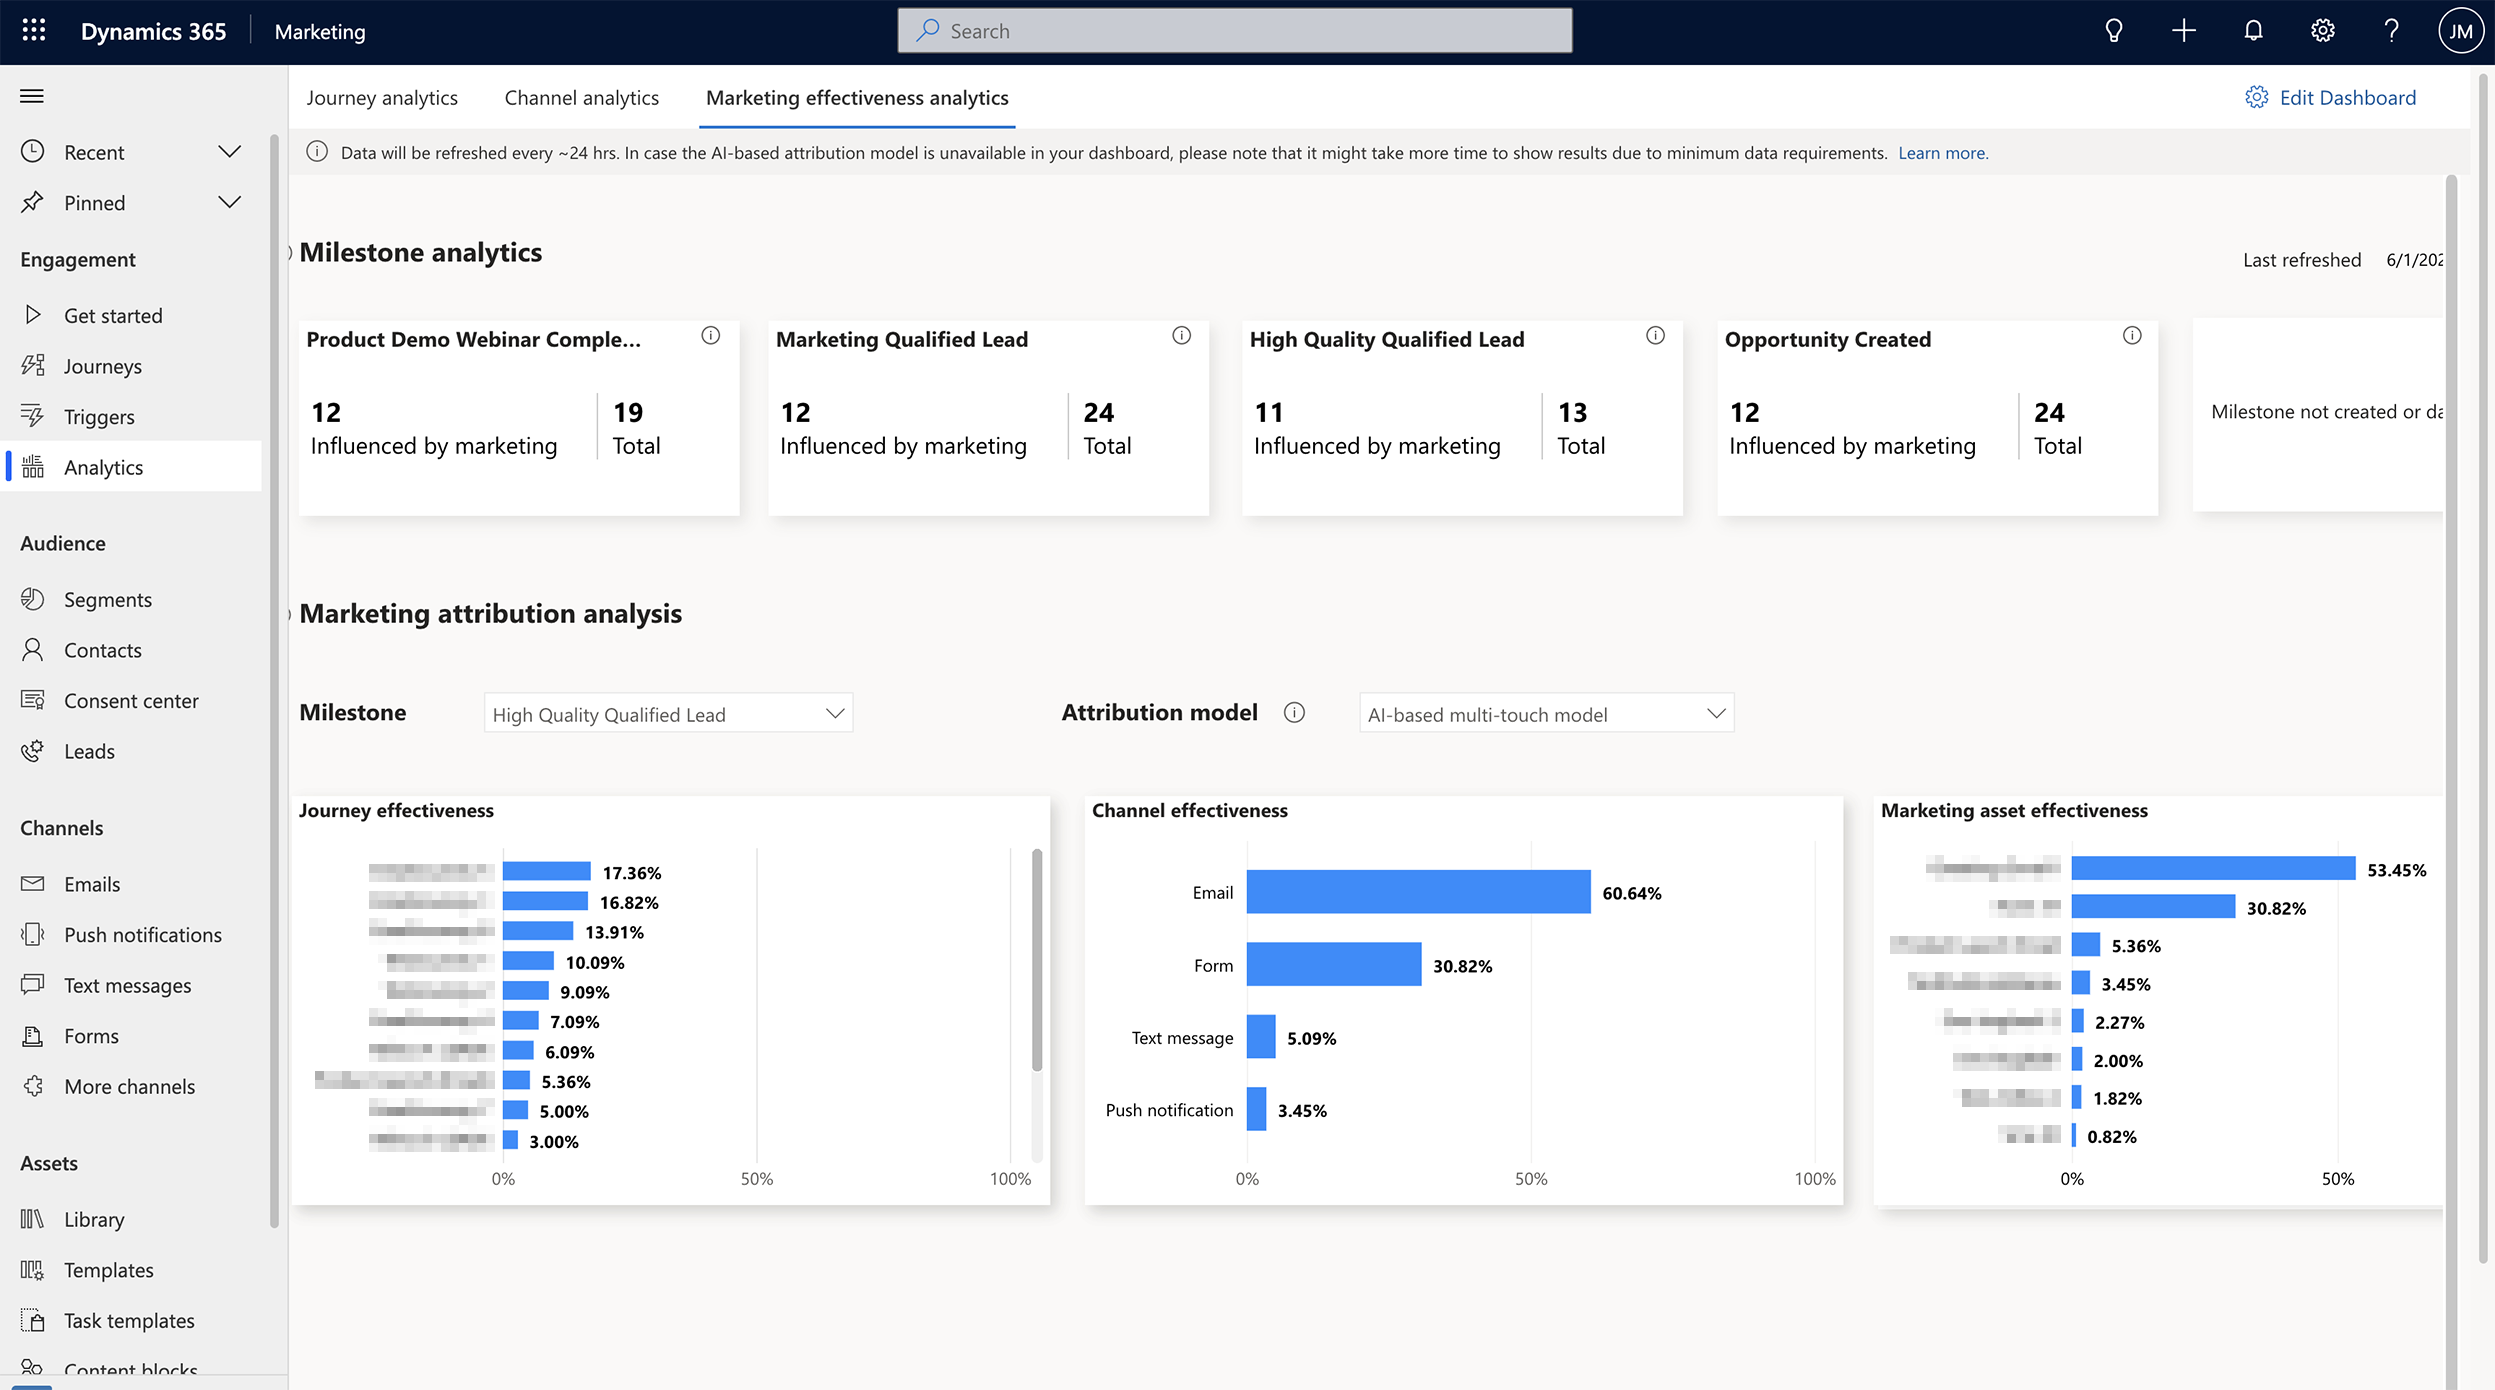
Office 365 analytics provides organizations with granular insights into how employees utilize collaboration tools, applications, and services across the Microsoft ecosystem. By transforming raw telemetry data into actionable dashboards and reports, these analytics tools help administrative leaders measure digital habits, evaluate adoption rates, optimize software licenses, and improve overall workplace efficiency while maintaining enterprise-grade privacy and data protection standards.
Introduction to Microsoft 365 Analytics and Reporting
Modern digital workplaces generate vast amounts of data regarding how people communicate, schedule meetings, share documents, and manage daily tasks. In the context of enterprise productivity suites, raw telemetry tracks user activity across applications such as Microsoft Exchange, SharePoint, OneDrive, Microsoft Teams, and Viva. However, raw logs alone provide little strategic value without structured processing. Microsoft 365 analytics translates this complex data layer into accessible dashboards, administrative centers, and customizable reports.
Understanding this environment requires recognizing the distinction between standard reporting and advanced analytics. While traditional logs offer point-in-time metrics—such as active mailbox counts or storage consumption—modern analytics frameworks evaluate behavioral patterns over time. These capabilities help IT administrators, human resources leaders, and department managers understand whether technology investments drive intended business outcomes. By examining collaboration trends, organizations can identify bottlenecks, address digital fatigue, and tailor training programs to support remote, hybrid, or in-office teams effectively.
Core Architectural Components of Office 365 Analytics
The analytics framework within Microsoft 365 relies on several interconnected data collection, processing, and visualization layers. Telemetry data originates from individual service workloads when users interact with cloud applications. This information flows securely into the Microsoft Graph and specialized data repositories managed under strict compliance boundaries.
Administrators typically access these insights through centralized management portals, primarily the Microsoft 365 admin center and specialized service dashboards. Behind the interface, aggregated data models protect individual user privacy while providing high-level organizational trends. The architecture balances transparency with data protection, ensuring that leaders evaluate team-level adoption rather than monitoring specific keystrokes or individual employee performance.
The Role of Microsoft Graph Data
Microsoft Graph serves as the unified programmability model that connects data across Microsoft 365 services. Analytics tools leverage Microsoft Graph APIs to query relationship data, communication patterns, and document collaboration metrics. This underlying engine processes signals safely, allowing applications to present unified views of teamwork without exposing sensitive email contents or private file data.
Privacy Protections and Data Aggregation
A critical consideration for any organizational analytics implementation is employee privacy. Microsoft designs its productivity analytics with built-in privacy controls. By default, metrics for communication and collaboration are aggregated at team or organizational levels. Administrators can configure anonymization settings to obscure individual identities, ensuring that analytics remain focused on systemic productivity and adoption trends rather than surveillance.
Primary Analytics Portals and Reporting Tools
Microsoft provides multiple distinct portals and reporting interfaces tailored to different organizational roles. Each tool addresses specific operational requirements, ranging from technical license optimization to workplace wellbeing evaluations.
- Microsoft 365 Analytics Ecosystem
- M365 Admin Center Reports
- License use
- Active users
- Storage
- Microsoft Viva Insights
- Wellbeing
- Manager insights
- Power BI Templates
- Custom BI
- Deep data modeling
- M365 Admin Center Reports
Microsoft 365 Admin Center Reports
The Microsoft 365 admin center hosts standard administrative reports designed primarily for IT professionals and system administrators. These reports measure service adoption, user activity, email security, and storage utilization.
- Active Users Report: Displays the number of unique users who signed in and engaged with a specific product, such as Teams or SharePoint, during a selected timeframe.
- Product Usage Breakdown: Helps administrators track which applications receive heavy investment and which remain underutilized, informing future licensing renewals.
- Email Activity and Security: Summarizes volume trends for inbound and outbound messages, along with threat protection statistics managed through integrated security layers.
Microsoft Viva Insights
Formerly known as Workplace Analytics and MyAnalytics, Microsoft Viva Insights shifts the focus from purely technical IT metrics toward human-centric productivity and organizational wellbeing. Viva Insights provides data-driven visibility into how time is spent across meetings, focused work, and after-hours communication.
- Manager and Leader Insights: Offers organizational leaders visibility into collaboration loads, siloed departments, and risks associated with burnout or excessive meeting cultures.
- Personal Insights: Empowers individual employees with private dashboard views of their daily habits, helping them protect focus time and disconnect outside working hours.
Power BI Integration for Advanced Reporting
For organizations requiring customized data modeling, Microsoft provides pre-built Power BI adoption content packs. Administrators can connect their Microsoft 365 usage data directly to Power BI desktop or service workspaces. This integration enables data analysts to merge productivity metrics with internal HR or financial databases, creating bespoke dashboards tailored to specific executive reporting requirements.
Key Metrics Evaluated in Office 365 Analytics
Effective analytics strategies focus on specific key performance indicators (KPIs) that reflect true digital transformation and user engagement. Evaluating the right metrics prevents organizations from drowning in irrelevant data.
| Metric Category | Typical Indicators | Primary Business Objective |
|---|---|---|
| License Utilization | Assigned vs. active licenses, feature adoption rates | Optimize software spending and eliminate waste |
| Collaboration Depth | Teams channel messages, co-authoring frequency | Measure teamwork effectiveness and digital culture |
| Workload Balance | Meeting hours, after-hours email activity, focus time | Prevent employee burnout and support wellbeing |
| Infrastructure Health | Mailbox size, OneDrive consumption, site creation | Plan storage capacities and manage cloud resources |
Adoption and Active Usage Metrics
Active usage metrics move beyond simple license assignment to verify whether employees actually utilize deployed software. For example, an organization might purchase enterprise-tier licenses for all employees, but analytics reports may reveal that only 60% actively utilize SharePoint or OneDrive for document storage. Identifying these gaps allows IT teams to target training and change management initiatives effectively.
Collaboration and Communication Patterns
Analyzing how teams interact helps organizations break down communication silos. Metrics track whether cross-functional collaboration occurs frequently or if departments operate in isolation. By evaluating meeting durations, frequency, and attendee counts, workplace planners can streamline meeting cultures and restore valuable focus time to engineering, sales, and administrative teams.
Prerequisites and Administrative Permissions
Accessing Office 365 analytics tools requires specific administrative roles and appropriate subscription tiers. Not all users or administrators possess automatic access to every reporting module due to privacy safeguards.
Administrative Roles Required
To view standard reports in the Microsoft 365 admin center, an individual typically must hold roles such as Global Administrator, Reports Reader, Exchange Administrator, or Teams Administrator. For advanced human-centric analytics through Microsoft Viva Insights, specialized roles govern access to aggregated organizational data, ensuring that privacy compliance officers oversee data sharing permissions.
Subscription Requirements
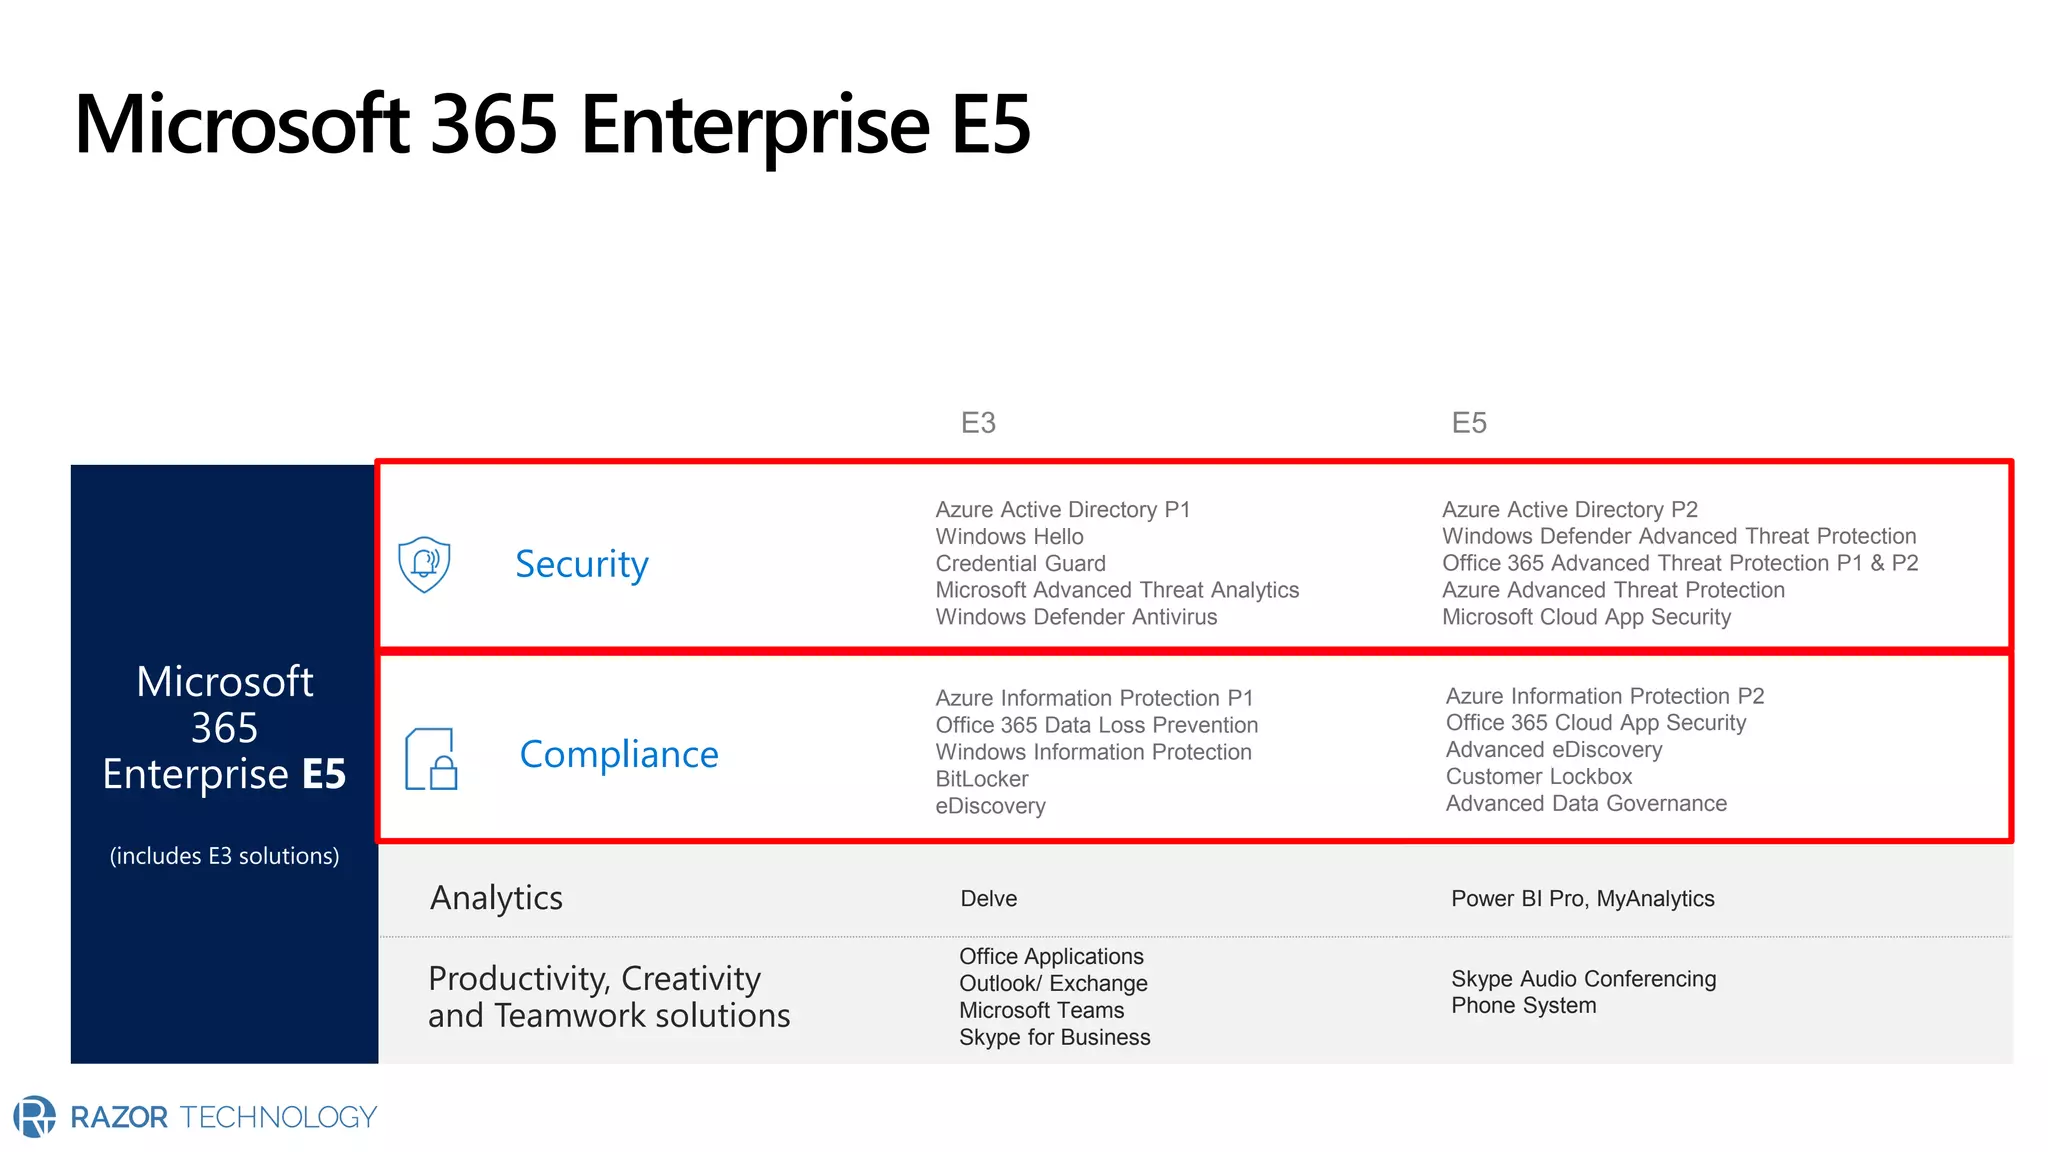
While basic usage and activity reports are included with standard Microsoft 365 business and enterprise plans (such as Business Standard, E3, and E5), advanced analytics capabilities often require specific license additions. For instance, advanced Viva Insights features and customized Power BI integration templates frequently demand higher-tier enterprise agreements or specific add-on licenses.
Step-by-Step Guide: Accessing and Reviewing Basic Analytics
Navigating the administrative interface to review organizational productivity data involves a straightforward sequence of steps for authorized personnel.
- Sign In: Navigate to the Microsoft 365 admin center using an account with Global Administrator or Reports Reader privileges.
- Locate Reports: In the left-hand navigation menu, expand the Reports section and select Usage.
- Select a Specific Service: Review the dashboard summary cards displaying high-level metrics for Exchange, OneDrive, SharePoint, and Microsoft Teams.
- Examine Detailed Tabs: Click on individual service tabs (such as Teams active users or Email activity) to view granular charts displaying activity over 7-day, 30-day, 90-day, or 180-day periods.
- Export Data: If deeper analysis is required, click the Export button to download usage summaries into a comma-separated values (.csv) file for spreadsheet processing.
Common Challenges and Troubleshooting in Microsoft 365 Analytics
Organizations implementing analytics initiatives often encounter specific operational hurdles. Addressing these challenges ensures data accuracy and maintains user trust.
Data Latency and Reporting Delays
A frequent point of confusion for new administrators is data latency. Telemetry data does not always appear in admin center reports instantaneously. Depending on the specific workload, data aggregation can take anywhere from 24 to 48 hours. Administrators troubleshooting missing activity should verify that sufficient time has passed after user onboarding before concluding that logging has failed.
User Anonymization and Missing Details
Organizations frequently request individual-level tracking for performance reviews, but Microsoft 365 privacy defaults obscure identifiable user names in organizational reports. If administrators see anonymized user IDs (e.g., User 12345) instead of real names, this behavior is intentional. Adjusting these display settings requires explicit administrative configuration and often demands alignment with internal works councils or privacy regulations.
Best Practices for Maximizing Office 365 Analytics Value
To derive maximum strategic value from analytics tools, organizations should adopt a structured, governance-first methodology rather than collecting data passively.
- Align Metrics with Business Goals: Define clear objectives—such as reducing internal email volume or increasing cloud document collaboration—before examining analytics dashboards.
- Protect Employee Trust: Communicate transparently with staff regarding how analytics tools operate. Emphasize that reports measure digital patterns to improve workplace wellbeing and efficiency, not to micromanage individuals.
- Combine IT and HR Insights: Pair technical usage data from the admin center with human resources context to understand how software adoption impacts employee retention and satisfaction.
- Regularly Review License Allocations: Conduct quarterly audits of active usage reports to reassign or reclaim unused licenses, directly reducing unnecessary software expenditures.
Frequently Asked Questions
Can Office 365 analytics track individual keystrokes or private chat messages?
No. Microsoft 365 analytics tools are engineered to protect employee privacy. They measure aggregated collaboration patterns, meeting durations, and application usage frequencies. They do not monitor individual keystrokes, track web browsing history outside the platform, or expose the private contents of emails and personal chats.
How long is historical usage data retained in the admin center?
Standard usage reports in the Microsoft 365 admin center typically retain historical data for up to 180 days. For long-term trend analysis extending beyond six months, administrators must export data periodically or utilize Power BI content packs connected to external data warehouses.
Are analytics available for all Microsoft 365 subscription plans?
Basic usage and adoption reports are available across most standard business and enterprise subscription tiers. However, advanced behavioral analytics, manager insights, and customized Power BI data models often require higher-level enterprise plans or specialized add-on licenses like Microsoft Viva.
Why do some active users show zero activity in specific service reports?
Data latency is a common cause, as reporting mechanisms can take up to 48 hours to process telemetry. Additionally, if a user interacts with a service through alternative clients or cached credentials without triggering cloud synchronization events, activity tracking may temporarily fail to record the interaction.
Who has access to organizational analytics reports by default?
By default, only users assigned specific administrative roles—such as Global Administrator, Reports Reader, or workload-specific administrators—can view standard admin center reports. Standard non-admin users cannot access organizational-wide analytics dashboards unless granted specific personal insights permissions.
Conclusion and Next Actions
Office 365 analytics provides essential visibility into modern digital workplaces, bridging the gap between IT infrastructure management and human-centric productivity. By leveraging admin center reports, Viva Insights, and Power BI integrations, organizations can optimize license investments, improve meeting cultures, and support employee wellbeing. To begin, audit your current administrative permissions, establish clear adoption benchmarks, and review your organization's active usage dashboard to identify immediate licensing and collaboration opportunities.