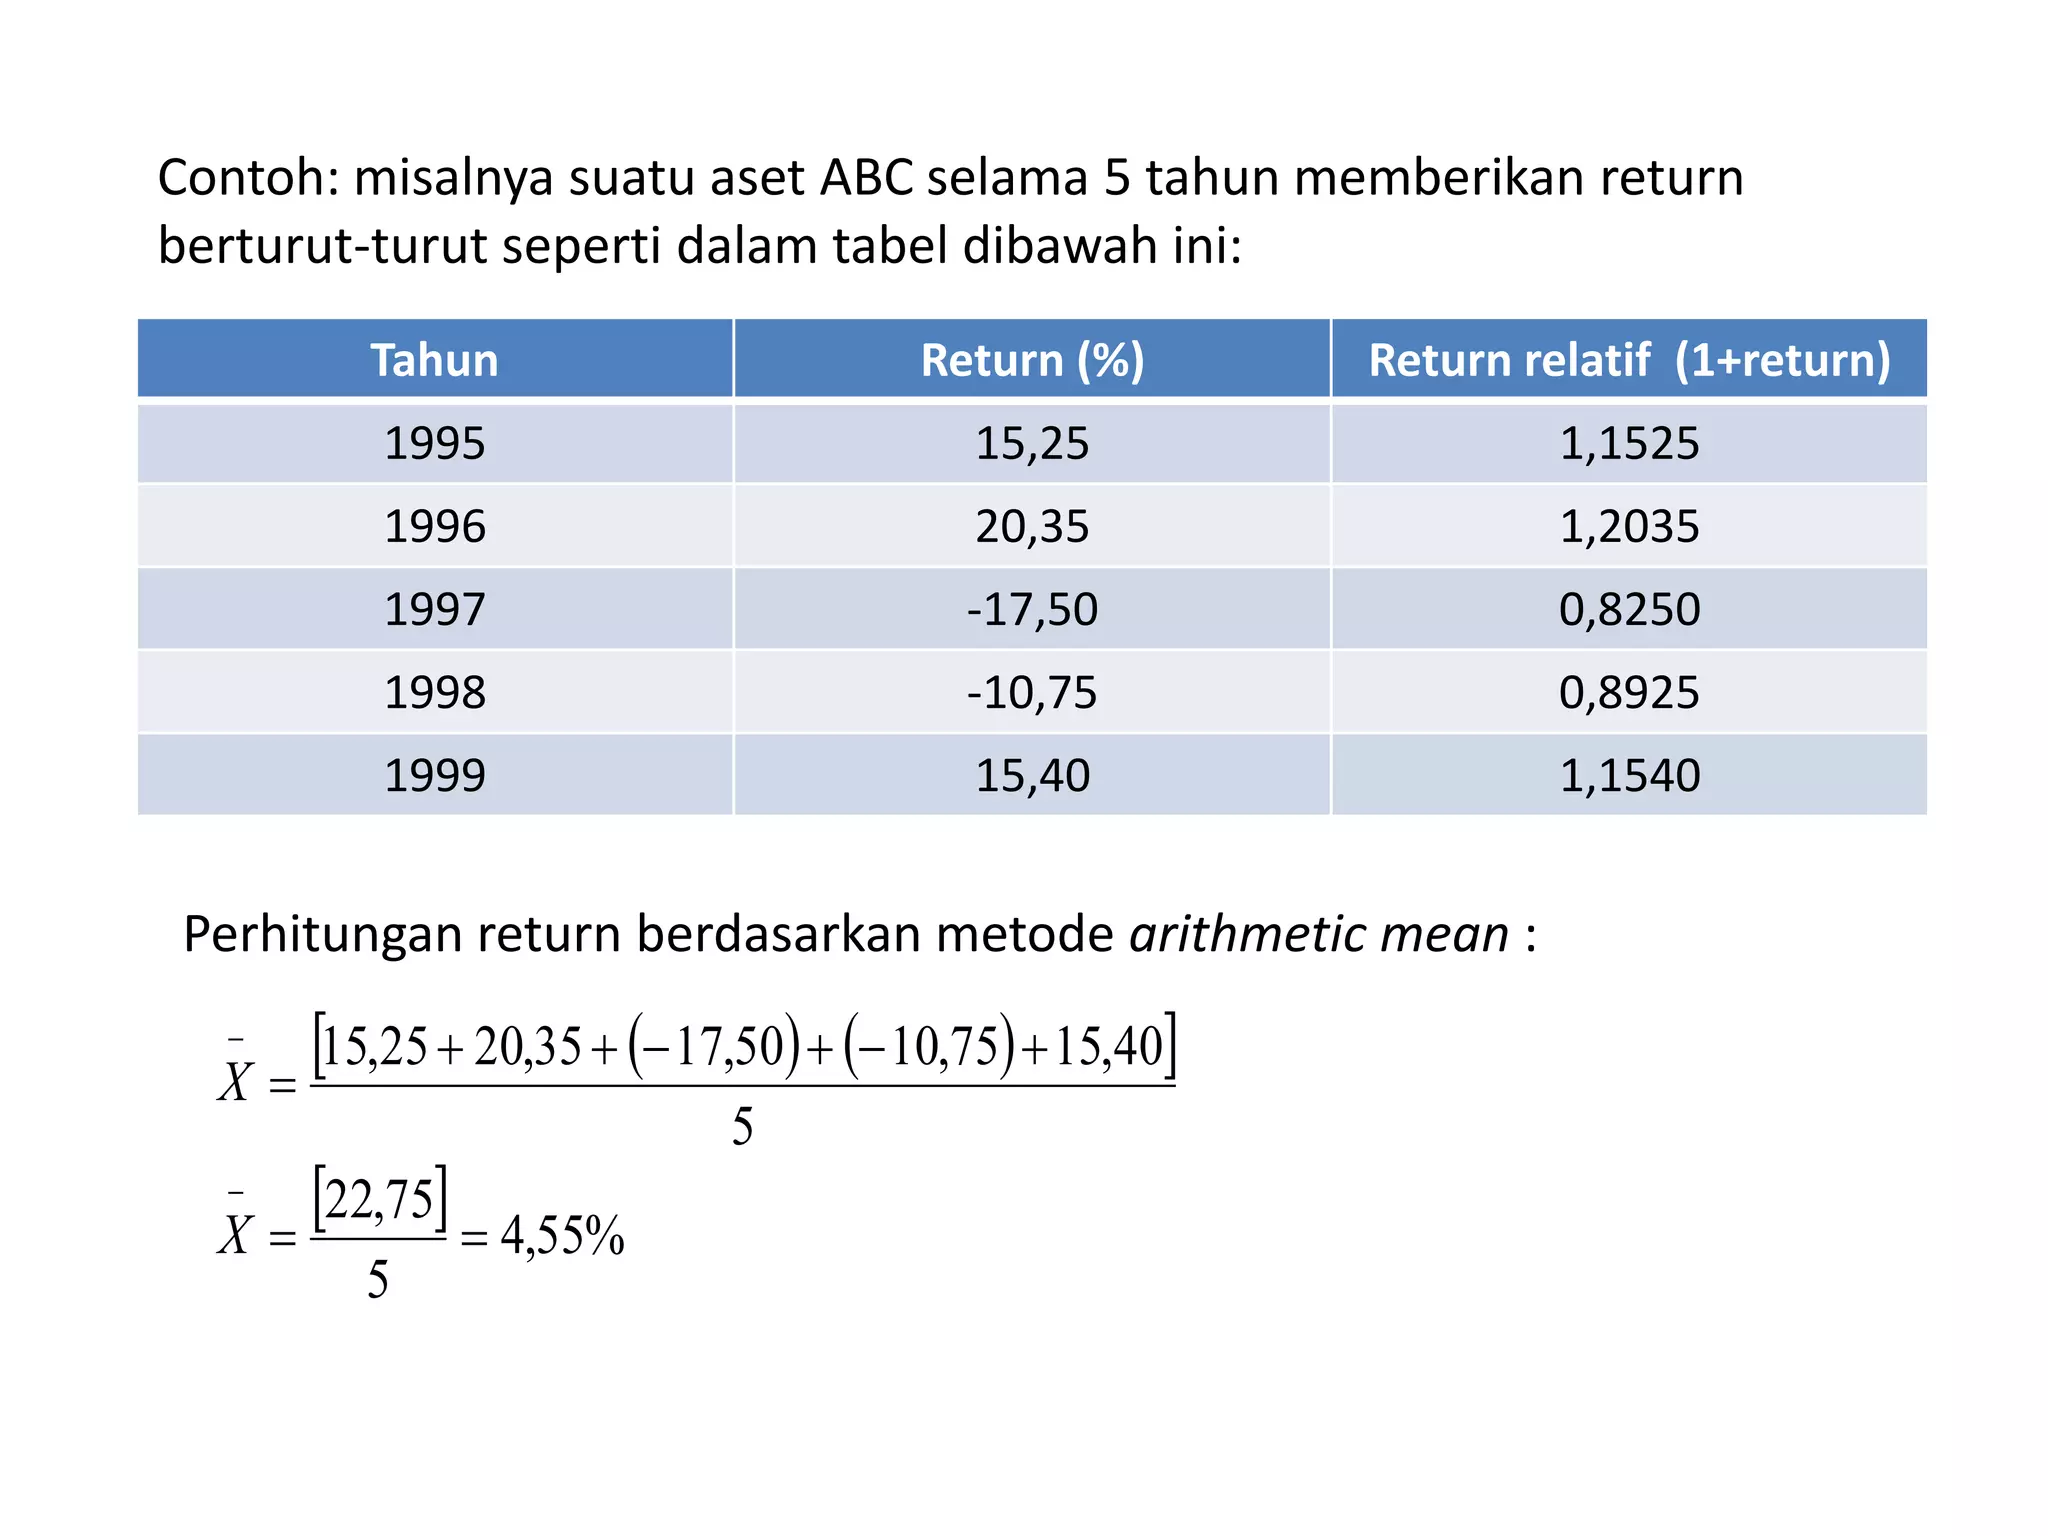
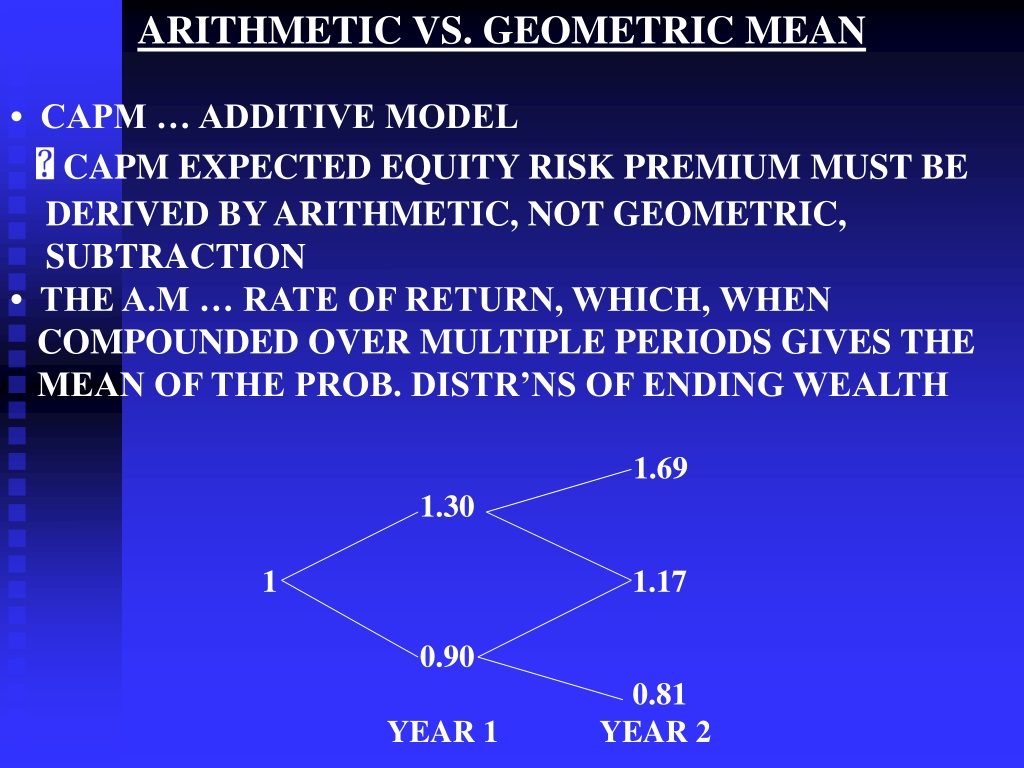
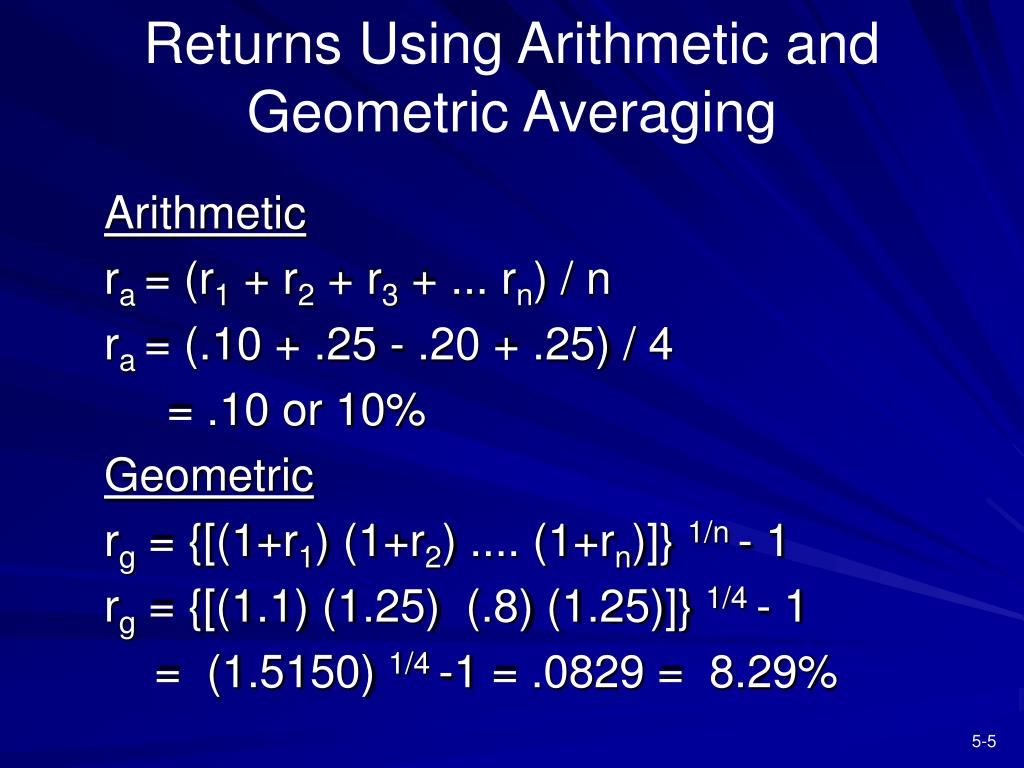
The arithmetic return is the simple mathematical average of a series of periodic returns over a specific timeframe. It is calculated by summing all individual returns and dividing by the total number of periods. While useful for predicting the return of a single future period, it does not account for the effects of compounding.
The Fundamentals of Arithmetic Return
In the world of finance and investment analysis, the arithmetic return—often called the arithmetic mean return—serves as one of the most basic yet essential metrics for evaluating performance. At its core, it provides a straightforward snapshot of the average performance of an asset or portfolio over several discrete intervals, such as months or years.
Unlike more complex measures that account for the growth of a dollar over time, the arithmetic return treats each period as an independent event. This makes it an invaluable tool for statistical analysis and probability modeling, though it requires careful interpretation when used to describe historical wealth accumulation. As of 2026, despite the proliferation of advanced algorithmic trading and real-time data analytics, the arithmetic return remains a cornerstone of Modern Portfolio Theory (MPT) and risk-adjusted return calculations.
The Mathematical Formula
The calculation of an arithmetic return is identical to finding the mean of any set of numbers. To determine the arithmetic return of an investment, you follow a sequence of logical steps.
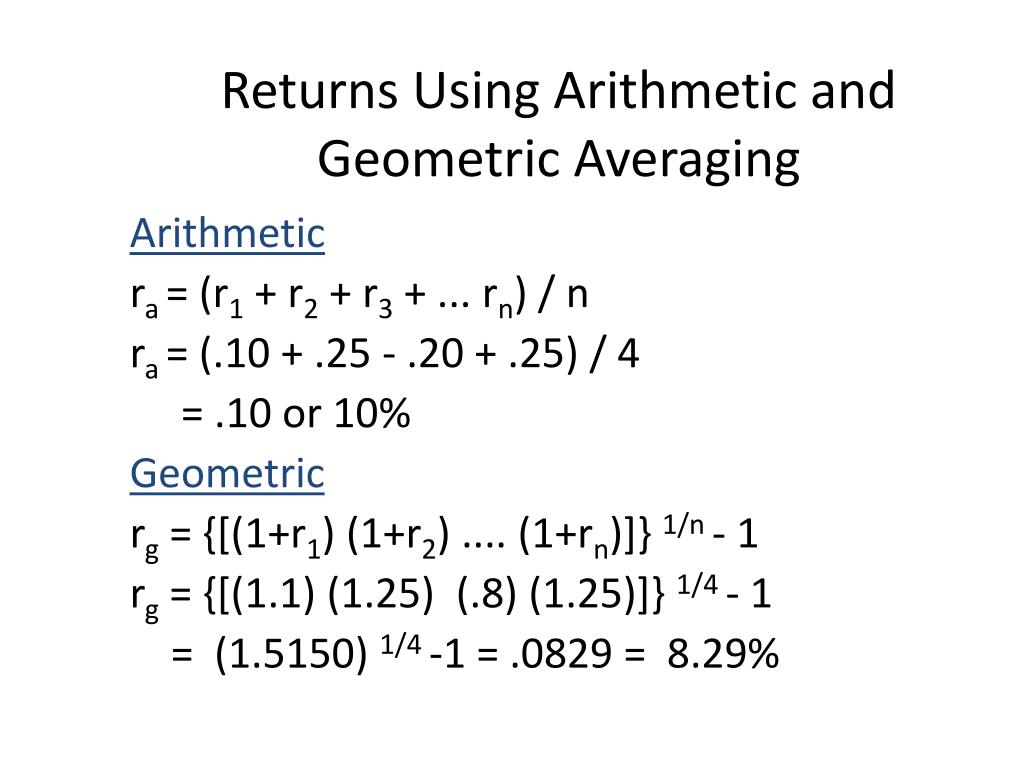
The Formula: $$R_a = \frac{\sum_{i=1}^{n} R_i}{n}$$
Where:
- $R_a$ is the arithmetic average return.
- $R_i$ represents the return for a specific period $i$.
- $n$ is the total number of periods.
To execute this calculation, an analyst first determines the percentage return for each sub-period. For example, if an asset returns 10% in Year 1, -5% in Year 2, and 15% in Year 3, the sum of these returns is 20%. Dividing by three (the number of periods) yields an arithmetic return of approximately 6.67%.
Arithmetic Return vs. Geometric Return
The most significant point of confusion for many investors is the distinction between arithmetic and geometric returns. While they may sound similar, they serve entirely different purposes and often yield significantly different results, especially in volatile markets.
The Concept of Volatility Drag
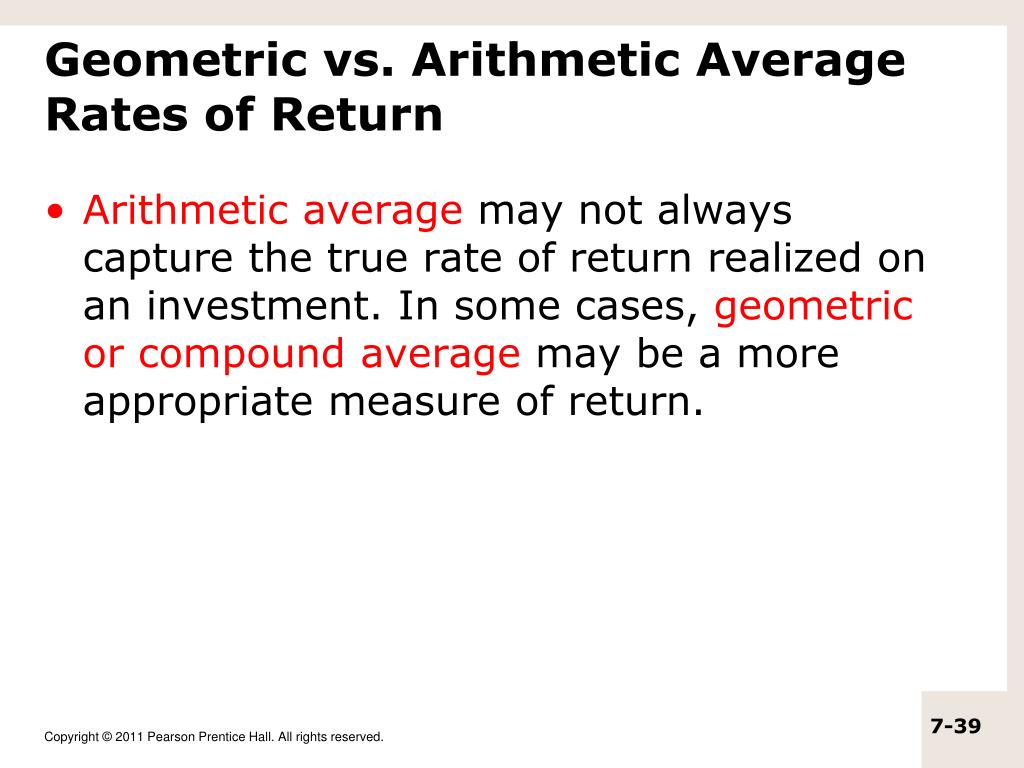
The arithmetic return will almost always be higher than the geometric return (also known as the Compound Annual Growth Rate or CAGR) unless all periodic returns are identical. This difference is caused by "volatility drag." Because the arithmetic mean ignores the fact that a large loss requires a much larger gain to break even, it tends to paint a more optimistic picture of historical performance than what an investor actually experienced in terms of "dollars in the pocket."
Consider a extreme example: An investor starts with $100. In Year 1, the portfolio gains 100%, rising to $200. In Year 2, the portfolio loses 50%, falling back to $100.
- Arithmetic Return: (100% - 50%) / 2 = 25%
- Geometric Return: [(1 + 1.0) * (1 - 0.5)]^(1/2) - 1 = 0%
In this scenario, the arithmetic return suggests a healthy 25% average gain, but the investor has actually made zero profit over the two years. This highlights why the arithmetic return is considered a "biased" estimator of long-term wealth growth, but a "unbiased" estimator of the return for a single future period.
Practical Applications in Investment Analysis
Why do professionals continue to use arithmetic returns if they don't represent actual wealth growth? The answer lies in the realm of probability and forecasting.
1. Estimating Future Returns
If you are trying to predict the most likely return for the next single period (e.g., next year) based on historical data, the arithmetic mean is the statistically appropriate measure. It represents the "expected value" in a probabilistic sense. If an asset has returned an average of 8% over the last 20 years, 8% is the best starting point for a neutral forecast for Year 21, assuming the underlying market conditions remain consistent.
2. Risk and Volatility Metrics
The arithmetic return is a vital component in calculating the standard deviation of returns. Standard deviation measures how much individual returns vary from the average. Since risk-adjusted metrics like the Sharpe Ratio rely on the relationship between excess return and standard deviation, the arithmetic mean is embedded in the very fabric of risk management.
3. Mutual Fund Reporting
While regulators like the SEC often require the disclosure of geometric returns (time-weighted returns) to show actual investor experience, arithmetic returns are frequently used in internal research and by analysts to compare the relative "earning power" of different asset classes over short, independent intervals.
When to Use Which Metric
Choosing between arithmetic and geometric returns depends entirely on the question you are trying to answer.
| Feature | Arithmetic Return | Geometric Return (CAGR) |
|---|---|---|
| Primary Goal | Finding the average of independent periods. | Measuring actual wealth growth over time. |
| Best Use Case | Forecasting the next single period's return. | Evaluating historical performance of a fund. |
| Compounding | Ignores the effect of compounding. | Accounts for the effect of compounding. |
| Volatility Impact | Unaffected by the sequence of returns. | Heavily penalized by high volatility. |
| Relationship | Always $\ge$ Geometric Return. | Always $\le$ Arithmetic Return. |
Limitations and Common Pitfalls
Relying solely on arithmetic returns can lead to significant financial miscalculations, particularly when planning for long-term goals like retirement.
Overestimation of Wealth
As demonstrated in the 100% gain/50% loss example, the arithmetic return can hide the devastating impact of large drawdowns. If a financial advisor presents a strategy with a "12% average return," an investor must verify if that is an arithmetic or geometric average. If it is arithmetic and the strategy is highly volatile, the actual growth of the account may be closer to 8% or 9%.
The Sequence of Returns Risk
Arithmetic returns do not care about the order in which returns occur. However, for an investor withdrawing money (like a retiree), the sequence is everything. A massive loss at the beginning of retirement can deplete a portfolio even if the long-term arithmetic average remains high. Because it treats every year as a standalone statistic, the arithmetic return fails to capture this path-dependency.
Misinterpretation of "Average"
In common parlance, "average" is a vague term. Many retail investors assume average means "what I will get every year." In reality, markets rarely deliver the average. Using the arithmetic return without acknowledging the standard deviation (the "spread" of possible outcomes) provides a false sense of certainty.
Arithmetic Return in Technical Implementation
For those managing data in 2026, calculating arithmetic returns is straightforward using modern software.
In Microsoft Excel or Google Sheets
If you have a column of annual returns (e.g., A1 through A10), you simply use the formula:
=AVERAGE(A1:A10)
This function sums the values and divides by the count, providing the arithmetic mean instantly.
In Python (Pandas)
Data scientists and quantitative analysts often use the Pandas library to handle large datasets.
import pandas as pd returns = [0.10, -0.05, 0.15, 0.08] df = pd.DataFrame(returns, columns=['Returns']) arithmetic_avg = df['Returns'].mean()
This approach allows for the analysis of thousands of assets simultaneously, which is standard practice in modern institutional high-frequency trading and portfolio rebalancing.
Regulatory Standards and Compliance
Financial institutions are subject to strict guidelines regarding how returns are presented to the public. The Global Investment Performance Standards (GIPS), maintained by the CFA Institute, generally require the use of time-weighted (geometric) returns when presenting historical performance to prospective clients. This is to ensure that firms do not use the naturally higher arithmetic average to mislead investors about the actual growth they would have experienced.
The Securities and Exchange Commission (SEC) also maintains rigorous standards for mutual fund advertising. While firms can discuss arithmetic averages in the context of volatility or statistical probability, the "headline" numbers must reflect the actual net-of-fees performance that accounts for compounding.
The Role of Arithmetic Return in 2026
As we navigate the financial landscape of 2026, the arithmetic return remains relevant because of the increasing focus on Expected Value (EV) in decision-making. With the rise of retail options trading and more complex derivative strategies, understanding the probability-weighted average of outcomes—which is essentially what the arithmetic mean represents—is more important than ever for individual risk management.
Furthermore, in a world where "Big Data" allows us to look at returns in smaller and smaller increments (daily, hourly, or even by the second), the arithmetic return provides a quick way to normalize data sets before they are fed into machine learning models for predictive analysis.
Frequently Asked Questions
Is the arithmetic return the same as the simple return?
Not exactly. A simple return usually refers to the percentage gain or loss for a single period (e.g., "The stock had a 10% simple return this year"). The arithmetic return is the average of several of those simple returns over multiple periods.
Why is the arithmetic return always higher than the geometric return?
This is due to a mathematical principle known as Jensen's Inequality. Mathematically, because you cannot lose more than 100% but can gain an unlimited amount, the positive outliers in a set of returns pull the arithmetic mean up more than they affect the geometric mean, which is dampened by the "drag" of negative periods.
Can an arithmetic return be negative?
Yes. If the sum of all periodic returns is negative, the arithmetic return will be negative. For example, if an asset loses 10% in Year 1 and 20% in Year 2, the arithmetic return is -15%.
Which return should I use for my retirement calculator?
For long-term retirement planning, you should almost always use the geometric return (or CAGR). Using the arithmetic return will likely lead you to over-calculate your future nest egg, potentially leaving you underfunded when you stop working.
Does the arithmetic return include dividends?
It depends on the data used. If the individual periodic returns being averaged are "Total Returns" (which include price appreciation plus dividends), then the arithmetic return includes dividends. If the data only tracks price, the arithmetic return does not include dividends.
Strategic Recommendation
When evaluating any investment opportunity or reviewing your portfolio performance, always clarify which "average" is being used.
- Use Arithmetic Returns for understanding the typical performance of a single period and for calculating risk metrics like standard deviation and the Sharpe Ratio.
- Use Geometric Returns (CAGR) for evaluating how much your wealth has actually grown over time and for setting realistic expectations for long-term compounding.
- Always look at the volatility. Two portfolios can have the same arithmetic return of 10%, but the one with lower volatility will have a higher geometric return and result in more actual money for the investor.
By distinguishing between these two measures, you can avoid the "compounding trap" and make more informed, mathematically sound financial decisions.