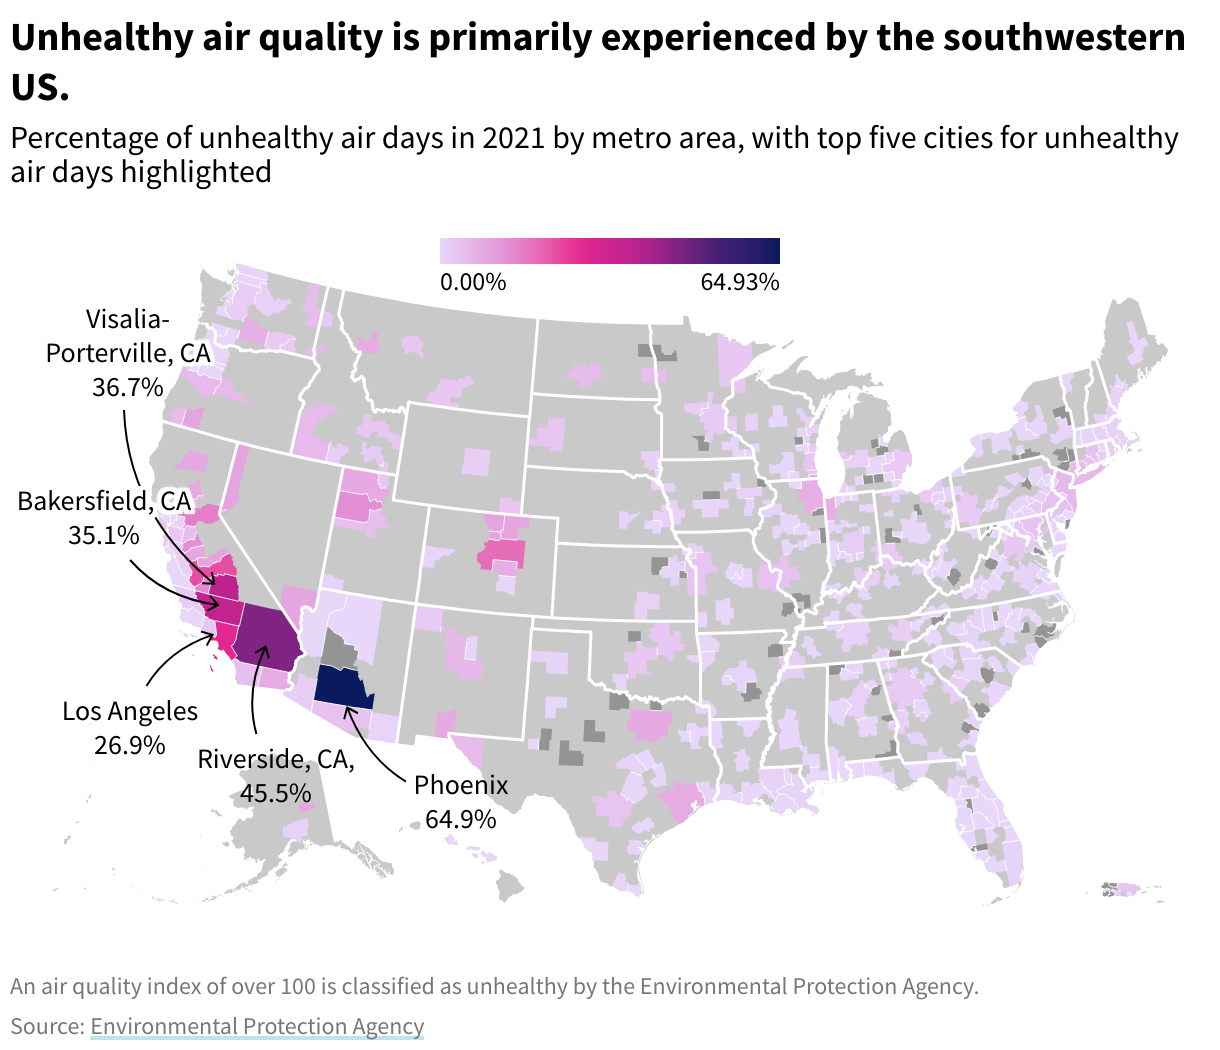
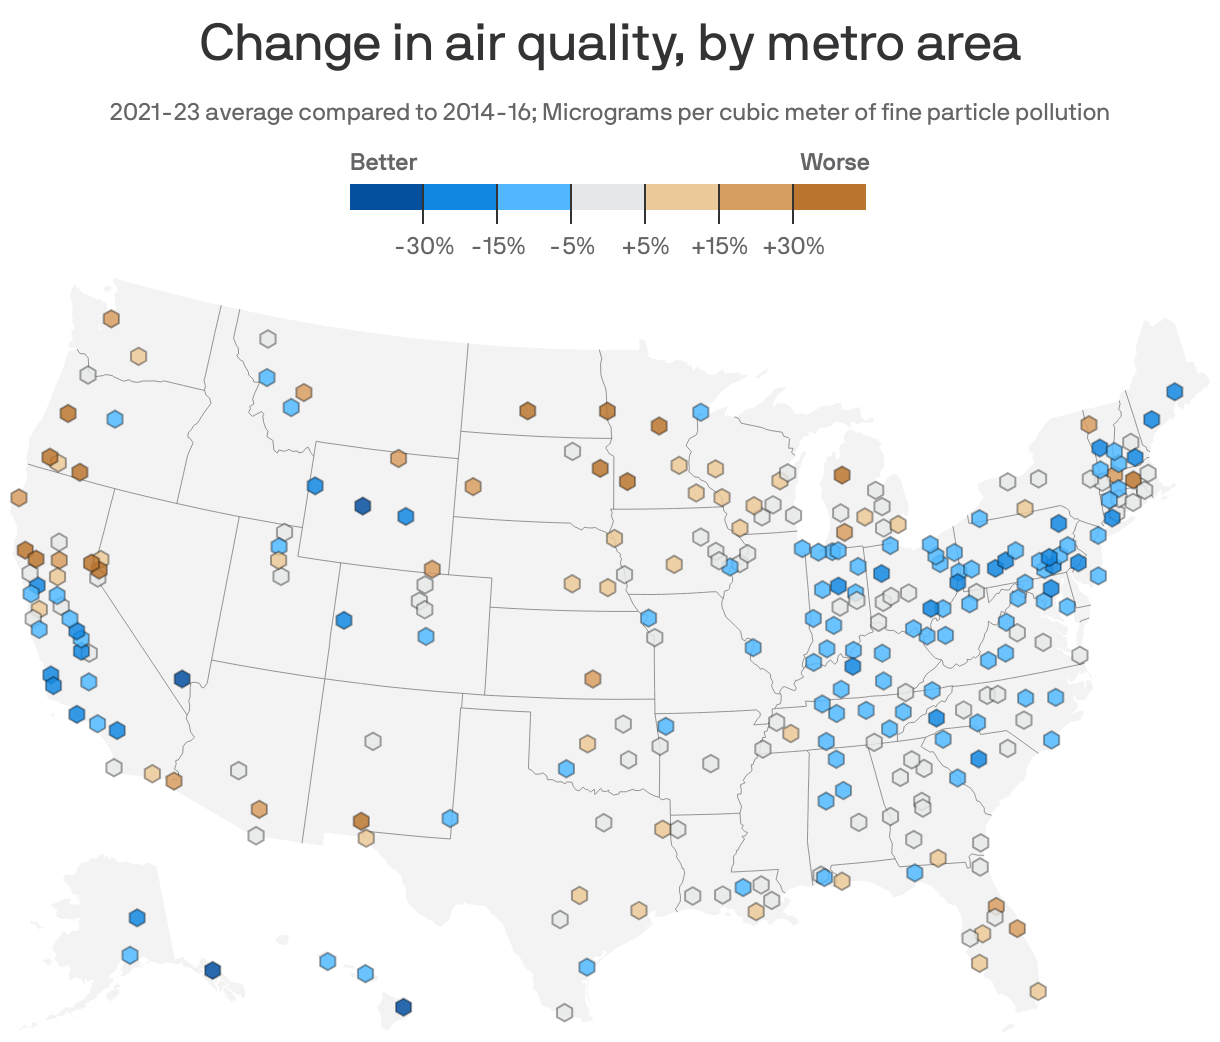
An air pollution map of the USA provides real-time data on atmospheric conditions using the Air Quality Index (AQI). These interactive maps, primarily managed by the EPA’s AirNow program, track critical pollutants like PM2.5 and ozone. By visualizing data from thousands of monitors, they allow users to identify health risks, track wildfire smoke, and make informed decisions about outdoor activities.
Reliable air pollution maps are no longer just tools for atmospheric scientists; they have become essential daily resources for millions of Americans. As we navigate 2026, the integration of satellite imagery, low-cost sensor networks, and advanced AI forecasting has made these maps more accurate and accessible than ever before. Understanding how to interpret this data is the first step in protecting your respiratory health and understanding the environmental state of the nation.
Understanding the Air Quality Index (AQI) on National Maps
When you look at an air pollution map of the USA, the most prominent feature is the color-coded scale known as the Air Quality Index (AQI). The AQI is a standardized tool used by the Environmental Protection Agency (EPA) to communicate how clean or polluted the air is and what associated health effects might be a concern.
The AQI scale runs from 0 to 500. The higher the AQI value, the greater the level of air pollution and the greater the health concern. For example, an AQI value of 50 or below represents good air quality, while an AQI value over 300 represents hazardous air quality. The index is divided into six categories, each assigned a specific color to make it easy for people to quickly understand whether air pollution is reaching unhealthy levels in their communities.
The Six AQI Categories
- Green (0-50): Good. Air quality is considered satisfactory, and air pollution poses little or no risk.
- Yellow (51-100): Moderate. Air quality is acceptable; however, for some pollutants, there may be a moderate health concern for a very small number of people who are unusually sensitive to air pollution.
- Orange (101-150): Unhealthy for Sensitive Groups. Members of sensitive groups may experience health effects. The general public is not likely to be affected.
- Red (151-200): Unhealthy. Everyone may begin to experience health effects; members of sensitive groups may experience more serious health effects.
- Purple (201-300): Very Unhealthy. Health alert: everyone may experience more serious health effects.
- Maroon (301-500): Hazardous. Health warnings of emergency conditions. The entire population is more likely to be affected.
The AQI focuses on health effects you may experience within a few hours or days after breathing polluted air. Federal maps typically calculate the AQI for five major air pollutants regulated by the Clean Air Act: ground-level ozone, particle pollution (also known as particulate matter), carbon monoxide, sulfur dioxide, and nitrogen dioxide.
Leading Air Pollution Mapping Platforms in 2026
In 2026, several platforms offer high-resolution maps of air quality across the United States. While they all aim to provide clarity on air conditions, they utilize different data sources and update at varying frequencies.
AirNow (EPA, NOAA, and NPS)
AirNow remains the official source for air quality data in the United States. It is a partnership between the EPA, the National Oceanic and Atmospheric Administration (NOAA), the National Park Service (NPS), and state/local agencies. The AirNow map is unique because it uses regulatory-grade monitors. These instruments are highly accurate, strictly maintained, and calibrated.
One of the most useful features of AirNow in 2026 is the Fire and Smoke Map. This specialized view layers smoke plume data from satellites over ground-level sensor data, providing a comprehensive look at how wildfires—often hundreds of miles away—are impacting local air quality.
PurpleAir and Low-Cost Sensor Networks
While the EPA uses expensive, high-precision equipment, companies like PurpleAir have revolutionized mapping through crowdsourced data. PurpleAir uses low-cost laser particle counters to measure PM2.5. Because these sensors are affordable for individuals and local businesses, the network density is much higher than the EPA’s network.
However, users should be aware of the "correction factor." In 2026, most advanced maps (including the EPA’s integrated map) apply a mathematical correction to PurpleAir data to ensure it aligns with federal reference standards, as low-cost sensors can sometimes over-read humidity as particulate matter.
IQAir and Global Comparisons
For those looking for a broader perspective, IQAir provides a map that incorporates both government data and its own global network of sensors. It is particularly useful for travelers or those interested in how US air quality compares to international standards or cities. Their "AirVisual" platform offers 3D mapping and 7-day air quality forecasts, which are increasingly accurate due to machine learning models.
Key Pollutants Tracked by US Air Quality Maps
To use an air pollution map effectively, one must understand what is being measured. Not all "bad air" is the same. The two most common pollutants featured on US maps are PM2.5 and Ground-Level Ozone.
Particulate Matter (PM2.5 and PM10)
PM2.5 refers to atmospheric particulate matter that has a diameter of less than 2.5 micrometers, which is about 3% the diameter of a human hair. Because they are so small, these particles can lodge deep into the lungs and even enter the bloodstream.
- Sources: Wildfires, vehicle exhausts, power plants, and industrial processes.
- Mapping Significance: In 2026, PM2.5 is the primary pollutant tracked during the "wildfire season," which now impacts large swaths of the West and Midwest.
Ground-Level Ozone ($O_3$)
Unlike the protective ozone layer high in the atmosphere, ground-level ozone is a harmful air pollutant. It is not emitted directly into the air but is created by chemical reactions between oxides of nitrogen (NOx) and volatile organic compounds (VOC) in the presence of sunlight.
- Sources: Emissions from industrial facilities and electric utilities, motor vehicle exhaust, gasoline vapors, and chemical solvents.
- Mapping Significance: Ozone levels are typically highest on sunny, stagnant days. Maps often show "Ozone Action Days" in urban areas during the summer months.
Nitrogen Dioxide ($NO_2$) and Sulfur Dioxide ($SO_2$)
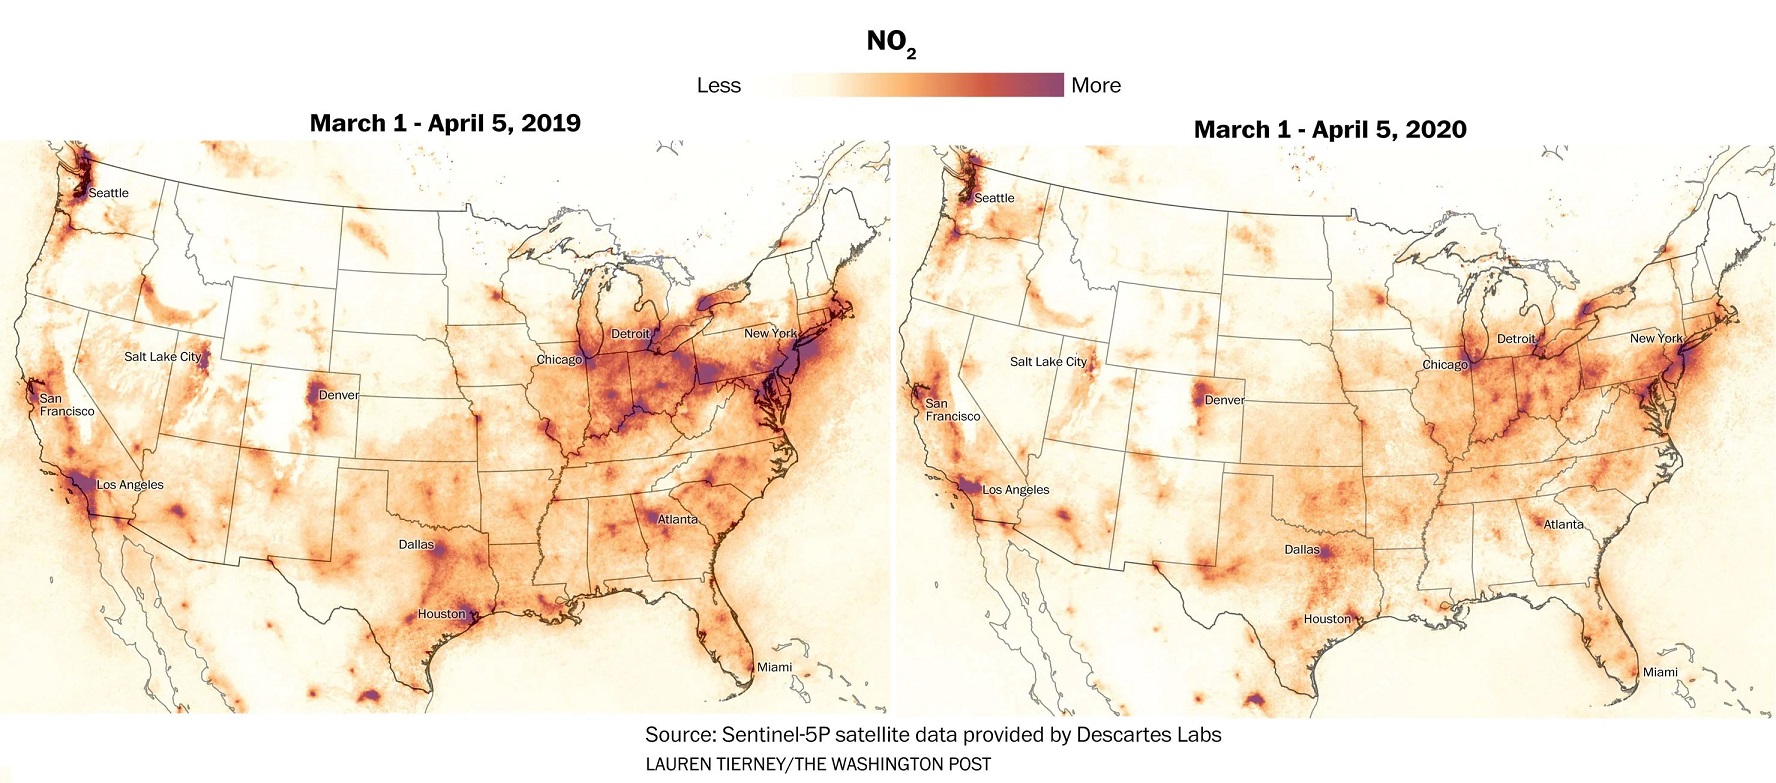
These gases are primarily products of combustion. $NO_2$ is a major indicator of traffic-related pollution, while $SO_2$ is often linked to coal-fired power plants and large-scale shipping. Modern maps allow users to toggle these specific pollutants to see if a local "hotspot" is caused by a nearby highway or an industrial site.
The Role of Satellite Imagery and AI in 2026
The air pollution maps of 2026 are vastly superior to those of a decade ago, largely due to the integration of satellite-based monitoring. NASA's TEMPO (Tropospheric Emissions: Monitoring of Pollution) mission, which became fully operational in the mid-2020s, provides hourly daylight observations of air quality over North America at a sub-urban scale.
Before these satellite advancements, maps relied solely on ground stations. If you lived 50 miles from the nearest station, the map was essentially "guessing" your air quality based on interpolation. Today, satellite data fills these gaps, detecting pollution plumes from space that ground sensors might miss.
Furthermore, Artificial Intelligence (AI) now processes this data in real-time. AI models take into account weather patterns (like temperature inversions that trap smog), topography, and historical traffic patterns to provide hyper-local forecasts. This means that a map can now tell you not just what the air is like now, but what it will likely be like during your commute or evening run.
Comparison of US Air Quality Mapping Tools
| Platform | Primary Data Source | Update Frequency | Best For | Key Feature |
|---|---|---|---|---|
| AirNow (EPA) | Regulatory Monitors | Hourly | Official health advice | Fire and Smoke Map integration |
| PurpleAir | Crowdsourced Sensors | Real-time (minutes) | Neighborhood-level detail | High sensor density in suburbs |
| IQAir | Mixed (Gov + Private) | Hourly | Global comparisons | 7-day AQI forecasting |
| NASA TEMPO | Satellite Imagery | Hourly (Daylight) | Regional plume tracking | Detection of $NO_2$ and $O_3$ from space |
| BreezoMeter | AI/Multi-source | Real-time | Individual route planning | Hyper-local (street-level) data |
Practical Applications: Using Pollution Maps for Daily Life
Monitoring an air pollution map of the USA is a proactive way to manage health. Different AQI levels require different actions, particularly for vulnerable populations such as children, the elderly, and those with asthma or COPD.
Planning Outdoor Activities
If the map shows "Orange" (Unhealthy for Sensitive Groups), it doesn't necessarily mean you must stay indoors, but it suggests shortening the duration of outdoor exercise or moving it to a time of day when levels are lower (often early morning for ozone). If the map reaches "Red" or "Purple," health officials generally recommend moving all strenuous activities indoors.
Wildfire Smoke Mitigation
Wildfire smoke is a significant driver of poor air quality in 2026. Because smoke can travel thousands of miles, people in New York or Chicago may experience "Very Unhealthy" air due to fires in the Canadian Rockies or the Sierra Nevada. Maps with smoke overlays allow you to see the direction of the plume, helping you decide when to close windows and turn on HEPA air purifiers.
Real Estate and Travel
Many people now use air pollution maps when considering a home purchase or a vacation destination. Long-term mapping trends can reveal if a neighborhood is a "diesel death zone" near a major logistics hub or if a mountain town is frequently trapped in a valley of woodsmoke during the winter.
Frequently Asked Questions
Why do different air pollution maps show different numbers for the same location?
Differences usually occur because of the sensor type and the averaging time. AirNow uses high-precision regulatory monitors that may update once an hour, while PurpleAir uses low-cost sensors that update every few minutes. Additionally, some maps show a "NowCast" AQI (an EPA formula that weights recent hourly data to reflect current conditions), while others might show raw, instantaneous readings.
What is the most accurate air pollution map for the USA?
The AirNow.gov map is the most accurate for health-based decision-making because it uses federal reference and equivalent methods. However, for the most granular "street-level" information, a combination of AirNow and a corrected PurpleAir map is often recommended by experts.
Can air pollution maps predict indoor air quality?
Not directly. Indoor air quality can be significantly better or worse than outdoor air depending on filtration (HEPA), ventilation, and indoor sources like gas stoves or tobacco smoke. However, when outdoor maps show high PM2.5 levels, indoor levels will eventually rise unless the building is well-sealed and filtered.
How do I read the "Fire and Smoke Map"?
The Fire and Smoke Map (a joint project of the EPA and US Forest Service) uses icons to represent different things. Circles usually represent permanent EPA monitors, while squares represent temporary monitors set up near fires, and triangles represent low-cost sensors. The colored "shading" across the map represents the smoke plume detected by NOAA satellites.
Does the 2026 data account for climate change impacts?
Yes, modern mapping algorithms in 2026 incorporate climate variables. Increasing temperatures and changing precipitation patterns have altered the "baseline" for air quality, leading to more frequent ozone alerts and longer, more intense wildfire seasons, all of which are reflected in real-time mapping.
Moving Toward a Healthier Environment
The ability to access an air pollution map of the USA from a smartphone has transformed public health. To make the most of this technology, experts recommend a three-step approach: Check, Plan, and Protect.
- Check: Make a habit of checking the AirNow or PurpleAir map as part of your morning routine, similar to checking the weather.
- Plan: Use the forecasting features to schedule heavy outdoor labor or exercise for times when the AQI is in the "Green" or "Yellow" range.
- Protect: If you live in an area prone to high pollution or smoke, use map data to trigger the use of N95 masks for outdoor tasks and the activation of indoor air filtration systems.
By integrating these tools into daily life, you can significantly reduce your cumulative exposure to harmful pollutants and navigate the changing atmospheric landscape of 2026 with confidence.