Aluminum prices historical trends in the market reflect a complex interplay of global industrial demand, energy costs, and geopolitical shifts. Over the past several decades, aluminum has transitioned from a stable industrial metal to a highly volatile commodity, with prices primarily dictated by Chinese production capacity, energy price fluctuations, and the accelerating global transition toward a low-carbon economy.
The Evolution of Aluminum Price Discovery
To understand historical trends, one must first recognize how aluminum is priced. The primary benchmark for global aluminum trading is the London Metal Exchange (LME). Established in the 19th century, the LME provides the most widely used price discovery mechanism for "primary" aluminum—aluminum produced from bauxite ore.
Historically, aluminum prices were relatively stable compared to precious metals. However, as the global economy became more integrated in the late 20th century, the market shifted toward a futures-based system. This allowed manufacturers and producers to hedge against price swings but also introduced a higher degree of speculative volatility. In addition to the LME, the Shanghai Futures Exchange (SHFE) has grown in prominence over the last two decades, reflecting China's status as the world’s largest producer and consumer of the metal.
Understanding historical trends requires looking beyond just the "ticker price." Market participants also pay a "physical premium" (such as the Midwest Premium in the U.S. or the Main Japanese Port premium), which covers the cost of logistics, insurance, and local supply-demand imbalances. These premiums often move independently of the LME base price, adding layers of complexity to historical data analysis.
The 2000–2010 Decade: The Rise of China and the Global Financial Crisis
The turn of the millennium marked a fundamental shift in the aluminum market. Before 2000, aluminum prices generally hovered between $1,300 and $1,600 per metric ton. This era of stability was shattered by the rapid industrialization of China.
The Super-Cycle (2003–2008)
Beginning around 2003, the "Commodity Super-Cycle" sent prices soaring. As China built out its infrastructure, high-speed rail, and urban housing, its thirst for aluminum became insatiable. Prices climbed steadily, peaking in mid-2008 at over $3,200 per metric ton. During this period, the narrative was one of scarcity; the world struggled to build smelters fast enough to meet the demand of the burgeoning Chinese middle class.
The 2008 Collapse and Recovery
The Global Financial Crisis (GFC) of late 2008 brought this era to a screeching halt. As credit markets froze and construction projects worldwide were abandoned, aluminum prices plummeted. By early 2009, prices had dropped below $1,300 per metric ton, a loss of more than 60% of their value in less than a year.
However, the recovery was equally sharp. Massive government stimulus packages, particularly in China, led to a V-shaped recovery. By 2011, aluminum had reclaimed the $2,500–$2,700 range, supported by a weak U.S. dollar and a renewed focus on industrial expansion.
The 2011–2019 Era: The Global Supply Glut and Trade Tensions
The decade following the GFC was defined not by demand growth, but by a massive oversupply of metal. China, once a net importer, invested heavily in state-of-the-art smelting capacity, often supported by government subsidies and cheap coal-fired power.
Persistent Oversupply
Throughout much of the 2010s, the aluminum market faced a "structural surplus." Chinese production capacity grew to represent more than 50% of the world's total output. This led to a long-term bearish trend, with prices frequently languishing between $1,700 and $2,000 per metric ton. For many Western producers, these prices were below the cost of production, leading to the closure of many legacy smelters in North America and Europe.
The 2018 Sanctions Shock
A major outlier in this decade occurred in April 2018. The U.S. Department of the Treasury imposed sanctions on the Russian company Rusal, the world’s second-largest aluminum producer. Because Russia is a critical supplier of high-purity aluminum to Europe and the U.S., the market panicked. LME prices spiked to nearly $2,500 in a matter of days. This event highlighted the market's extreme sensitivity to geopolitical risk and the fragility of global supply chains.
2020–2024: Pandemic Disruptions and Energy Crises
The current decade has been one of the most volatile in the history of the aluminum market. The convergence of a global pandemic, logistics breakdowns, and the largest land war in Europe since WWII created a "perfect storm" for price action.
The COVID-19 Demand Shock and Rebound
In early 2020, as the pandemic shuttered factories, aluminum prices dipped toward $1,450. However, the subsequent shift in consumer behavior—buying canned beverages instead of draft and investing in home electronics and appliances—led to a surge in demand for packaging and consumer goods. Combined with stimulus-driven construction, prices began a relentless climb that lasted through 2021.
The 2022 Energy Crisis Peak
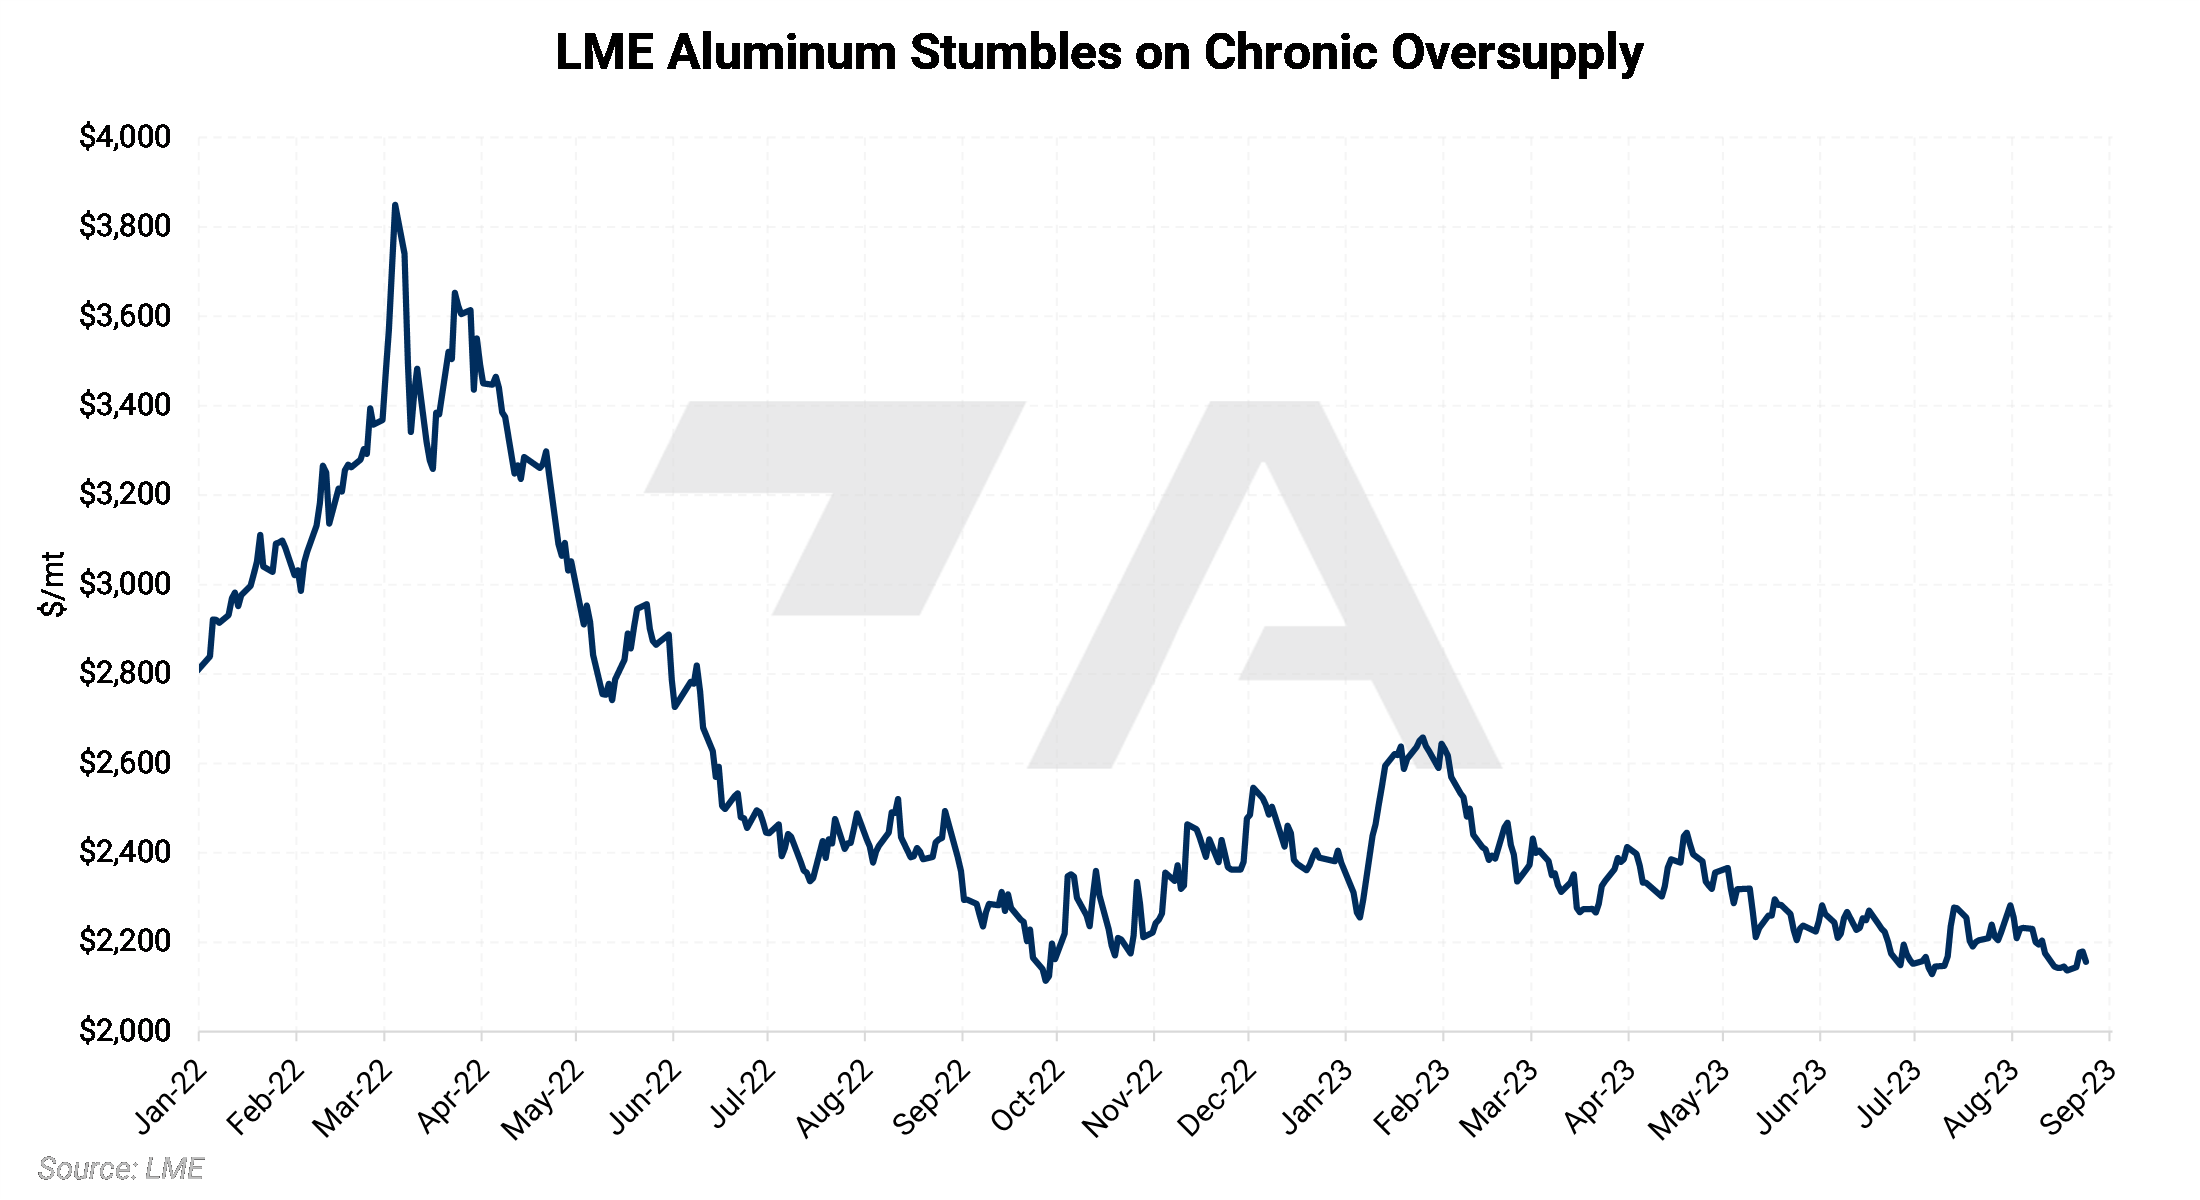
In March 2022, following the invasion of Ukraine and the subsequent energy crisis in Europe, aluminum prices reached an all-time record high, briefly touching over $4,000 per metric ton on the LME.
Aluminum is often referred to as "solid electricity" because the smelting process requires immense amounts of power. When natural gas prices in Europe skyrocketed, many European smelters became uneconomical and were forced to curtail production or close entirely. This created a supply vacuum in the Western world, driving prices to levels never seen before.
Historical Pricing Data Summary
The following table summarizes the average LME cash prices and key market drivers over the major historical periods.
| Period | Approx. Price Range (USD/mt) | Primary Market Driver | Impact on Global Supply/Demand |
|---|---|---|---|
| 1990–2000 | $1,200 – $1,600 | Industrial Stability | Balanced market with moderate growth. |
| 2003–2008 | $1,500 – $3,200 | China's Urbanization | Massive demand growth; supply struggling to keep up. |
| 2009–2010 | $1,300 – $2,200 | GFC & Recovery | Sharp demand drop followed by stimulus-led rebound. |
| 2011–2016 | $1,500 – $2,100 | Chinese Oversupply | Persistent surplus; Western smelter closures. |
| 2017–2019 | $1,700 – $2,500 | Trade Wars & Sanctions | U.S. Section 232 tariffs and Rusal sanctions. |
| 2021–2022 | $2,200 – $4,000 | Energy Crisis/Post-COVID | Record energy costs in Europe; supply chain bottlenecks. |
| 2023–2025 | $2,100 – $2,700 | Green Transition | Shift to low-carbon aluminum; cooling inflation. |
The Role of Energy Costs in Historical Trends
It is impossible to analyze aluminum prices without looking at the energy market. Power typically accounts for 30% to 40% of the total cost of producing aluminum. Historically, smelters were located near cheap energy sources: hydropower in Canada and Norway, or cheap coal in China and the Gulf states.
When energy prices diverge globally, aluminum prices follow. For example, during the 2022-2023 period, the "de-coupling" of European energy prices from the rest of the world meant that while the LME price (the global benchmark) was around $2,300, the actual cost of acquisition in Europe was much higher due to regional premiums and the loss of local production. This has led to a permanent shift where regional energy policy now dictates the survival of the smelting industry more than the global price of the metal itself.
The "Green Premium" and Low-Carbon Aluminum
As of 2026, the historical trend is being rewritten by the "Green Transition." In previous decades, all aluminum was treated as a fungible commodity. Today, the market is bifurcating.
- Primary Aluminum (High Carbon): Produced using coal-fired power, primarily in China and India.
- Green Aluminum (Low Carbon): Produced using hydropower or renewable energy, or through advanced recycling (secondary aluminum).
Historically, buyers did not pay extra for "green" metal. However, starting around 2023, we began to see the emergence of a Green Premium. Major automotive and tech companies are now willing to pay a premium over the LME price for aluminum with a certified low carbon footprint. This trend is further accelerated by the European Union’s Carbon Border Adjustment Mechanism (CBAM), which effectively taxes high-carbon imports, creating an artificial floor for prices of low-carbon metal in the Western hemisphere.
Inventory Levels and the "Queue" Issues
Another critical factor in historical price trends is the level of stocks held in LME-registered warehouses. In the years following the 2008 financial crisis, massive amounts of aluminum were tied up in "financing deals." Banks would buy physical aluminum, sell it forward on the futures market, and store it in warehouses to earn a guaranteed return.
This led to the infamous "LME warehouse queues" of 2011–2014, where buyers had to wait months to get their metal out of storage. While the LME base price was low, the difficulty in accessing physical metal drove up regional premiums. Historical analysis that looks only at the LME ticker without considering warehouse stock levels often misses the "real" price paid by industry.
Frequently Asked Questions
Why did aluminum prices hit a record high in 2022?
The record highs in 2022 were primarily driven by the energy crisis in Europe following the Russia-Ukraine conflict. Since Russia is a major global producer and Europe’s energy costs (natural gas and electricity) spiked to unprecedented levels, many smelters closed down. This created a severe supply shortage at a time when demand was still recovering from the pandemic.
How does the value of the U.S. Dollar affect aluminum prices?
Like most globally traded commodities, aluminum is priced in U.S. Dollars (USD). Historically, there is an inverse relationship between the two. When the USD is strong, aluminum becomes more expensive for buyers using other currencies (like the Euro or Yen), which typically dampens demand and puts downward pressure on the price. Conversely, a weak USD often supports higher aluminum prices.
What is the difference between primary and secondary aluminum prices?
Primary aluminum is made from bauxite ore and is very energy-intensive, making its price highly sensitive to energy costs. Secondary aluminum (recycled) requires about 95% less energy to produce. Historically, secondary aluminum prices track primary prices but are influenced more by the availability of scrap metal and local collection infrastructure.
Does China still control the global aluminum price?
While the LME remains the primary benchmark, China produces and consumes more than half of the world's aluminum. Therefore, Chinese government policy—such as export taxes, environmental restrictions on coal-fired smelters, and infrastructure spending—remains the single most influential factor in long-term historical price trends.
How has the shift to electric vehicles (EVs) impacted historical trends?
The shift to EVs has created a new, high-growth demand segment. EVs use significantly more aluminum than internal combustion engine (ICE) vehicles to offset the weight of heavy batteries. This "lightweighting" trend has provided a price floor over the last five years, preventing prices from returning to the lows seen in the mid-2010s despite economic headwinds.
Recommendation for Market Participants
For those tracking aluminum prices historical trends in the market in 2026, it is essential to move beyond the LME cash price as a sole indicator. To accurately forecast or budget, one must monitor regional energy costs, carbon legislation (like CBAM), and regional physical premiums. The historical trend suggests that the era of "cheap, coal-powered aluminum" is ending. Future price volatility will likely be driven by the speed of the energy transition and the availability of renewable power for smelting. Investors and procurement professionals should focus on securing long-term contracts for low-carbon metal, as the spread between "green" and "gray" aluminum is expected to widen significantly over the coming decade.