The figure of $13.7 million represents the approximate average net worth of the top 1% of households in the United States as recorded in the early 2020s. While the entry threshold to the top 1% is significantly lower—often hovering around $6 million—the average is heavily skewed upward by the extreme wealth of the top 0.1% and billionaires.
Defining the $13.7 Million Benchmark
When discussing wealth in the United States, it is essential to distinguish between the median, the threshold, and the average. The $13.7 million figure, which emerged from data analyzed by the Federal Reserve’s Survey of Consumer Finances (SCF) and subsequent economic studies, represents the mean net worth of the highest-earning percentile.
Net worth is calculated by taking the total value of all assets—including primary residences, investment real estate, retirement accounts, stocks, bonds, and private business equity—and subtracting all liabilities, such as mortgages, student loans, and consumer debt. Historically, the top 1% has seen its average net worth grow at a rate that far outpaces the bottom 90%, leading to a widening gap in capital ownership.
The $13.7 million average is a "weighted" figure. Because the top 1% is not a monolithic group, the presence of ultra-high-net-worth individuals (UHNWIs) with tens of billions of dollars pulls the average far above what a "typical" person in the 1% actually possesses. For many in the bottom half of the top 1%, their net worth may be closer to $6 million or $7 million, consisting largely of equity in a primary residence and a healthy 401(k) or brokerage account.
Historical Evolution of Top 1% Wealth
To understand how the average reached $13.7 million, one must look at the trajectory of American wealth concentration over the last century. Wealth distribution has historically moved in cycles, influenced by tax policy, technological revolutions, and global economic shifts.
The Post-War Era to the 1980s
Following World War II, the United States experienced what economists call "The Great Compression." High marginal tax rates and strong labor unions contributed to a more equitable distribution of wealth. During the 1950s and 60s, the average net worth of the top 1% was significantly lower, even when adjusted for inflation. Wealth was more likely to be tied to corporate leadership and professional services rather than the massive scale of globalized equity markets we see in 2026.
The 1980s Pivot
The 1980s marked a turning point with the implementation of supply-side economic policies, financial deregulation, and significant cuts to the top marginal tax rate. This era saw the beginning of "The Great Divergence." As the stock market began a multi-decade bull run, the assets most commonly held by the top 1%—equities and private business interests—appreciated at a rate that traditional wages could not match.
The 21st Century Acceleration
The transition to a digital economy and the globalization of finance further concentrated wealth. By the time the Federal Reserve released its 2019 and 2022 survey data, the impact of asset inflation was clear. The average net worth of the top 1% climbed toward the $11 million mark, eventually reaching the $13.7 million average as the post-pandemic recovery saw massive gains in both the housing market and the S&P 500.
The Role of Asset Composition
The reason the top 1% maintains an average net worth of $13.7 million is rooted in what they own. Unlike the bottom 50% of the population, whose wealth is often non-existent or tied strictly to a primary residence, the top 1% holds a diversified portfolio of productive assets.
Equities and Mutual Funds
For the top 1%, corporate equities and mutual fund shares make up the largest portion of their wealth. According to Federal Reserve data, the top 1% holds roughly 50% of all individually owned stocks in the U.S. This concentration allows them to capture the lion's share of economic growth and productivity gains.
Private Business Equity
Many individuals in the top 1% are business owners or partners in professional firms (law, medicine, finance). The valuation of these private enterprises contributes significantly to the $13.7 million average. Unlike a public stock, these assets are often illiquid but appreciate substantially over decades.
Real Estate Beyond the Primary Residence
While most Americans view their home as their primary asset, the top 1% treats real estate as an investment vehicle. This includes commercial real estate, multi-family units, and vacation properties. These assets provide not only capital appreciation but also tax-advantaged cash flow through depreciation and 1031 exchanges.
| Asset Class | Top 1% Allocation (Estimated) | Bottom 90% Allocation (Estimated) |
|---|---|---|
| Corporate Equities | 45% - 55% | 10% - 15% |
| Real Estate (Non-Primary) | 15% - 20% | 5% - 8% |
| Primary Residence | 10% - 12% | 60% - 70% |
| Pension/Retirement Accounts | 10% - 15% | 15% - 20% |
| Liquid Assets (Cash/CDs) | 5% | 5% |
The "Billionaire Skew" and the 0.1%
It is a common statistical trap to assume the "average" member of the top 1% lives the lifestyle of a billionaire. In reality, the $13.7 million average is a product of extreme outliers.
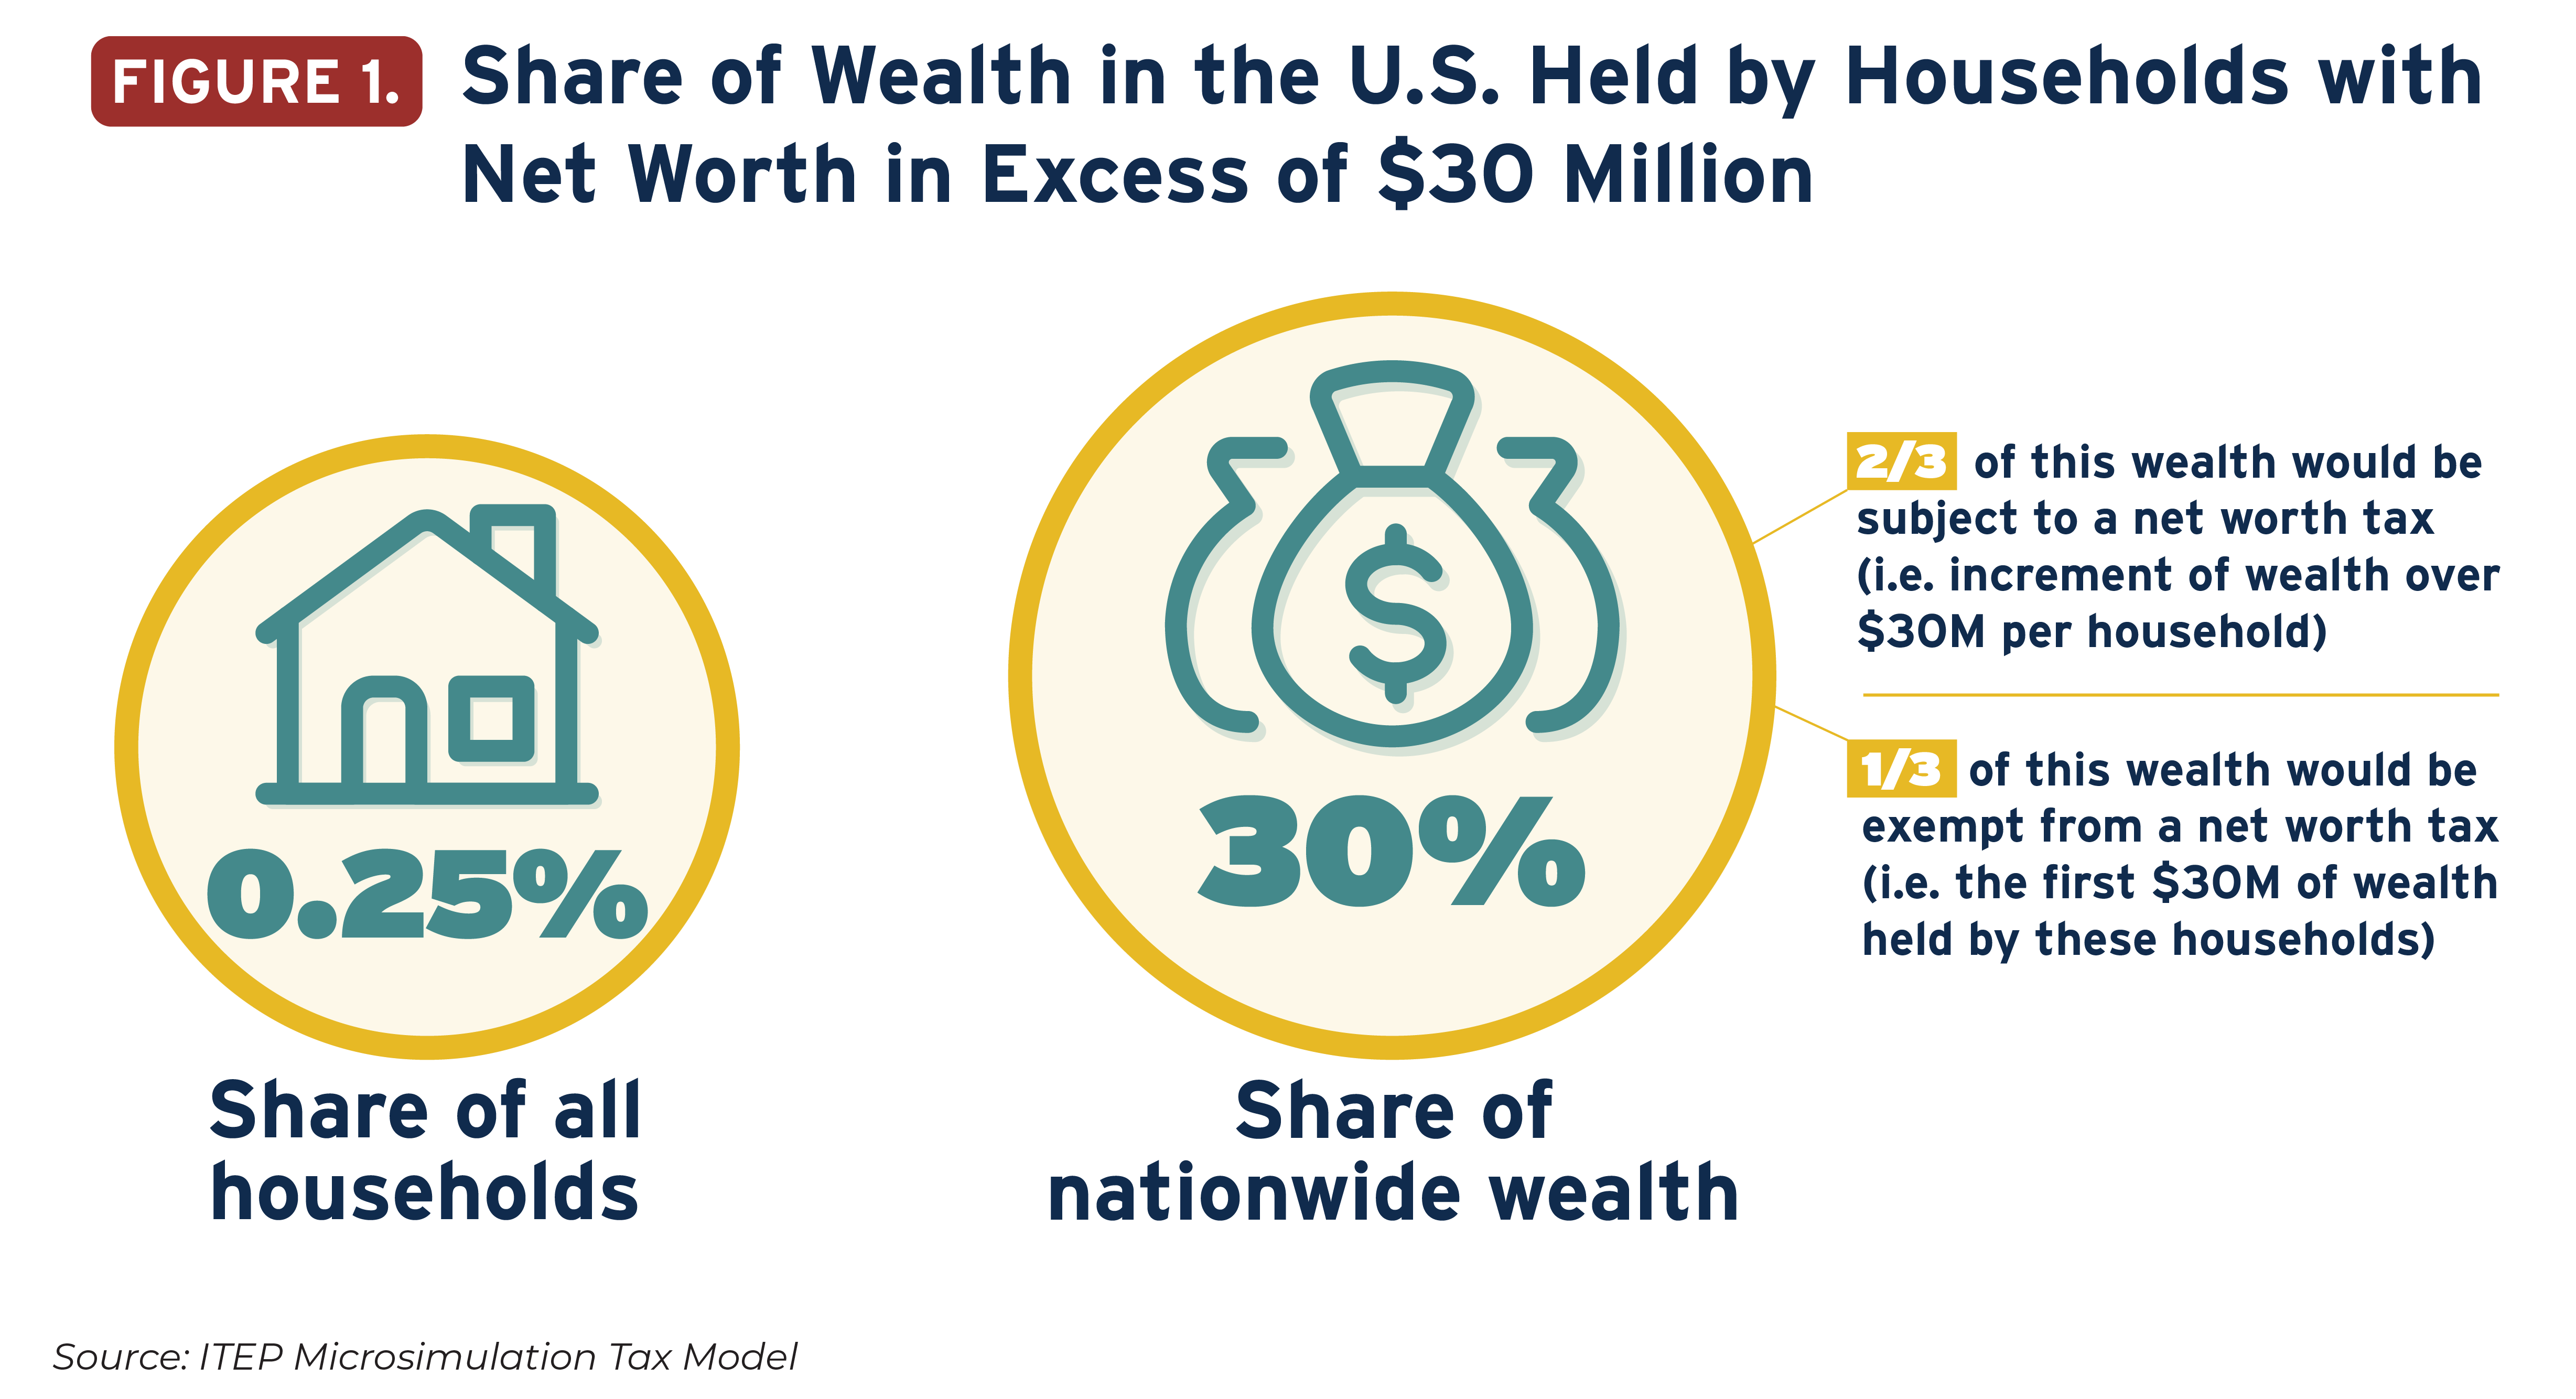
The top 1% includes approximately 1.3 million households in the U.S. Within that group, the top 0.1% (about 130,000 households) holds a disproportionate amount of the group's total wealth. When a handful of individuals like Jeff Bezos, Elon Musk, or Warren Buffett see their net worths increase by tens of billions, it raises the average for the entire 1.3 million households, even if the person at the very bottom of that percentile (the 99th percentile entry point) saw no gain at all.
This is why many economists prefer to use the median net worth of the top 1% to describe the "typical" wealthy household. The median is often several million dollars lower than the $13.7 million average, reflecting the reality of high-earning professionals rather than global titans of industry.
Factors Influencing the $13.7 Million Figure in 2026
As of 2026, several macroeconomic factors continue to stabilize or inflate this average. Understanding these helps explain why the figure remains a focal point for tax policy and social commentary.
- Monetary Policy and Inflation: Years of low interest rates and quantitative easing historically boosted asset prices. While the 2020s saw a return to higher rates, the established base of wealth for the top 1% remained resilient due to low-leverage positions and high-quality asset holdings.
- Tax Structure: The current tax code favors capital gains over ordinary income. Since the top 1% derives the majority of their wealth from capital appreciation, they benefit from lower tax rates than high-earning W-2 employees (like surgeons or engineers) who might have high income but lower total net worth.
- The Great Wealth Transfer: We are currently in the midst of the largest intergenerational transfer of wealth in history. As the "Silent Generation" and older Baby Boomers pass assets to their heirs, the concentration of wealth within the top 1% is expected to persist, as these assets often remain within the same socioeconomic circles.
Methodological Challenges in Measuring Wealth
Calculating a precise "average" net worth is notoriously difficult. The primary source for this data, the Federal Reserve’s Survey of Consumer Finances, is conducted every three years. There is often a lag between data collection and publication.
Furthermore, the very wealthy often utilize complex legal structures—such as irrevocable trusts, family limited partnerships, and offshore entities—to hold assets. These structures can make it difficult for government surveys to capture the full scope of an individual's net worth. Consequently, many economists believe that the $13.7 million average might actually be an underestimate of the true concentration of wealth at the top.
The World Inequality Database provides alternative metrics, often showing even higher levels of concentration when accounting for global capital flows and hidden wealth. These discrepancies highlight the importance of viewing the $13.7 million figure as a benchmark rather than an absolute, unchanging fact.
Comparisons: The U.S. vs. The World
The $13.7 million average is uniquely high in the United States. While other nations have wealthy populations, the "top heavy" nature of American wealth is distinct. In many European social democracies, higher tax rates on wealth and inheritance, combined with more robust social safety nets, result in a top 1% that holds a smaller share of the national wealth compared to their American counterparts.
However, in emerging markets or tax havens, the top 1% may hold an even larger percentage of national wealth, though the absolute dollar amount of the average might be lower than $13.7 million due to the smaller overall size of those economies. The U.S. remains the primary engine for ultra-high-net-worth wealth creation due to its deep capital markets and entrepreneurial ecosystem.
Frequently Asked Questions
Does having a net worth of $13.7 million make you a billionaire?
No. A billionaire has a net worth of at least $1,000 million. The $13.7 million figure is the average of the top 1%, which includes everyone from those with about $6 million to those with hundreds of billions. The billionaires are a very tiny fraction of the top 1% but their wealth is so vast that they pull the average up to the $13.7 million level.
What is the difference between wealth and income for the top 1%?
Income is the money earned annually (salary, dividends, interest), while wealth (net worth) is the total value of accumulated assets. Many in the top 1% have "low" taxable incomes relative to their wealth because their assets appreciate in value without being "realized" or sold, which would trigger a tax event.
Is the $13.7 million figure adjusted for inflation?
In most historical reports, figures are presented in "nominal" dollars for the year the data was collected. However, when economists compare the 1% across decades, they use inflation-adjusted (real) dollars to show that the concentration of wealth has truly increased in terms of purchasing power, not just in nominal digits.
How much of the $13.7 million is typically in cash?
Very little. For the top 1%, cash and liquid assets usually represent less than 5% of their total net worth. Holding large amounts of cash is seen as a "drag" on a portfolio because it does not produce growth or income and loses value to inflation. Most of the $13.7 million is tied up in stocks, bonds, and real estate.
What is the "threshold" to enter the top 1% in 2026?
While the average is $13.7 million, the entry threshold—the minimum net worth required to be in the top 1%—is estimated to be approximately $5.8 million to $6.5 million in 2026, depending on the specific state and demographic being measured.
Practical Recommendations for Wealth Tracking
Understanding the benchmarks of the top 1% can help individuals set long-term financial goals, even if they do not aim for the $13.7 million mark. To build and preserve wealth effectively:
- Focus on Productive Assets: Prioritize investments in equities and real estate over depreciating assets like luxury vehicles.
- Understand Your Net Worth: Use a consistent method to track your assets and liabilities. Tools provided by financial institutions can automate this, but a manual quarterly review is often more insightful.
- Tax Efficiency: Consult with a financial advisor or tax professional to understand how capital gains, step-up in basis, and retirement accounts can help you keep more of what you earn.
- Diversification: The top 1% rarely has all their money in one place. Diversifying across asset classes protects against market volatility.