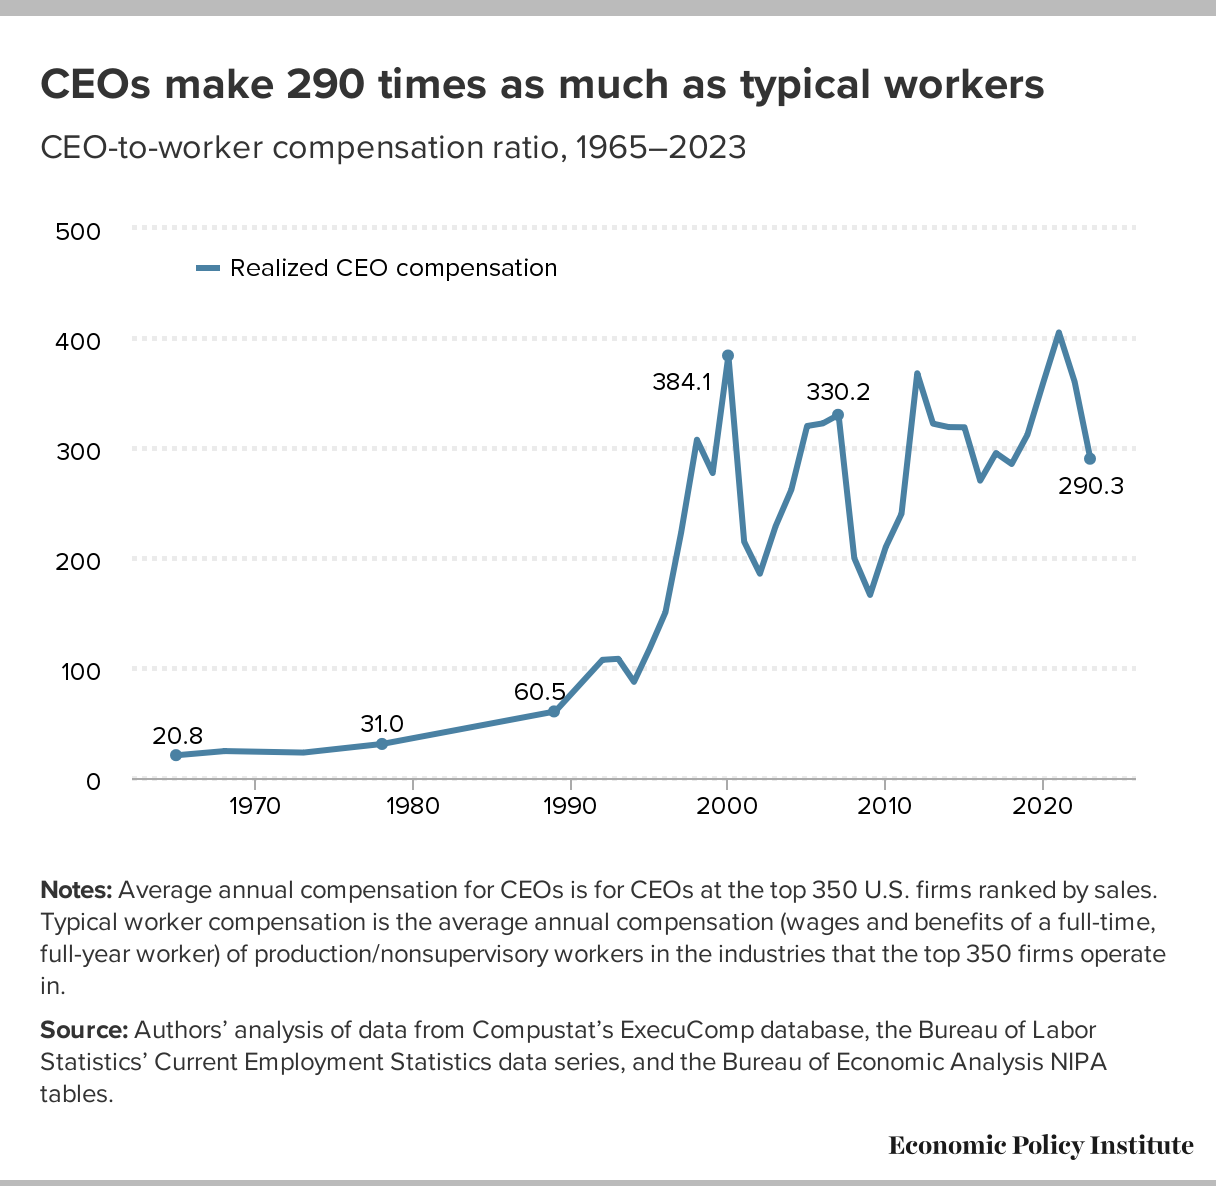
In 1965, the ratio of compensation between the average Chief Executive Officer (CEO) of a major American corporation and the average worker stood at approximately 24-to-1. This figure serves as a foundational data point in modern labor economics, representing an era of corporate compensation structures that contrasts sharply with the significantly higher ratios observed in the decades following the late 20th century.
The Context of 1965 Compensation Structures
To understand the 24-fold CEO pay gap in 1965, one must first recognize the prevailing economic climate of the mid-1960s. The United States was experiencing a period of robust post-war economic expansion. Corporate governance models were notably different from those utilized in the 2020s, characterized by more rigid salary structures, lower reliance on stock-based incentives, and a different regulatory environment regarding executive compensation disclosure.
During this period, executive compensation was primarily salary-driven. Bonuses existed but were often tied to objective, short-term performance metrics rather than the complex, long-term equity-based compensation packages that dominate modern corporate governance. Because compensation was predominantly cash-based and subject to high marginal tax rates—which exceeded 70% for top earners during portions of the 1960s—the incentive for massive, multi-million dollar annual packages was structurally limited.
Measuring the Gap: Data and Methodology
The 24-fold figure is most frequently cited by labor research organizations, most notably the Economic Policy Institute (EPI), which has tracked executive compensation trends over several decades. The calculation methodology involves comparing the total realized compensation of CEOs of the largest 350 firms in the United States against the average hourly earnings of production and nonsupervisory workers.
Total realized compensation includes:
- Base salary.
- Annual bonuses.
- The value of stock options exercised during the year.
- The value of stock awards vested during the year.
The "24-to-1" ratio specifically refers to the median compensation of CEOs in the 350 largest publicly traded companies relative to the median pay of workers in the same or similar sectors. It is important to note that this is an aggregate figure. Individual firms varied, but the 24-to-1 ratio is the widely accepted benchmark for the mid-1960s corporate landscape.
Comparative Evolution of Executive Pay
The trajectory of the pay gap from 1965 to the present day is marked by several distinct shifts. Following the 1960s, the gap remained relatively stable until the early 1980s. Starting in the mid-1980s, the ratio began to expand exponentially.
| Era | Approximate CEO-to-Worker Pay Ratio | Primary Driver |
|---|---|---|
| 1965 | 24:1 | Base salary and simple cash bonuses |
| 1989 | 61:1 | Increased use of stock options |
| 2000 | 383:1 | Peak of the dot-com equity bubble |
| 2020s | 300:1 – 399:1 | Complex equity compensation packages |
The shift from cash to equity-based compensation—encouraged in part by the 1993 change to the U.S. tax code (Section 162(m), which limited the deductibility of executive pay over $1 million unless it was "performance-based")—effectively decoupled CEO compensation from traditional salary caps. This transition allowed compensation to scale alongside the stock market, rather than being tethered to cost-of-living adjustments or standard corporate salary bands.
Factors Influencing the Expansion Since 1965
The widening of the pay gap is not attributed to a single cause but rather to a convergence of structural, legal, and market-based factors that have evolved since 1965.
1. The Rise of Institutional Shareholders
In 1965, corporate ownership was more fragmented. Today, large institutional investors (index funds and asset managers) hold significant blocks of shares. While these entities have the power to influence compensation, the complexity of modern firm operations and the competitive market for executive talent have led to the widespread adoption of "benchmarking." Compensation committees often set pay based on what peers are paying, creating a "ratchet effect" where executive salaries consistently move upward to remain competitive.
2. Stock-Based Compensation
As mentioned, the shift toward performance-based equity is the single most significant factor in the divergence from the 1965 ratio. By compensating executives primarily in stock options and restricted stock units (RSUs), the potential payout is uncapped. When the market performs well, CEO pay rises proportionally, regardless of whether the increase in value is due to the CEO's direct efforts or broader market trends.
3. Globalization and Talent Competition
The global market for executive talent has changed drastically since 1965. Boards of directors often seek leadership from a small pool of high-performing executives. The perceived necessity of paying a premium to attract or retain "star" talent has become a standard argument in corporate boardrooms, often pushing compensation packages far beyond what was standard in the mid-20th century.
Challenges in Comparing 1965 Data to 2026 Metrics
Researchers and policymakers attempting to utilize the 1965 data point must account for the fundamental differences in how corporations operate today versus sixty years ago.
- Corporate Complexity: Modern firms often have more layers of management and more complex international operations than the typical firm of 1965. This complexity is often used to justify higher pay for the individuals overseeing such diverse organizations.
- Tax Laws: The marginal tax environment in 1965 acted as a de facto ceiling on executive compensation. Because high earners kept a smaller fraction of every dollar earned, corporations had less incentive to offer astronomical pay, as it would not be "take-home" wealth for the executive.
- Measurement Consistency: While the 24-fold figure is a reliable estimate for 1965, comparing it to modern metrics requires careful adjustments for inflation and total compensation definitions. Standardized disclosure requirements mandated by the Securities and Exchange Commission (SEC) in the modern era provide a level of data granularity that simply did not exist for the 1965 cohort.
Socioeconomic Implications of Pay Disparity
The discussion surrounding the 24-fold gap is central to broader debates about economic inequality. Critics of current pay trends argue that the extreme divergence between executive and worker pay suppresses aggregate demand and creates social instability. They suggest that the 1965 model represented a more equitable distribution of productivity gains, where pay increases for the workforce were more closely aligned with the growth of the company.
Conversely, proponents of current market-based compensation argue that the 1965 figures are relics of a bygone, less efficient era. They contend that modern executive compensation is a logical response to the scale and complexity of the global economy. They argue that shareholders are the ultimate arbiters of value; if owners are willing to pay current premiums for executive management, the market is functioning as intended.
Frequently Asked Questions
Why is 1965 specifically used as a benchmark for CEO pay? Researchers frequently cite 1965 because it represents a period of significant prosperity and relatively egalitarian corporate pay structures before the radical changes in executive compensation that took root in the 1980s and 1990s. It serves as a pre-equity-compensation "baseline" for modern economic analysis.
Does the 24-fold gap include non-cash benefits? The 1965 data (24-to-1) is based on total realized compensation, including the primary forms of pay available at the time. Modern comparisons strive to include equity gains and bonuses to ensure the "all-in" cost of the CEO is being weighed against the total earnings of the average worker, keeping the methodology as consistent as possible.
How do current tax laws affect this ratio compared to 1965? In 1965, the top marginal income tax rate was substantially higher, which discouraged extreme salary payouts. Current tax codes often incentivize equity-based compensation through favorable treatment of capital gains, which theoretically encourages a longer-term focus for executives but also facilitates much higher total compensation levels.
Is it possible to return to a 24-fold ratio in today’s economy? Economic policy analysts note that returning to such a ratio would require massive structural shifts, such as new tax policies on executive compensation, changes to corporate governance laws, or a fundamental move away from stock-based pay. There is no current regulatory or market consensus that would force a return to the 1965 standard.
Recommendation for Further Research
For those interested in exploring the specifics of executive pay, the most reliable source for longitudinal data is the Economic Policy Institute's annual reports on CEO compensation. For those examining the legal and disclosure requirements that govern modern pay, the SEC’s Edgar database remains the official repository for executive compensation filings (Proxy Statements or DEF 14A) for all publicly traded U.S. companies. Analysts should look for the "Summary Compensation Table" in these filings to identify the specific components of total pay.