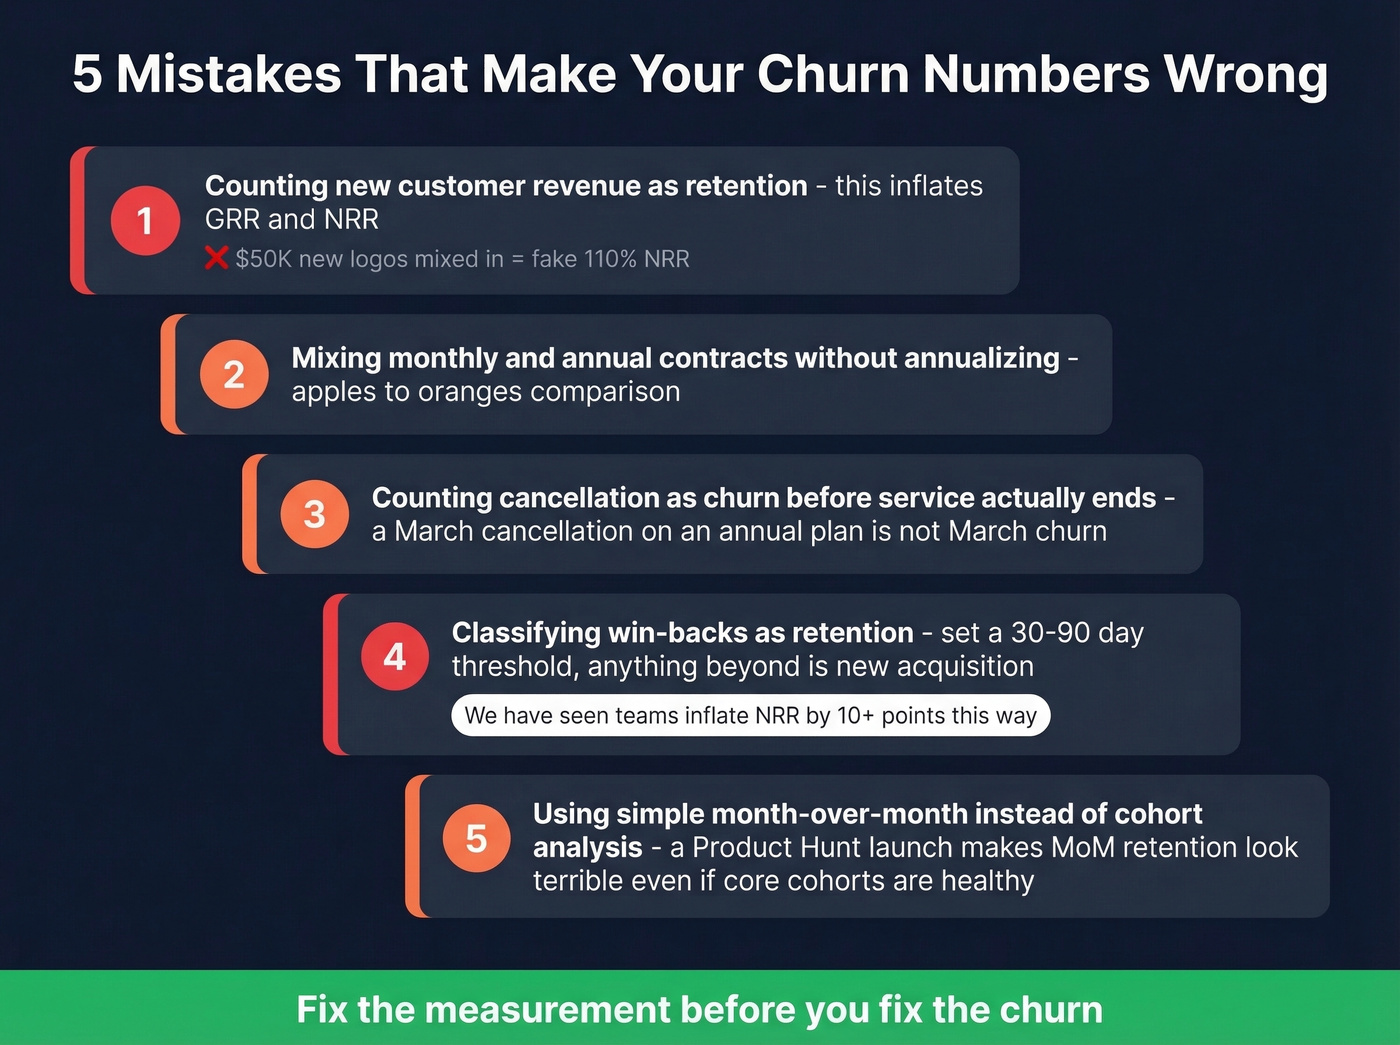
Annual churn represents the percentage of customers or revenue a subscription-based business loses over a twelve-month period. It serves as a definitive barometer for long-term product-market fit and operational health, directly influencing a company’s valuation, its ability to reinvest in growth, and the sustainability of its customer acquisition costs (CAC).
Managing annual churn has become the primary focus for subscription leaders in 2026. As the "subscription economy" matures, customers have become more discerning, and the cost of acquiring new users continues to climb. While monthly churn provides a tactical view of short-term volatility, annual churn offers the strategic perspective required for long-range financial planning. Businesses that fail to stabilize this metric often find themselves on a "treadmill," where they must acquire massive amounts of new business just to maintain a flat revenue line.
The Mathematical Foundation of Annual Churn
To address churn effectively, an organization must first define how it measures the loss. Not all churn is created equal, and conflating different types can lead to misguided strategies.
Gross vs. Net Revenue Churn
Gross Revenue Churn measures the total dollar amount lost from existing customers during the year. This includes cancellations and downgrades. It is a "pure" look at how much value is leaking out of the bucket. If a company starts the year with $1 million in Annual Recurring Revenue (ARR) and loses $100,000 of that specific revenue by year-end, the gross churn is 10%.
Net Revenue Churn provides a more holistic view of the existing customer base's health. It subtracts expansion revenue (upsells, cross-sells, and seat additions) from the gross churn figure. If that same company lost $100,000 but gained $120,000 through expansion from the remaining customers, they have -2% net churn. Achieving "negative churn" is widely considered the holy grail of subscription finance because it allows the business to grow even without acquiring a single new customer.
Logo Churn vs. Revenue Churn
Logo Churn tracks the number of individual accounts or "logos" lost. While important for understanding market share and brand sentiment, it can be deceptive. For example, if a SaaS provider loses 50 small-business accounts but retains its 5 enterprise accounts, logo churn might look high (e.g., 90%), but revenue churn might be negligible (e.g., 5%). Conversely, losing one "whale" client could result in low logo churn but catastrophic revenue churn.
The 2026 Landscape: Why Annual Metrics Matter Now
In 2026, the subscription market has moved beyond the "growth at all costs" era. Investors and stakeholders now prioritize Unit Economics and Efficiency Gaps. The shift toward annual contracts and multi-year renewals has made the annual churn rate more relevant than the monthly pulse.
Subscription Fatigue and The Great Rationalization
Modern consumers and enterprises are currently in a period of "subscription rationalization." After years of accumulating niche software and media services, users are auditing their recurring expenses. This behavior makes the annual renewal period a high-stakes event. If a service has not proven its value throughout the year, it is likely to be cut during these annual audits.
The Role of Artificial Intelligence in Retention
By 2026, predictive analytics have become standard. Businesses no longer wait for a cancellation notice to act. Machine learning models now analyze "signals" throughout the year—such as declining login frequency, reduced feature utilization, or frequent support tickets—to assign a "health score" to every account. High annual churn is often a symptom of failing to act on these signals in the months leading up to the renewal date.
Benchmarking Success: What is a "Good" Churn Rate?
Benchmarks vary significantly between Business-to-Business (B2B) and Business-to-Consumer (B2C) segments. B2B services generally enjoy lower churn because the "switching costs" are higher; integrating a new CRM or ERP system involves massive data migration and employee retraining. B2C services, such as streaming platforms or fitness apps, face much higher churn because they are easier to cancel and replace.
| Sector | Average Annual Gross Churn | Target "Top-Tier" Churn | Key Driver of Churn |
|---|---|---|---|
| Enterprise SaaS | 5% – 10% | < 5% | Integration depth and ROI |
| SMB B2B SaaS | 15% – 25% | < 12% | Business failure or budget cuts |
| Consumer Media | 30% – 50% | < 25% | Content fatigue and price sensitivity |
| E-commerce Boxes | 40% – 70% | < 35% | Perceived value over time |
| Education/EdTech | 20% – 40% | < 15% | Completion of learning goals |
The Root Causes of Annual Churn
Identifying why customers leave is the first step toward mitigation. Most churn can be categorized into four primary buckets:
1. Poor Product-Market Fit
If a customer realizes after six months that the product doesn't actually solve their core problem, they will not renew. This often stems from aggressive sales tactics where the product was "oversold" or marketed to the wrong audience.
2. Value Realization Deficit
In many cases, the product is capable of solving the problem, but the customer hasn't learned how to use it. If the onboarding process is weak or if "Customer Success" teams are reactive rather than proactive, the user may never reach the "Aha!" moment where the product becomes indispensable.
3. Involuntary Churn (Payment Failures)
A significant portion of annual churn is actually unintentional. Credit cards expire, are reported lost, or reach their limits. In 2026, sophisticated Payment Orchestration Layers and automated "dunning" systems (the process of communicating with customers to recover failed payments) are essential. According to Stripe, optimized billing logic can recover up to 40% of failed payments that would otherwise turn into churn.
4. Competitive Pressure and Pricing
As competitors enter the market with lower price points or more modern feature sets, loyal customers may be swayed. Pricing "shocks"—such as a sudden, unexplained 20% increase in the annual fee—are one of the most common triggers for voluntary cancellation.
Strategic Mitigation: Reducing Churn in 2026
Reducing annual churn requires a multi-departmental effort. It is not just the responsibility of the support team; it involves product, marketing, and sales.
The "Pre-Renewal" Sequence
The most successful companies begin their renewal strategy 90 days before the annual contract expires. This "pre-renewal" window includes:
- A "Value Audit": Sending the customer a report detailing exactly how much they used the service and the specific benefits they gained (e.g., "You saved 40 hours of manual labor this year using our automation").
- The Check-In Call: A Customer Success Manager (CSM) reaches out to identify any unresolved friction points before the billing department sends the invoice.
- Early Incentives: Offering a small discount or a feature upgrade in exchange for an early renewal.
Implementing Usage-Based Pricing
To combat "subscription fatigue," many 2026 leaders have moved toward hybrid pricing models. By combining a lower base annual fee with usage-based increments, businesses ensure that customers only pay for what they use. This reduces the "shelfware" effect, where a customer cancels an entire subscription because they only used 10% of the allocated seats.
Community and Ecosystem Building
When a product becomes part of a larger ecosystem, churn drops. This is why companies focus on building robust API libraries and community forums. If a customer has integrated your software with five other tools they use daily, the "technical debt" of leaving becomes a powerful retention tool.
Measuring Long-Term Impact: LTV and CAC
The ultimate financial reason to obsess over annual churn is its impact on Customer Lifetime Value (LTV). The formula for LTV is essentially the inverse of churn: $LTV = \text{Average Revenue Per Account} / \text{Churn Rate}$.
If you reduce your annual churn from 20% to 10%, you have effectively doubled the lifetime value of every customer you acquire. This allows you to spend more on marketing (CAC) while maintaining profitability, giving you a massive competitive advantage in 2026’s crowded advertising markets. A high LTV:CAC ratio (ideally 3:1 or higher) is the hallmark of a healthy, scalable subscription business.
Troubleshooting Common Retention Mistakes
Even with the best intentions, companies often fall into traps that inadvertently increase churn:
- Hiding the Cancellation Button: While this might prevent a cancellation today, it destroys brand trust and ensures the customer will never return. Dark patterns in UX are increasingly penalized by regulators in 2026.
- Ignoring the "Silent Majority": Companies often focus only on customers who complain. However, the customers who are most likely to churn are the ones who have stopped logging in and haven't said a word.
- Over-reliance on Discounts: Saving a customer with a 50% discount often just delays the churn. If the underlying value proposition isn't there, the customer will simply churn at the next renewal when the discount expires.
FAQs about Annual Churn
What is the difference between annual churn and annualized churn? Annual churn is the actual loss measured over a full 12-month period. Annualized churn is a projection based on shorter intervals. For example, if you lose 1% of your customers in January, you might "annualize" that rate to 12% for the year. While useful for forecasting, annualized rates can be misleading if your business has seasonal fluctuations.
Can annual churn ever be zero? In practice, a gross churn rate of zero is virtually impossible due to factors outside of a company's control, such as clients going out of business or changing their core industry. However, Net Revenue Churn can be zero or even negative if the expansion revenue from staying customers outweighs the losses from departing ones.
How does contract length affect churn reporting? If you only offer annual contracts, your churn will be "lumpy," with major spikes occurring during renewal months. If you offer both monthly and annual options, it is critical to segment your churn reports by contract type. Typically, annual-contract customers have a much higher retention rate than monthly-contract customers because they have already committed to a longer time horizon and undergone a deeper evaluation process.
Is logo churn or revenue churn more important? For financial health and valuation, revenue churn is the primary metric. However, for product teams and marketers, logo churn is often more informative. High logo churn among small users might indicate that your "low-end" offering is weak, while stable revenue from large users suggests your enterprise product is strong.
What is the "Renewal Cliff"? The "Renewal Cliff" refers to the high percentage of churn that occurs at the exact 12-month mark of a subscription. This is often caused by "set-and-forget" customers who only re-evaluate their purchase when they see the large annual charge on their credit card statement or bank account.
Practical Recommendation: Your Next Actions
To effectively manage annual churn in 2026, businesses should move beyond reactive support and toward proactive Customer Health Management. Start by auditing your current billing data to separate gross churn from net churn. If your gross churn is above the industry benchmark for your sector, initiate a "Win-Back" campaign targeting recently churned users to understand their "Exit Why."
Simultaneously, implement a predictive health-scoring system. Identify the three key behaviors that correlate most strongly with long-term retention (e.g., completing a specific setup task or reaching a certain usage threshold) and task your Customer Success team with ensuring every new account hits those milestones within the first 60 days. By the time the annual renewal invoice arrives, the value should be so obvious that the renewal becomes a non-event.