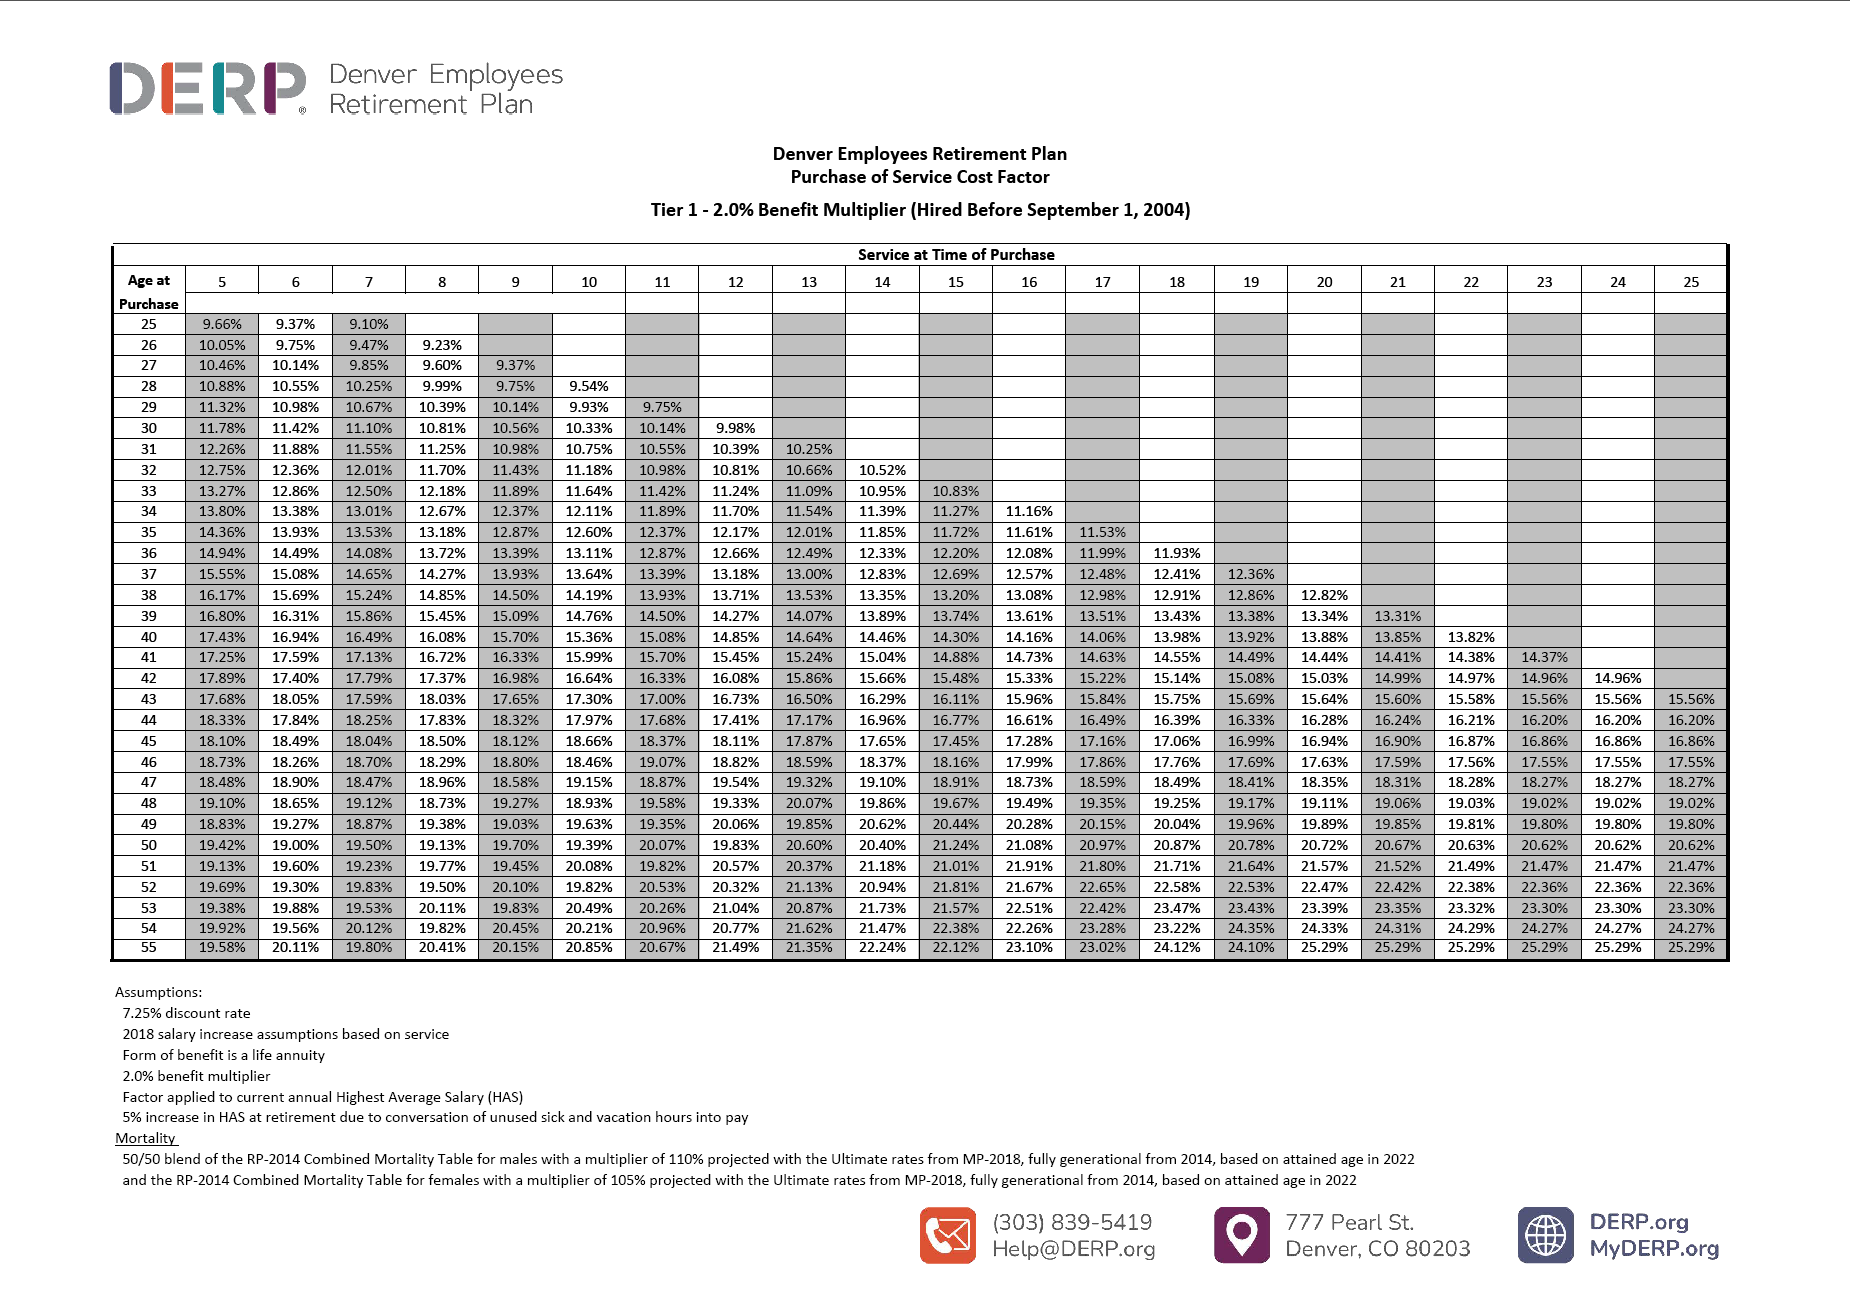
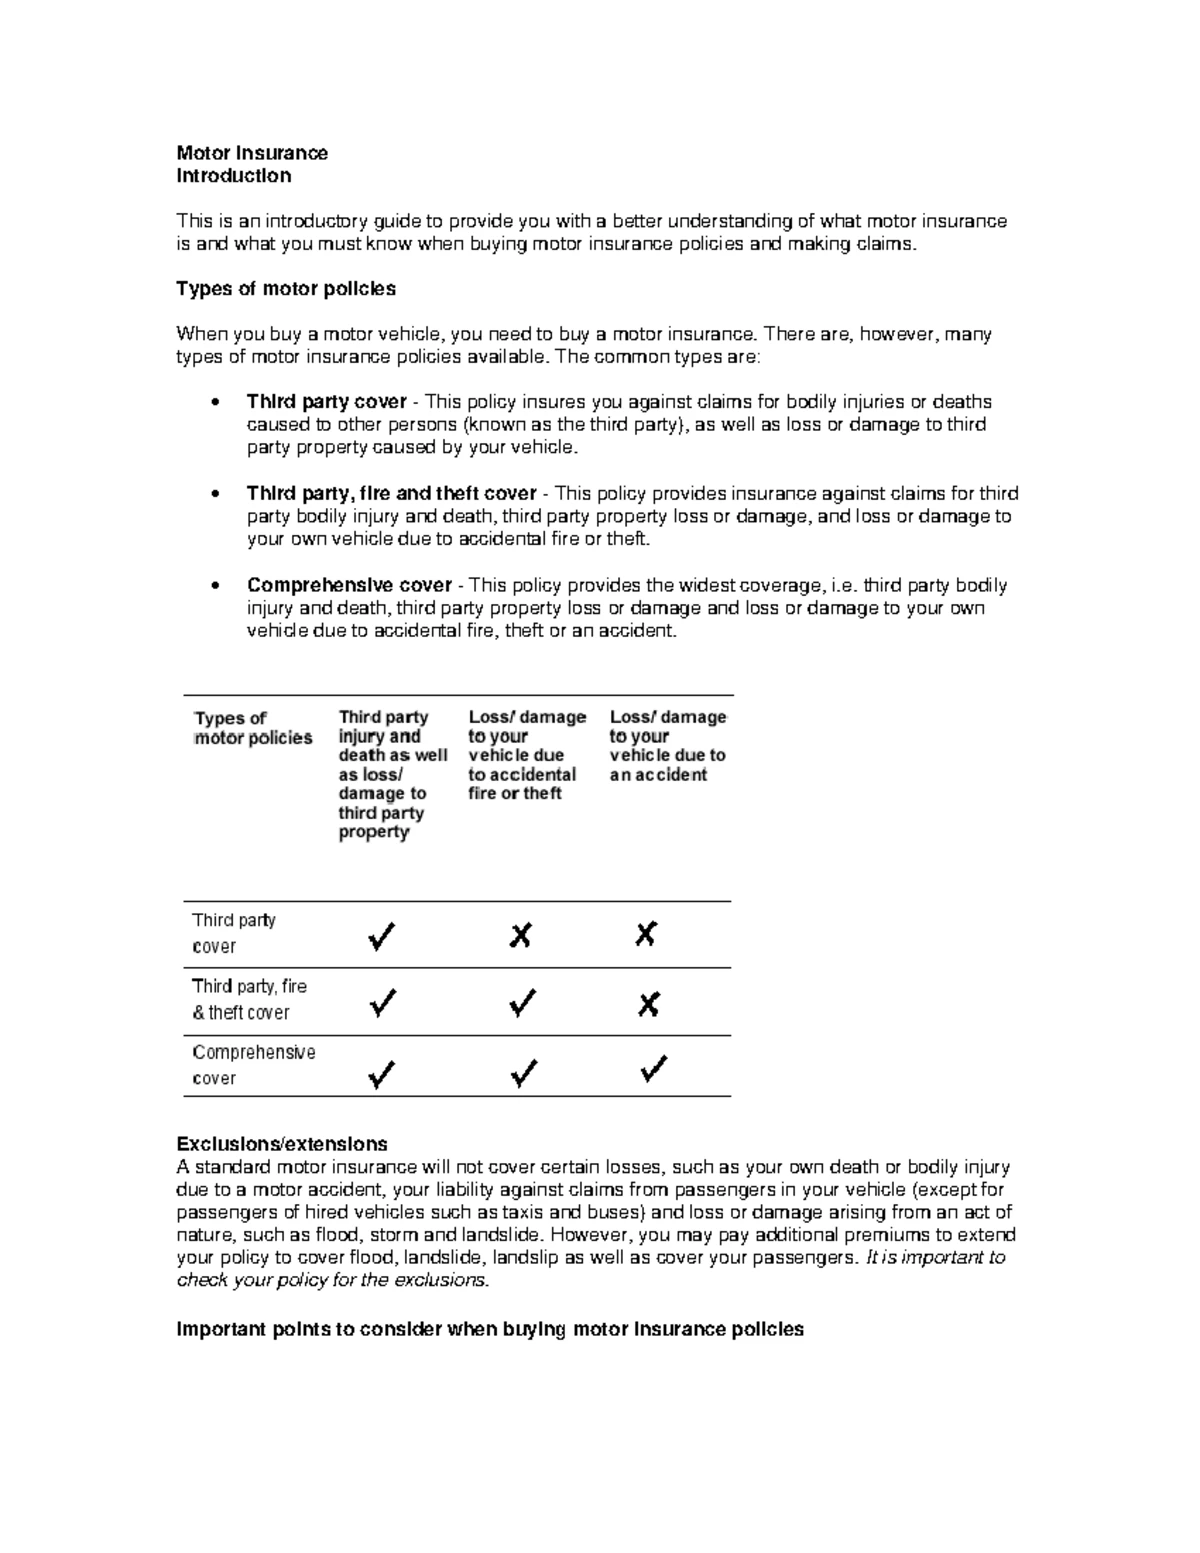
An actuarial table in auto insurance is a statistical database used by insurance companies to predict the probability of a driver filing a claim. By analyzing variables like age, location, and vehicle type, these tables allow actuaries to determine the "pure premium"—the exact amount needed to cover the expected cost of future losses.
Actuarial science remains the bedrock of the global insurance industry. In 2026, while artificial intelligence and machine learning have accelerated the speed of data processing, the fundamental principles of the actuarial table continue to dictate what you pay for auto insurance. These tables are not merely lists of numbers; they are complex mathematical models that translate human behavior and environmental hazards into financial risk. Understanding how these tables function is essential for any consumer or professional looking to navigate the complexities of modern premiums and policy structures.
The Core Function of Actuarial Tables in Risk Assessment
At its most basic level, an actuarial table is a tool for categorization. Insurance is the process of pooling risk, where the premiums of many pay for the losses of a few. For this system to be sustainable, an insurance provider must accurately predict how many "losses" (accidents, thefts, or weather damage) will occur within a specific group of policyholders.
Actuaries use historical data to build these tables. For example, if data from the last ten years shows that 18-year-old male drivers in urban environments have a 25% higher chance of being involved in a collision compared to the general population, the actuarial table will reflect this as a higher risk coefficient. In 2026, these tables have become increasingly granular, moving beyond simple demographics to incorporate real-time environmental data and historical infrastructure safety ratings.
The primary goal is to achieve "actuarial equity." This means that every policyholder pays a premium that is proportionate to the risk they bring to the pool. Without these tables, low-risk drivers would essentially be subsidizing high-risk drivers to an unsustainable degree, leading to "adverse selection," where only high-risk individuals seek insurance, eventually causing the insurer to become insolvent.
Key Variables Within Auto Insurance Actuarial Tables
Modern actuarial tables in 2026 analyze hundreds of variables, but they generally cluster into four primary categories: demographic data, geographic data, vehicle characteristics, and behavioral history. Each of these categories is assigned a weight based on its statistical correlation with the frequency and severity of insurance claims.
Demographic Data and the U-Shaped Risk Curve
Demographics have long been the primary pillar of actuarial science. Age is perhaps the most significant variable. Actuarial tables consistently show a "U-shaped" risk curve.
- Young Drivers (16–25): This group represents the highest frequency of claims. The lack of driving experience combined with a statistically higher propensity for risk-taking behavior leads to high coefficients in actuarial tables.
- Middle-Aged Drivers (30–60): This is the "trough" of the U-curve. These drivers typically have the lowest risk profile due to experience and lifestyle stability.
- Senior Drivers (70+): Risk begins to rise again in this bracket. While senior drivers often have high experience, actuarial tables account for declining reaction times and a higher "severity" of medical claims following an accident.
Geographic Risk and Environmental Factors
Where a vehicle is parked and driven is often as important as who is driving it. Actuarial tables utilize "territorial rating" to assess risk by zip code. In 2026, these tables are heavily influenced by urban density, local crime rates (for comprehensive coverage against theft), and even the quality of local road infrastructure.
Furthermore, climate data is now a permanent fixture in auto insurance actuarial tables. Regions prone to frequent hail, flooding, or wildfires see higher premiums for comprehensive coverage because the actuarial probability of a "total loss" event is statistically higher in those coordinates.
Vehicle Safety and Repairability
The actuarial table also evaluates the machine itself. Two cars of the same value might have very different insurance costs because of their "loss history." Actuaries look at:
- Safety Ratings: Data from the Insurance Institute for Highway Safety (IIHS) is integrated into tables to determine how well a car protects its occupants.
- Repair Costs: High-tech vehicles with expensive sensors (LIDAR, RADAR) often have higher actuarial risk scores for "severity" because a minor fender bender can cost thousands of dollars to recalibrate specialized equipment.
- Theft Rates: Specific makes and models appear more frequently in theft databases, increasing the risk for comprehensive claims.
Frequency vs. Severity: The Actuarial Equation
When actuaries build auto insurance tables, they are solving for two main variables: Frequency and Severity.
- Claim Frequency: This is the probability that a claim will occur at all. For example, a driver who commutes through a high-traffic corridor in a major city has a high frequency risk.
- Claim Severity: This is the projected cost of the claim if it does occur. A luxury vehicle or a driver who frequently travels at high speeds on highways carries a high severity risk because the financial payout for repairs or medical bills will likely be much higher.
The "Pure Premium" is calculated by multiplying Frequency by Severity ($F \times S = P$). The actuarial table provides the data points for both sides of that equation. Once the pure premium is established, the insurance company adds "loading factors," which include administrative costs, taxes, and a profit margin, to arrive at the final premium the consumer sees on their bill.
The Role of Telematics and Real-Time Data in 2026
The most significant evolution in actuarial tables over the last decade has been the shift from "Static Tables" to "Dynamic Tables" via telematics. Traditional actuarial tables are based on "proxies" for risk—things like your age or credit score that suggest how you might drive.
Telematics—using GPS and onboard diagnostics—allows actuaries to replace proxies with actual behavior. In 2026, many actuarial tables now incorporate data points such as:
- Braking and Acceleration: Sudden movements suggest aggressive driving habits.
- Time of Day: Driving between midnight and 4:00 AM is statistically more dangerous, leading to higher risk scores in the table.
- Cornering: How a driver handles turns provides insight into their control of the vehicle.
This "Usage-Based Insurance" (UBI) means the actuarial table is no longer a fixed document updated once a year; for many drivers, it is a living algorithm that adjusts their risk profile based on their most recent 1,000 miles driven.
Comparative Risk Profiles: A Sample Actuarial Outlook
The following table illustrates how different variables influence the risk coefficient in a standard 2026 actuarial model. A coefficient of 1.0 represents the "baseline" or average risk.
| Driver Profile Variable | Risk Category | Estimated Risk Coefficient | Impact on Premium |
|---|---|---|---|
| Age 16-19 | Very High | 2.5 - 3.5 | Significant Increase |
| Age 40-50 | Low | 0.7 - 0.9 | Significant Discount |
| Urban Zip Code | Moderate/High | 1.3 - 1.6 | Moderate Increase |
| Rural Zip Code | Low | 0.8 - 1.0 | Slight Discount |
| Clean Driving Record (5 yrs) | Low | 0.85 | Standard Discount |
| One At-Fault Accident | High | 1.5 - 2.0 | Moderate/High Increase |
| Advanced Safety Suite (ADAS) | Lower Severity | 0.90 | Safety Credit |
| High Performance Sports Car | High Severity | 1.8 - 2.2 | Significant Increase |
Note: These coefficients are illustrative of industry-standard modeling used by organizations like the Casualty Actuarial Society (CAS) and may vary by state regulations and specific carrier proprietary data.
Regulatory Oversight of Actuarial Tables
It is a common misconception that insurance companies can set any price they want based on their tables. In reality, actuarial tables are subject to intense scrutiny by state Departments of Insurance. In the United States, the National Association of Insurance Commissioners (NAIC) provides a framework for these regulations.
Regulators ensure that the tables are:
- Not Unfairly Discriminatory: Actuaries cannot use certain protected characteristics (like race or religion) in their tables. In 2026, several states have also moved to ban or limit the use of gender and credit scores in actuarial modeling.
- Actuarially Sound: The rates must be based on actual statistical evidence. An insurer cannot arbitrarily double the rates for red cars unless they can prove, through data, that red cars are involved in more frequent or severe accidents.
- Adequate but Not Excessive: The tables must ensure the company stays solvent (adequate) without price-gouging the consumer (excessive).
Common Misconceptions About Actuarial Tables
"The Table Labels Me a Bad Driver"
An actuarial table does not measure your individual skill or character; it measures the statistical performance of the group you belong to. You might be a highly skilled 19-year-old driver, but because the group "19-year-old males" has a high frequency of claims, the table assigns a higher risk. This is why telematics has become popular, as it allows individuals to "break away" from their demographic group by proving their individual safety.
"Actuarial Tables Never Change"
Actuarial tables are updated constantly. If a new safety feature (like automatic emergency braking) becomes standard in all new cars, actuaries will track its impact. If the data shows a 15% reduction in rear-end collisions, the actuarial table will be adjusted to lower the risk coefficient for vehicles equipped with that technology.
"Only Accidents Impact the Table"
Actuarial tables for auto insurance also consider "non-collision" events. This includes comprehensive claims like windshield chips, theft, and weather damage. Even if you have never hit another car, living in an area where the actuarial table shows a high probability of flood or hail will keep your premiums higher.
Frequently Asked Questions
Can I see my own actuarial profile?
You cannot see a single "actuarial score" because every insurance company uses its own proprietary table. However, you can access the data that feeds into these tables by requesting your C.L.U.E. report (Comprehensive Loss Underwriting Exchange) from LexisNexis. This report lists your claim history for the past seven years, which is the primary data point actuaries use to categorize you.
Do actuarial tables account for inflation?
Yes. Actuaries must account for "trend factors." In 2026, if the cost of labor and car parts rises by 5% annually, the actuarial table is adjusted so that the "Severity" side of the equation remains accurate. This ensures that the premiums collected today will be enough to pay for repairs that happen six months from now.
How do gender-neutral rating laws affect these tables?
In jurisdictions that have mandated gender-neutral pricing, actuaries must remove gender as a variable. To compensate for the loss of this data point, they often weigh other factors more heavily, such as years of driving experience or education level, provided those variables are legally permissible and show a statistical correlation with risk.
What is the difference between a mortality table and an auto insurance table?
A mortality table is used in life insurance to predict the probability of death at a certain age. An auto insurance actuarial table is a morbidity/casualty table; it predicts the probability of an accident or property damage. While both use similar statistical methods (like the Law of Large Numbers), the auto insurance table is much more volatile and reactive to changes in technology and environment.
How do autonomous driving features impact actuarial tables in 2026?
As of 2026, Level 2 and Level 3 autonomous features have created a shift in actuarial modeling. While these features reduce "Frequency" (fewer human-error accidents), they have increased "Severity" (the cost to fix a sensor-laden bumper). Actuaries are currently balancing these two opposing forces to determine the long-term impact on premiums.
Practical Recommendations
To benefit from how actuarial tables work, you should focus on moving yourself into "lower-risk" categories within the data:
- Leverage Individualization: If you are in a high-risk demographic (e.g., young driver or living in a high-traffic city), opt into a telematics program. This allows you to be judged on your actual behavior rather than the actuarial average of your peer group.
- Choose "Actuarially Friendly" Vehicles: Before buying a car, check its insurance group rating. Vehicles with high safety scores and lower repair costs sit in more favorable positions on actuarial tables.
- Maintain Continuous Coverage: Actuaries have found a correlation between "lapses in coverage" and higher risk. Maintaining a continuous insurance history, even if you don't own a car (via a non-owner policy), keeps you in a lower risk bracket.
- Audit Your Data: Ensure your zip code and annual mileage are accurately reported. If you moved from a city to a suburb or now work from home, the actuarial table for your new situation likely carries a lower risk coefficient.