As of the current reporting period in the spring of 2026, laboratory-confirmed influenza cases are trending downward across the majority of the Northern Hemisphere. While surveillance data indicates a significant decrease from the winter peaks of Influenza A, public health officials continue to monitor localized "second waves" of Influenza B, which typically circulate later in the spring season.
The Current State of the 2025-2026 Flu Season
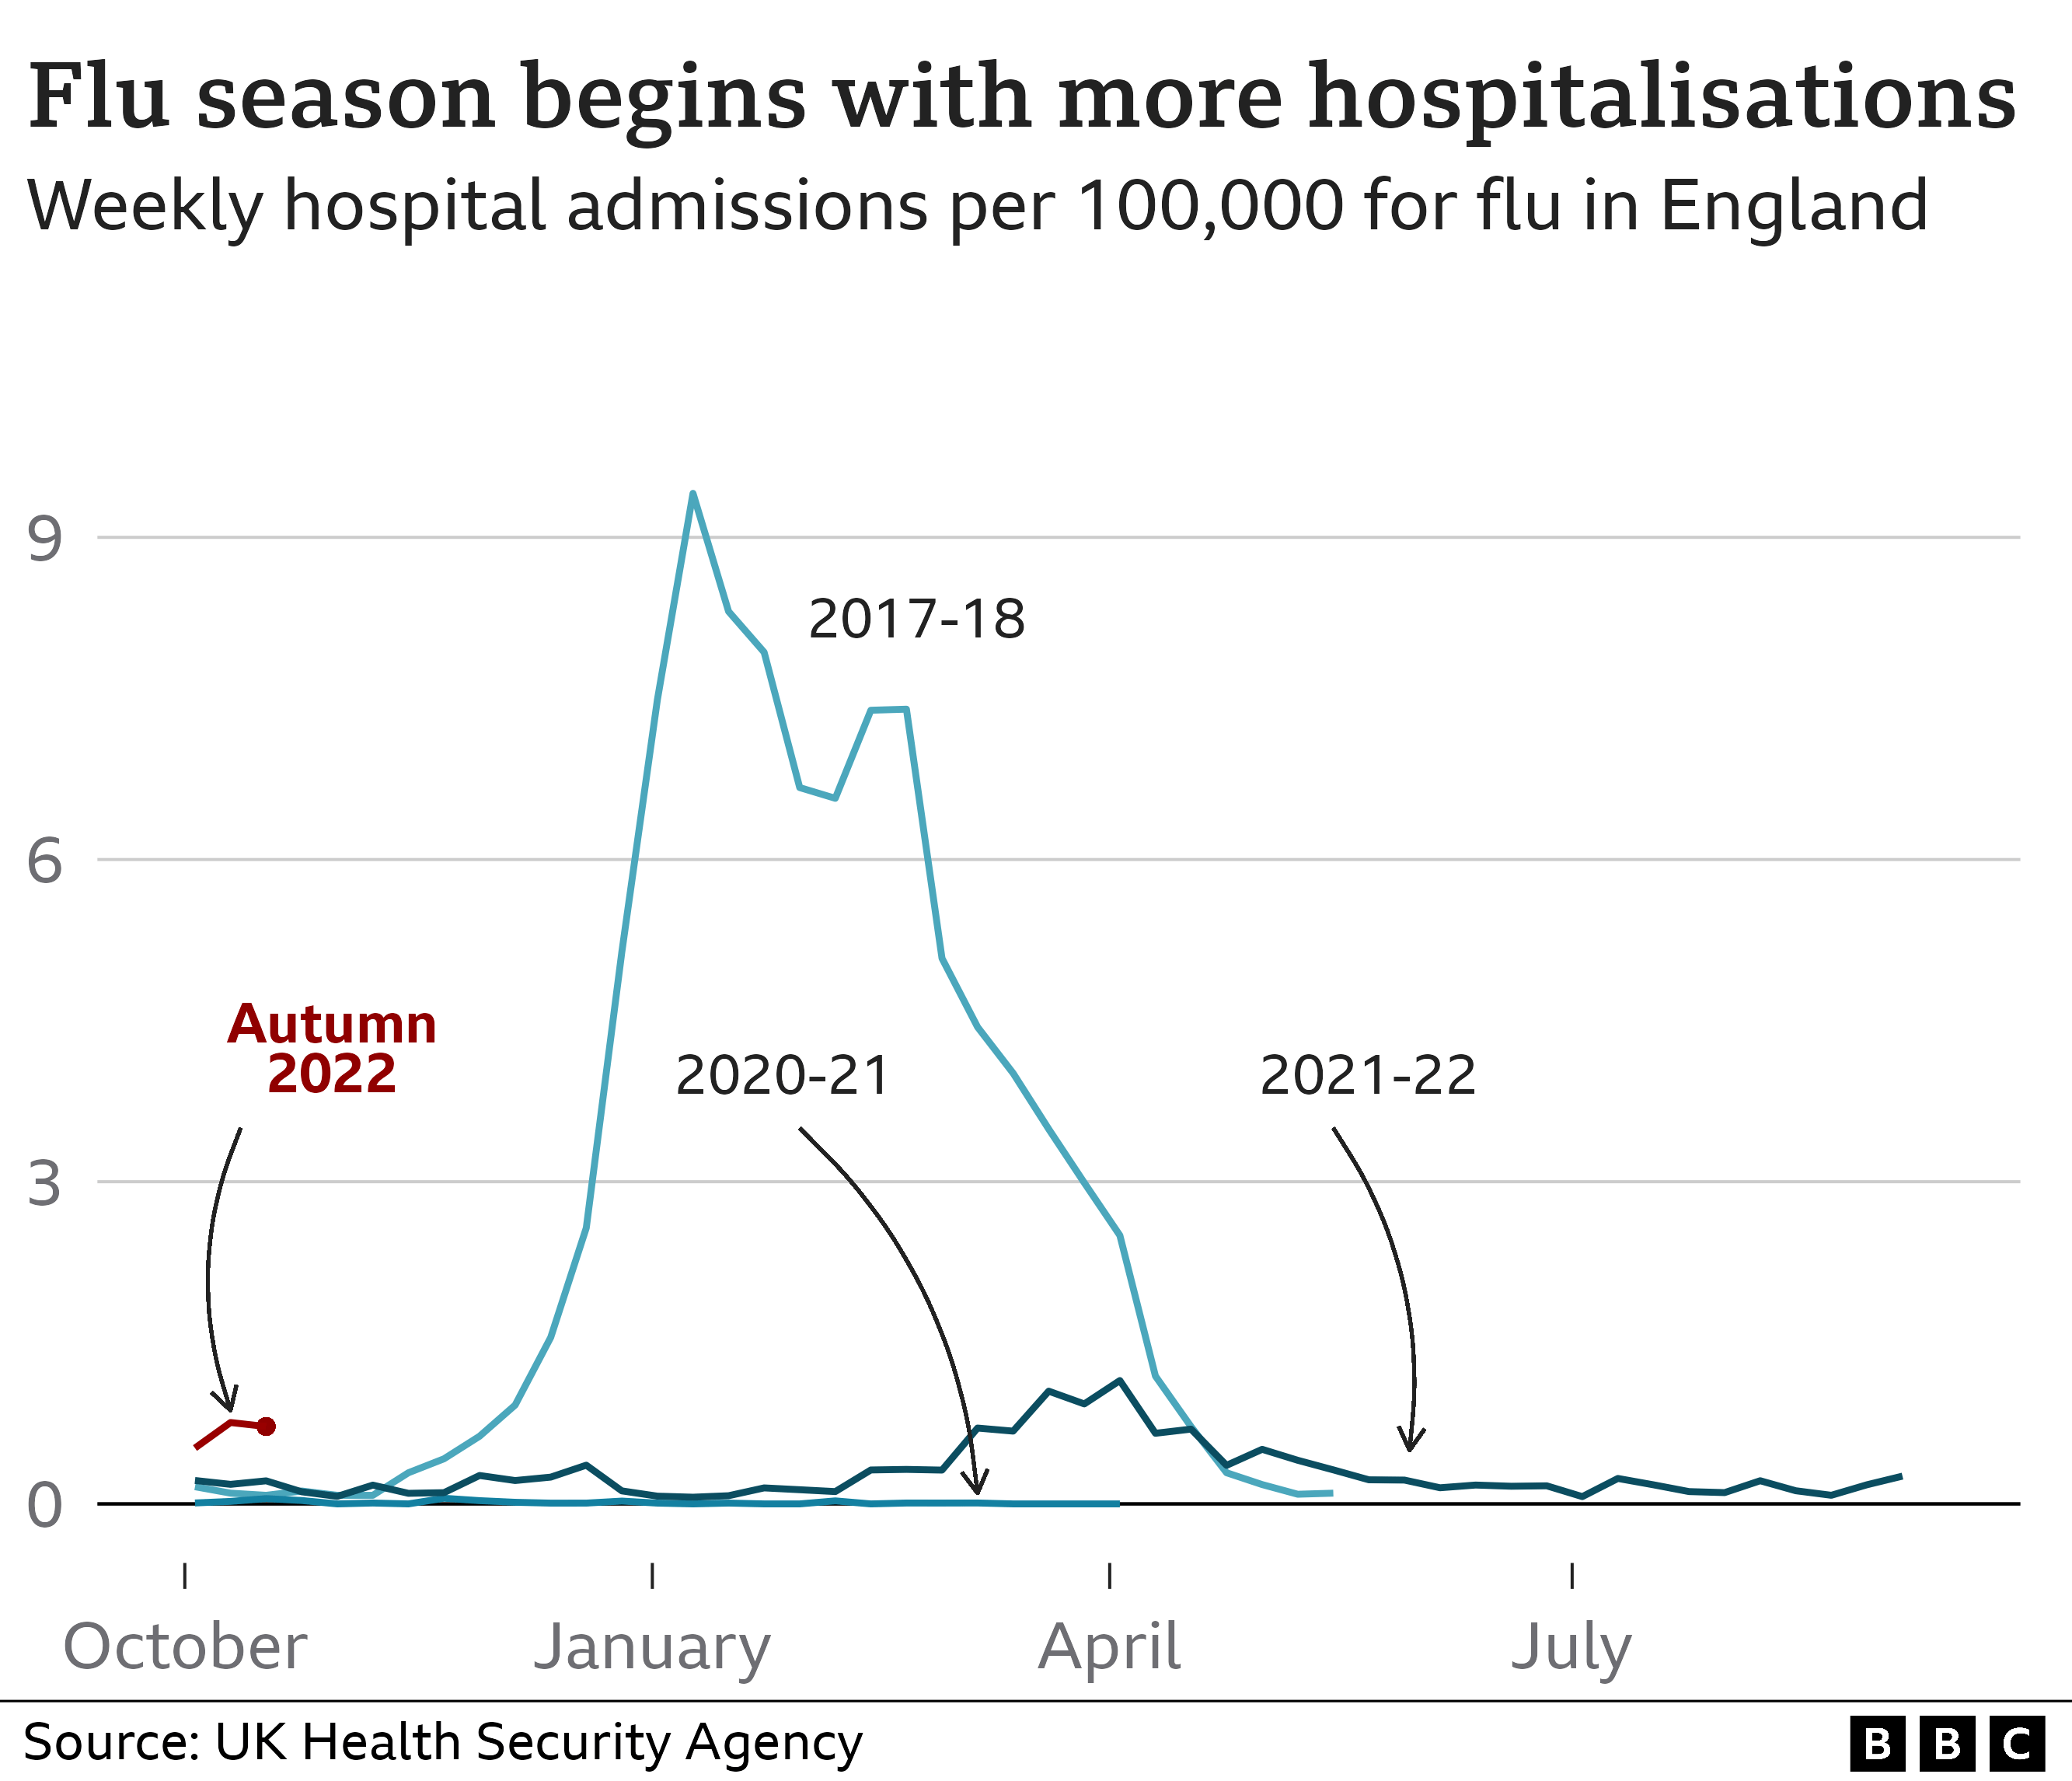
To determine if flu cases are truly going down, epidemiologists look at a combination of laboratory test positivity, outpatient visits for respiratory illness, and hospital admission rates. For the 2025-2026 season, the data suggests we have moved past the primary peak. National surveillance systems, such as the CDC’s FluView in the United States and the World Health Organization’s (WHO) Global Influenza Programme, show a steady week-over-week decline in the percentage of specimens testing positive for influenza viruses.
During the height of the season in late December 2025 and early January 2026, many regions saw test positivity rates exceeding 25%. Currently, those numbers have dipped into the single digits in most jurisdictions. However, "going down" is a relative term that varies by specific virus strain and geographic location. While Influenza A (specifically H1N1 and H3N2) has seen a sharp decline, Influenza B activity remains present, often causing a plateau in the decline rather than a total disappearance of the virus.
Analyzing the Decline by Virus Type
Influenza viruses are not a monolith. The trajectory of a flu season is often determined by the interplay between different strains. In 2026, we have observed a classic biphasic pattern:
- Influenza A (H1N1 and H3N2): These strains typically dominate the early and mid-winter months. Their decline is the primary driver behind the overall "downward trend" reported by national health agencies.
- Influenza B (Victoria Lineage): Historically, Influenza B tends to increase as Influenza A wanes. While the overall case numbers are lower than the January peak, the persistence of Influenza B means that the virus is still circulating in schools and workplaces, even if the "emergency" phase of the season has passed.
Understanding Surveillance Metrics: Why "Down" Can Be Deceptive
When public health experts say flu cases are going down, they rely on several specific metrics. Understanding these can help individuals make informed decisions about their own health risks.
Laboratory Test Positivity
This is the most direct measure of viral activity. It represents the percentage of respiratory samples sent to clinical and public health laboratories that test positive for influenza. A decline in this number is the most reliable indicator that the community spread is slowing. In mid-2026, we are seeing positivity rates drop from 15-20% down to approximately 3-5% in most metropolitan areas.
ILINet and Outpatient Visits
The U.S. Outpatient Influenza-like Illness Surveillance Network (ILINet) tracks the percentage of patient visits to healthcare providers for symptoms like fever, cough, and sore throat. This metric is "syndromic," meaning it tracks symptoms rather than confirmed tests. While ILI (Influenza-like Illness) rates are going down, they often remain above the national baseline for several weeks after the laboratory peak because other respiratory viruses, such as RSV or common cold rhinoviruses, often fill the vacuum left by the flu.
Hospitalization and Mortality Rates
These are "lagging indicators." It takes time for an infection to progress to a severity requiring hospitalization, and even longer for mortality data to be finalized. Consequently, even when new cases are going down, hospital wards may still be full of patients who were infected two to three weeks prior. In the 2026 season, hospitalization rates began their significant descent approximately three weeks after the peak in laboratory-confirmed cases.
Regional Variations: Is the Flu Still High Near You?
The "national average" of flu cases often masks significant regional disparities. While the overall trend for 2026 is downward, specific regions may still be experiencing high activity.
The North-South Divide
In the Northern Hemisphere, flu seasons often move in waves across different latitudes. In 2026, southern regions experienced an earlier peak and an earlier decline. Conversely, northern states and Canadian provinces often see their activity linger longer into the spring due to colder temperatures and more indoor gatherings.
Urban vs. Rural Trends
Densely populated urban centers usually see rapid spikes and rapid declines because the virus can spread through the population quickly. In contrast, rural areas may see a "slower burn," where cases don't peak as high but take much longer to go down. This means that while a major city might report a return to baseline activity, a rural county just 50 miles away might still be seeing a steady stream of new infections.
Factors Contributing to the 2026 Decline
Several factors have converged to drive flu cases down during the first half of 2026.
Vaccination Coverage and Efficacy
The 2025-2026 influenza vaccine formulation was well-matched to the circulating strains of H1N1 and Influenza B. High uptake in the autumn of 2025 created a level of community immunity that shortened the duration of the peak. By the time the weather began to warm in 2026, the pool of "susceptible" individuals had shrunk significantly, making it harder for the virus to find new hosts.
Environmental Factors
Influenza viruses thrive in cold, dry air. As humidity levels rise and temperatures increase in the spring of 2026, the physical stability of the virus in the air decreases. Furthermore, as people spend more time outdoors and open windows for ventilation, the concentration of viral particles in indoor spaces drops, leading to a natural decline in transmission.
Behavioral Adaptations
Following several years of heightened awareness regarding respiratory hygiene, the 2026 population remains more likely to stay home when symptomatic compared to pre-2020 norms. This "social distancing by choice" has been a significant factor in breaking chains of transmission, contributing to the faster decline seen this season.
Comparing the 2025-2026 Season to Previous Years
To understand the current decline, it is helpful to look at how this season stacks up against the historical record.
| Metric | 2023-2024 Season | 2024-2025 Season | 2025-2026 (Current) |
|---|---|---|---|
| Peak Positivity Rate | ~16% | ~22% | ~18% |
| Dominant Strain | Mixed A/B | H3N2 (Severe) | H1N1 / B Victoria |
| Peak Month | February | January | Late December |
| Duration of High Activity | 12 Weeks | 15 Weeks | 10 Weeks |
| Vaccine Match | Moderate | High | High |
The data in the table illustrates that the 2025-2026 season was relatively "standard" in its timing and severity. The fact that cases are going down earlier (starting in late January/early February) compared to the 2023-2024 season suggests that the combination of vaccine efficacy and early-season immunity was particularly effective this year.
The Risks of the "Tail End" of the Season
Even when flu cases are going down, the risk is not zero. The "tail" of the flu season—the period from March to May—can still see thousands of infections.
The Threat to High-Risk Groups
For the elderly, very young children, and those with compromised immune systems, even a "low" level of community spread is dangerous. While the general public may stop taking precautions once they hear cases are declining, high-risk individuals should remain vigilant until the WHO or CDC officially declares the season over.
Potential for Antigenic Drift
Rarely, a flu virus can undergo a minor mutation (antigenic drift) late in the season, allowing it to re-infect people who were already sick or those who were vaccinated. While there is currently no evidence of this in the 2026 data, public health labs continue to sequence the genome of the virus to ensure that the downward trend isn't interrupted by a new variant.
Practical Steps During the Seasonal Decline
As we witness flu cases going down, it is tempting to abandon all hygiene protocols. However, the tail end of the season is the ideal time to focus on recovery and prevention of other lingering respiratory illnesses.
- Monitor Local Health Dept. Reports: Don't rely solely on national news. Check your state or county health department’s dashboard for local "Percent Positivity" rates.
- Continue Hand Hygiene: Handwashing remains the most effective defense against the "fomite" transmission of Influenza B, which can live on surfaces longer than some other respiratory viruses.
- Ventilate Indoor Spaces: If you are hosting gatherings, keep windows cracked. Even as flu cases drop, better ventilation reduces the risk of all airborne pathogens.
- Still Get Vaccinated? If you missed your flu shot and the virus is still circulating in your specific area, it is often still recommended through May, especially if you are traveling to the Southern Hemisphere where their season is just beginning.
Summary of Surveillance Findings
The consensus among health authorities in early 2026 is that the worst of the season has passed. National ILI (Influenza-like Illness) levels have dropped below the epidemic threshold in most regions. While secondary peaks of Influenza B are possible, they rarely reach the healthcare-system-straining levels seen during the primary winter peak.
The focus of public health has now shifted toward analyzing the 2025-2026 data to prepare for the 2026-2027 northern hemisphere formulation, which is typically decided in late February or March.
Frequently Asked Questions
1. Does a decline in cases mean I can stop wearing a mask in high-risk areas?
While mandates have largely disappeared by 2026, the decision to mask should be based on local transmission levels. If your local "Percent Positivity" is still above 5%, high-risk individuals should consider maintaining precautions in crowded indoor settings like public transit or healthcare facilities, even if the national trend is downward.
2. Why is the flu still spreading in schools if cases are going down?
Schools are "closed ecosystems" where transmission can remain high even when the broader community shows a decline. Children are primary drivers of Influenza B, which often peaks later in the spring. Therefore, school-based outbreaks may continue for several weeks after the adult population sees a significant drop in cases.
3. If I get the flu now, will it be less severe than in December?
The severity of the flu is determined by the strain and your immune system, not the time of year. However, because hospital systems are less stressed in the spring, you may have faster access to care and antiviral treatments like oseltamivir (Tamiflu) or baloxavir (Xofluza), which can improve outcomes if taken within 48 hours of symptom onset.
4. How do I know if cases are going down in my specific city?
The best resource is your local or state Department of Health website. Most states provide a "Weekly Respiratory Virus Bulletin" or "Flu Report" that breaks down data by county. Look for the "Epidemic Curve" or "Epicurve" graph; if the line is pointing toward the bottom right of the chart, cases are going down in your area.
5. When does the 2025-2026 flu season officially end?
Public health agencies typically track the flu year-round, but the "seasonal" reporting usually concludes around Week 20 of the calendar year (mid-May). By this point, activity is usually at "inter-seasonal" levels, meaning only sporadic cases are detected.
Next Actions and Recommendations
If you have been waiting for flu cases to go down before scheduling non-emergency medical procedures or visiting vulnerable relatives, the current 2026 data suggests it is becoming safer to do so in most regions. However, you should verify your local transmission rate one last time through a reliable source like the CDC FluView or the WHO FluNet portal. If you are symptomatic, regardless of the downward trend, stay home and test to prevent a localized resurgence.