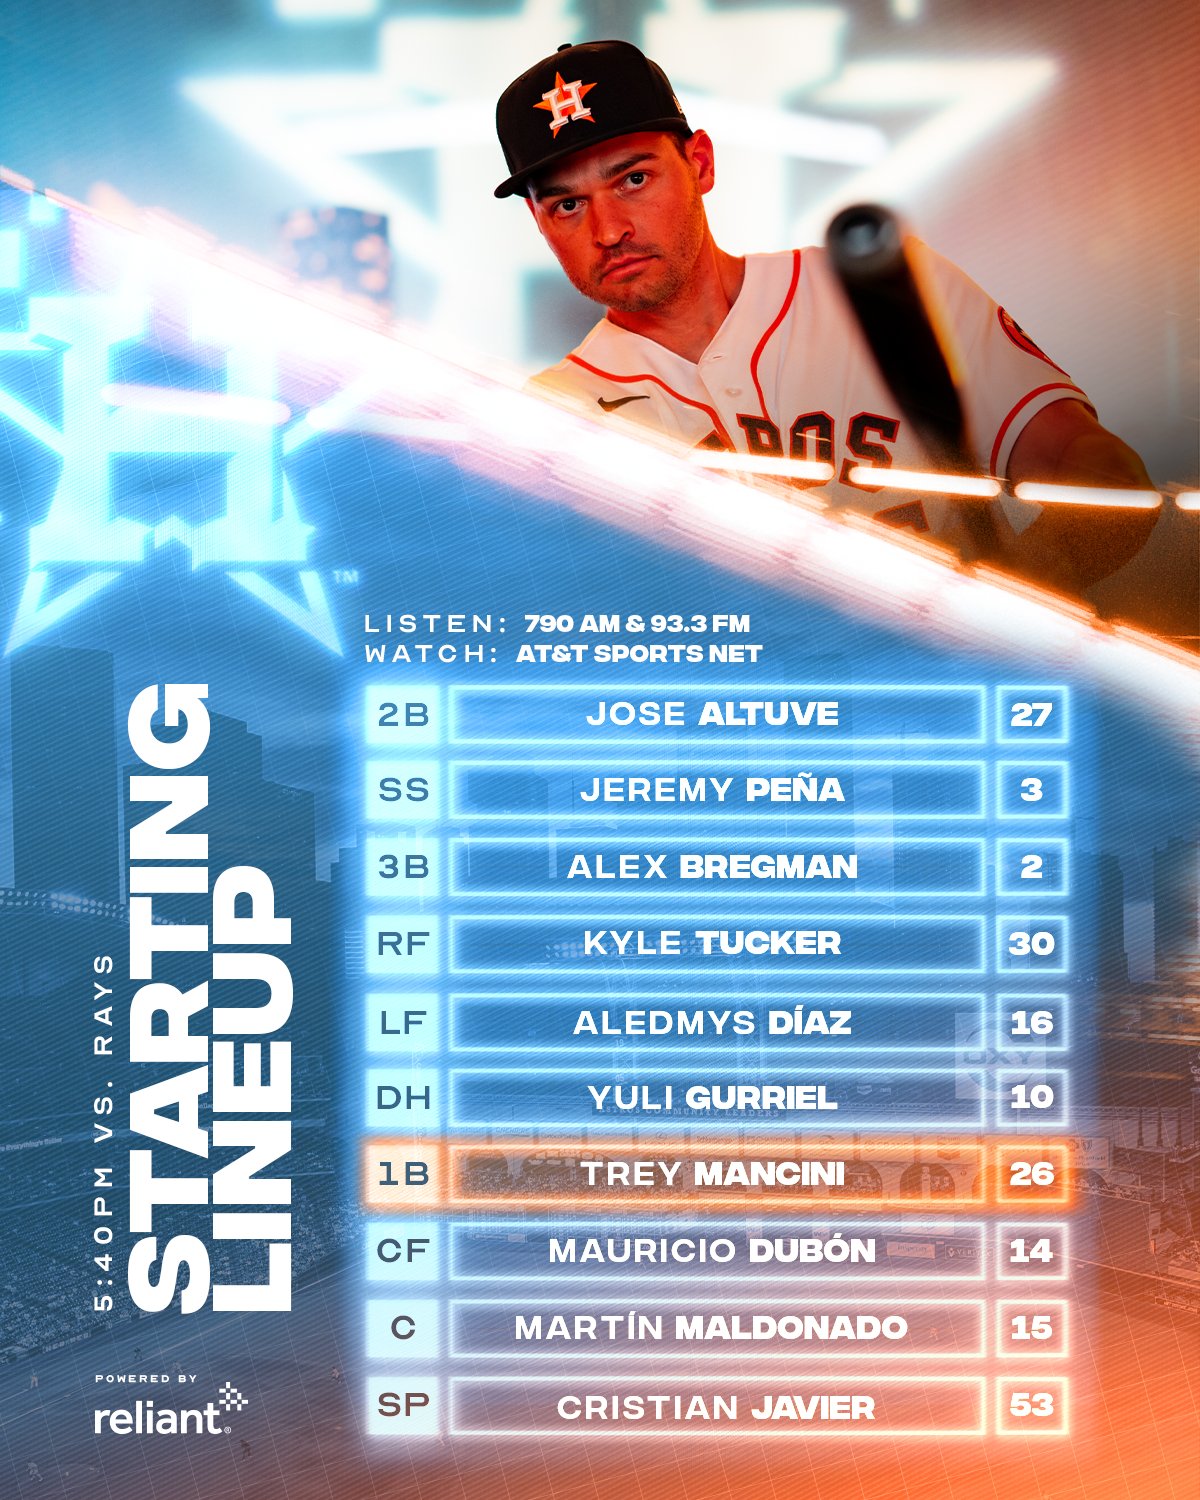
To access a complete event chronology of a Houston Astros game, you must consult play-by-play (PBP) logs, which document every pitch, substitution, and ball-in-play in sequential order. These records are available through official MLB sources like Gameday, historical archives like Baseball-Reference and Retrosheet, and advanced tracking platforms such as MLB Savant.
For fans, researchers, and sports analysts, a play-by-play (PBP) report is the ultimate diagnostic tool for a baseball game. While a standard box score provides a summary of outcomes, the event chronology provides the context: the "how" and "when" behind the "what." In the modern era of the Houston Astros—spanning from their 1962 debut as the Colt .45s to their established dominance in 2026—the methodology for tracking these events has evolved from manual scorekeeping to high-fidelity radar and optical tracking systems.
The Anatomy of a Complete Event Chronology
A comprehensive play-by-play log is more than just a list of hits and outs. It is a structured data set that records the state of the game at every possible juncture. To understand an Astros game chronology, one must recognize the specific data points that constitute a "complete" event.
The Pitch-Level Sequence
At the most granular level, a modern chronology includes every pitch thrown. For the Astros, this data captures the velocity, spin rate, and break of pitches thrown by the rotation, alongside the hitter's reaction. A complete sequence includes:
- Pitch Count: The specific ball-strike count (e.g., 2-1) before the pitch is delivered.
- Pitch Type: Identification of the offering (Sinker, Slider, 4-Seam Fastball).
- Pitch Result: Whether the pitch was a called strike, a swinging strike, a ball, or put into play.
- Statcast Metrics: In the 2026 landscape, this includes exit velocity and launch angle for balls put into play.
Plate Appearance Outcomes
The chronology aggregates these pitches into a plate appearance (PA) result. This segment of the log describes the movement of the batter to a base or back to the dugout. It notes the specific fielding play—such as a "6-4-3 double play"—providing a spatial understanding of the event.
Base Runner Movement and Substitutions
A chronological record must track the "state" of the bases. If a runner advances from first to third on a single to right field, the log notes the specific fielder involvement and whether the advance was on the throw or the hit. Additionally, every managerial decision—including pitching changes, pinch hitters, and defensive replacements—is timestamped by the inning and out-count, allowing analysts to pinpoint exactly when the game's momentum shifted.
Primary Sources for Astros Play-by-Play Data
Depending on whether you are looking for a live game in 2026 or a historical matchup from the 1980s, the sources for these chronologies vary significantly in depth and accessibility.
1. MLB Gameday and Savant (Modern Era)
For games occurring from the early 2000s to the present, MLB.com’s Gameday is the primary resource. It provides a visual and textual "Event Map."
- Live Coverage: Real-time updates with less than a five-second delay.
- Savant Integration: For those seeking technical depth, MLB Savant provides the "Detailed PBP," which includes the physical coordinates of every pitch in the strike zone.
- Visualizations: Provides "spray charts" and "pitch trajectories" mapped onto the event timeline.
2. Baseball-Reference (Comprehensive Historical Log)
Baseball-Reference is the gold standard for navigating the chronology of past Astros seasons. Their PBP logs are indexed by game and offer a "Play Description" column that translates complex scoring into readable text.
- Win Probability Added (WPA): Each event is tagged with its impact on the team's chances of winning.
- Leverage Index: Helps identify "high-leverage" events where the game was decided.
- Accessibility: Most PBP data back to the mid-20th century is available in an easy-to-read table format.
3. Retrosheet (The Research Standard)
For serious researchers and data scientists, Retrosheet provides the raw event files. Unlike a website that shows you a table, Retrosheet offers "event files" that can be parsed by software. This project is dedicated to digitizing every box score and play-by-play in MLB history, including the earliest days of the Houston franchise at Colt Stadium.
Analyzing Key Events in Astros History
To illustrate the value of a complete chronology, one can look at the defining moments of the franchise. A summary says "The Astros won the World Series," but the chronology explains the mechanics of the victory.
Example: The 2022 World Series Game 6 Chronology
In the bottom of the 6th inning, the event chronology captures the tension that led to the championship.
- Event 1: A lead-off hit-by-pitch (HBP).
- Event 2: A strikeout.
- Event 3: A single putting runners on first and third.
- The Turning Point: Yordan Alvarez’s 450-foot home run. The chronology logs the 2-1 pitch—a 98.9 mph sinker—and the subsequent clear-out of the bases.
By reviewing the sequence, an analyst can see the pitching change that preceded the home run, noting exactly how many pitches the reliever had thrown before the decisive blow. This level of detail is essential for understanding managerial strategy and player performance under pressure.
Technical Data and Accessibility for 2026
As of 2026, the accessibility of Astros data has reached a peak. High-speed internet and cloud computing allow fans to download entire seasons of play-by-play data in seconds.
Data Formats for Analysis
If you are building a personal database or conducting a fantasy baseball analysis, you will likely encounter these formats:
- CSV (Comma Separated Values): The most common format for spreadsheet software like Excel. Each row represents one "event" or "pitch."
- JSON: Used primarily by web developers to pull live data from the MLB API into custom apps.
- SQL Databases: Large-scale historical archives (like those maintained by specialized sports firms) use relational databases to connect play-by-play data with player injury reports and weather conditions.
Comparison of Play-by-Play Sources
| Source | Best For | Historical Depth | Key Feature |
|---|---|---|---|
| MLB Gameday | Real-time viewing | 2001–Present | Integrated video highlights |
| Baseball-Reference | Contextual research | 1901–Present | Win Probability charts |
| Retrosheet | Data modeling | 1871–Present | Raw event-code files |
| FanGraphs | Sabermetric analysis | 2002–Present | Detailed "Plate Discipline" stats |
| Stathead | Custom queries | Comprehensive | Search by specific event criteria |
How to Conduct a Chronological Search
If you are looking for a specific event—such as every time Jose Altuve reached base on a lead-off walk in the 2025 season—follow these steps:
- Identify the Date: Locate the specific game on the Astros' schedule.
- Select the Platform: Use Baseball-Reference for a quick text summary or MLB Savant for pitch-level technical data.
- Navigate to the Play-by-Play Tab: Most sites separate the Box Score (summary) from the Play-by-Play (chronology).
- Filter by Inning: Use the jump-links to skip to the specific inning of interest.
- Verify the Context: Look at the "Score" and "Outs" columns to ensure you have the correct event in the sequence.
Common Metadata and Abbreviations in Logs
Navigating an Astros event chronology requires familiarity with standard baseball shorthand. Because these logs are designed to be concise, they use a specific syntax:
- PBP State: Often displayed as a string like
1--(runner on first) or-23(runners on second and third). - Count: Always displayed as Balls-Strikes (e.g., 3-2).
- Event Codes:
- S / D / T / HR: Single, Double, Triple, Home Run.
- K / KL / KS: Strikeout (Generic, Looking, Swinging).
- BB / IBB: Walk, Intentional Walk.
- FC: Fielder's Choice.
- E: Error (usually followed by the fielder's position number, e.g., E6 for a shortstop error).
Troubleshooting Discrepancies in Event Data
Occasionally, you may find differences between two PBP sources. This usually occurs for one of three reasons:
- Official Scoring Changes: MLB occasionally reviews games within 24-48 hours and changes an "Error" to a "Hit" or vice-versa. Official sources like MLB.com will update immediately, while third-party archives might take longer.
- Definition of an "Event": Some logs count "Stolen Base Attempts" as a separate event line, while others include them as a footnote to the next pitch.
- Data Gaps: For older games (pre-1970), complete PBP logs are sometimes reconstructed from newspaper accounts. If two newspapers disagreed on whether a ball was hit to left or center field, the chronology may contain a note of uncertainty.
The Role of Chronology in Modern Scouting
In 2026, the Houston Astros organization—and their opponents—use this chronological data to build "tendency maps." By looking at every pitch thrown to a specific batter in specific counts across the entire season's chronology, teams can predict what a player is likely to do. For example, if the PBP data shows that an Astros pitcher throws a slider 80% of the time on a 0-2 count when a runner is on second, the opposing team will use that event history to prepare their hitters.
FAQ
Where can I find the play-by-play for an Astros game from the 1960s?
The best resource is Retrosheet. While they do not have every single pitch for every game in the 1960s, they have digitized the "event accounts" for most Houston Colt .45s and Astros games. These logs will tell you the outcome of every plate appearance, even if the individual pitch sequences (e.g., ball, strike, foul) are missing for the earliest years.
Is there a free way to download Astros PBP data for an entire season?
Yes, using the pybaseball Python library or the Retrosheet data tools, you can download entire seasons of event files for free. These are intended for non-commercial research. For a more user-friendly experience, Baseball-Reference allows you to export individual game PBP tables directly to Excel.
Does the play-by-play record weather conditions?
Official chronologies typically record the "Game Time Temperature," "Wind Direction/Speed," and "Weather Condition" (e.g., Roof Closed, Cloudy) in the game metadata section, usually located at the very top or bottom of the PBP report. This is particularly relevant for the Astros, as the Minute Maid Park roof status significantly impacts ball flight.
How do I see the "Win Probability" for each play?
Platforms like FanGraphs and Baseball-Reference include a "WPA" (Win Probability Added) column in their play-by-play tables. This shows the percentage shift in the team's chance of winning after that specific event occurred. A positive number indicates the play helped the Astros, while a negative number indicates it helped the opponent.
Can I get play-by-play for Astros spring training games?
Coverage for Spring Training is less comprehensive than the regular season. While MLB Gameday provides PBP for most televised or "broadcasted" spring games, historical archives like Retrosheet generally focus on the regular season and postseason only.
Recommendation for Next Actions
To master the use of Astros game chronologies, start by visiting Baseball-Reference and looking up a recent game. Navigate to the "Play-by-Play" section and practice following the "Inning State" and "WPA" columns. This will build your intuition for how the game's flow is translated into data. If you are interested in the technical mechanics of the sport, cross-reference that same game on MLB Savant to see the 3D pitch trajectories and exit velocities that accompany each chronological entry.