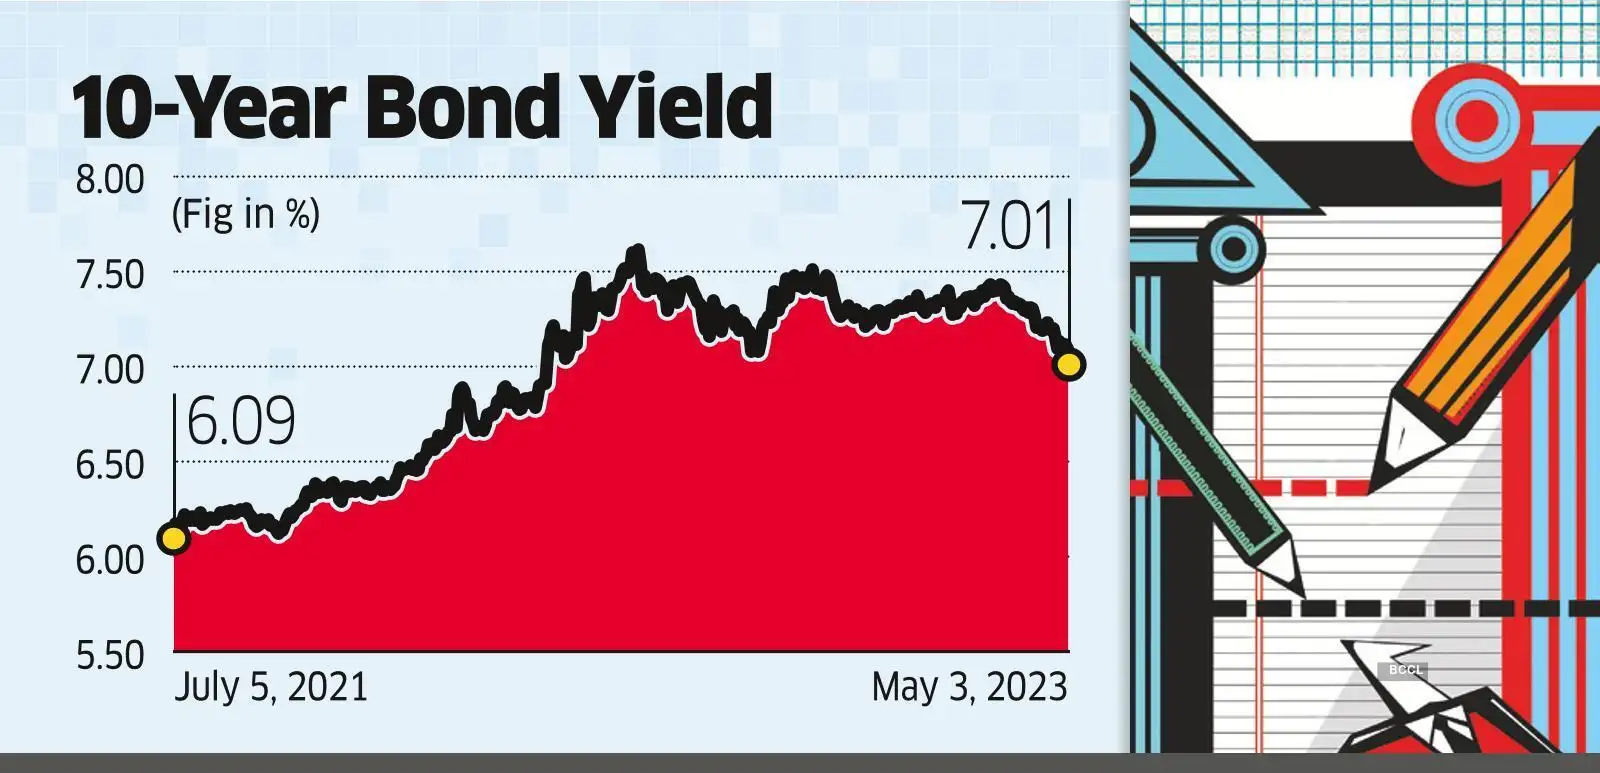
Benchmark government 10-year bond yields represent the interest rates paid on sovereign debt issued by major nations with ten-year maturities. Serving as foundational risk-free rates, five major global benchmarks—US 10-Year Treasuries, German Bunds, UK Gilts, Japanese JGBs, and Indian G-Secs—dictate corporate borrowing costs, consumer mortgage pricing, equity market valuations, and international capital flows.
What Is a 10-Year Benchmark Government Bond Yield?
A 10-year benchmark government bond yield is the annualized return an investor receives by purchasing a sovereign bond issued with a ten-year maturity and holding it until maturity, or selling it at current market pricing. Governments issue these fixed-income securities to fund fiscal budgets, infrastructure projects, and public debt refinancing.
In financial markets, a sovereign bond designated as a "benchmark" is typically the most recently issued, highly liquid security within that maturity bracket—often referred to as an "on-the-run" issue. Because national governments with strong credit ratings possess the authority to levy taxes and print currency, sovereign debt issued in local currency by major economies is treated as effectively default-free. Consequently, the yield on a benchmark government bond forms the base line—or risk-free rate—against which all other riskier financial assets in that currency are priced.
The 10-year maturity occupies a unique position on the yield curve. Shorter maturities, such as 2-year or 3-month Treasury bills, are heavily anchored to immediate central bank monetary policy target rates. Longer maturities, such as 30-year bonds, are primarily driven by long-term structural demographic trends and distant inflation expectations. The 10-year bond hits the sweet spot: it is short enough to reflect multi-year business cycles and medium-term monetary policy shifts, yet long enough to capture broader macroeconomic growth prospects and structural inflation expectations.
Understanding the inverse relationship between bond prices and yields is vital for market analysis. When demand for government bonds rises, market prices increase, driving yields down. Conversely, when investors sell off sovereign bonds, prices fall, causing yields to rise.
Bond Price Rises ---> Bond Yield Falls Bond Price Falls ---> Bond Yield Rises
Disclaimer: This guide is provided for educational and analytical purposes only and does not constitute formal financial, investment, legal, or tax advice. Investors should consult qualified fixed-income advisors or certified financial planners before making capital allocation decisions.
Deep-Dive into the Top 5 Global Benchmark 10-Year Government Bonds
While hundreds of sovereign nations issue government debt, five specific 10-year benchmark bonds play an oversized role in setting global monetary conditions, international credit pricing, and institutional capital allocation.
1. United States 10-Year Treasury Note (US10Y)
The US 10-Year Treasury Note is widely considered the single most important financial benchmark in the world. Issued by the U.S. Department of the Treasury, this security forms the bedrock of global financial valuation.
- Primary Function: The US 10-Year Treasury yield serves as the global baseline risk-free rate ($R_f$). It directly influences fixed-rate 30-year residential mortgage rates, US corporate bond spreads, municipal debt pricing, and discount rates used in discounted cash flow (DCF) equity models.
- Core Drivers: Key catalysts include Federal Reserve target rate decisions, U.S. Consumer Price Index (CPI) releases, non-farm payroll reports, and total federal deficit issuance announced in quarterly Treasury refunding statements. Historical data on US Treasury rates can be analyzed directly via the Federal Reserve Bank of St. Louis FRED Database.
- Market Significance: When global geopolitical volatility surges, institutional capital flows into US Treasuries as an ultimate safe-haven asset, compressing yields even during periods of domestic economic uncertainty.
2. German 10-Year Federal Bond / Bund (DE10Y)
The German 10-Year Federal Bond, officially known as the Bundeskreditversicherung or Bund, represents the premier risk-free benchmark for the European Union and the Eurozone.
- Primary Function: Issued by the German Federal Government and managed via the Deutsche Bundesbank, the Bund yield establishes the floor for sovereign and corporate borrowing costs across all 20 Eurozone member states.
- Core Drivers: Bund yields react to European Central Bank (ECB) deposit facility policy rates, Eurostat harmonized inflation indices, regional energy prices, and structural fiscal framework enforcement within the EU.
- Market Significance: Because Germany maintains a top-tier credit rating and strict constitutional debt brake provisions (Schuldenbremse), the German 10-Year Bund exhibits minimal credit risk premium. Other Eurozone sovereign yields (such as Italian BTPs or Spanish Bonos) are customarily quoted as a "spread" over the German Bund.
3. United Kingdom 10-Year Treasury Gilt (GB10Y)
In the United Kingdom, sovereign government bonds are known as Gilts, named after the historic gold-gilded edges of physical paper debt certificates. The 10-year benchmark Gilt is auctioned and managed by the UK Debt Management Office on behalf of HM Treasury.
- Primary Function: The 10-year Gilt yield determines domestic corporate borrowing rates, commercial property yields, and benchmark reference rates for Sterling-denominated capital markets.
- Core Drivers: Yield dynamics are driven by Bank of England (BoE) Monetary Policy Committee interest rate decisions, UK retail and consumer inflation trends, sterling exchange rate volatility, and domestic fiscal policy announcements. Detailed operational specifications are maintained by the Bank of England.
- Market Significance: UK Gilts are heavily held by domestic liability-driven investment (LDI) funds and defined-benefit pension funds. Shifts in 10-year Gilt yields directly affect pension fund solvency ratios and corporate balance sheets across Britain.
4. Japanese 10-Year Government Bond / JGB (JP10Y)
The 10-Year Japanese Government Bond (JGB) is the principal fixed-income anchor for the world’s third-largest single-nation economy and the broader Asian market region.
- Primary Function: Managed under the oversight of the Japanese Ministry of Finance and the Bank of Japan, the 10-year JGB yield establishes baseline domestic Yen borrowing rates and serves as a key indicator for international carry trades.
- Core Drivers: Influencing factors include Bank of Japan short-term interest rate policies, domestic wage growth, headline inflation, and sovereign Japanese foreign exchange intervention strategies.
- Market Significance: Japan’s historical transition away from Yield Curve Control (YCC) policies has made the 10-year JGB yield a focal point for international macro hedge funds. Because Japanese institutional investors hold vast quantities of foreign debt, rising domestic 10-year JGB yields can incentivize capital repatriations back into domestic yen bonds, exerting upward pressure on global yields worldwide.
5. India 10-Year Government Security / G-Sec (IN10Y)
Representing fast-growing emerging markets, the India 10-Year Government Security (G-Sec) has evolved into a premier global benchmark bond, particularly following the inclusion of Indian sovereign debt in major global emerging market bond indices (such as the JPMorgan GBI-EM index).
- Primary Function: Auctioned through the Reserve Bank of India, the 10-year G-Sec yield serves as the sovereign pricing anchor for bank lending benchmark rates, corporate bond issuances, and state government loans across India.
- Core Drivers: Primary determinants include RBI Monetary Policy Committee repo rates, headline consumer inflation targets, monsoon and agricultural commodity output, global crude oil prices, and statutory liquidity ratio (SLR) requirements for domestic commercial banks.
- Market Significance: The Indian 10-year G-Sec provides investors with exposure to high-yield sovereign debt from a rapidly expanding major economy, presenting an attractive yield profile alongside managed structural inflation dynamics.
Comprehensive Comparison of the 5 Sovereign Benchmarks
The table below outlines structural specifications, primary regulatory bodies, credit risk indicators, and key economic drivers across the five dominant 10-year sovereign bond benchmarks:
| Country & Benchmark Bond | Sovereign Issuer & Regulator | Primary Currency | Benchmark Financial Role | Key Yield Catalysts & Sensitivities |
|---|---|---|---|---|
| United States10-Year Treasury Note | U.S. Department of the Treasury / Federal Reserve | USD ($) | Global risk-free rate baseline; pricing benchmark for global mortgages & equities. | Fed Target Rate, Core PCE inflation, job growth, federal budget deficits, refunding schedules. |
| Germany10-Year Federal Bund | German Federal Finance Agency / Deutsche Bundesbank | EUR (€) | Risk-free rate floor for Eurozone; credit spread reference for European debt. | ECB Deposit Rate, Eurozone CPI, German constitutional fiscal limits, energy commodity shocks. |
| United Kingdom10-Year Treasury Gilt | UK Debt Management Office / Bank of England | GBP (£) | Benchmark for Sterling assets, UK commercial lending, and pension fund LDI strategies. | BoE MPC rate path, UK wage growth, Sterling exchange rates, domestic fiscal policy. |
| Japan10-Year Sovereign JGB | Ministry of Finance Japan / Bank of Japan | JPY (¥) | Key anchor for Asian Yen liquidity; baseline for global cross-border carry trades. | BoJ policy normalization, Japanese inflation trends, foreign capital repatriation flows. |
| India10-Year Sovereign G-Sec | Public Debt Office / Reserve Bank of India | INR (₹) | Emerging market sovereign anchor; reference rate for Indian corporate credit. | RBI Repo Rate, CPI inflation targeting, crude oil import prices, global index flows. |
5-Year vs. 10-Year Government Bond Yields: Yield Curve Dynamics
When analyzing government debt, fixed-income specialists frequently examine the relationship between different points on the yield curve—specifically comparing 5-year benchmark yields against 10-year benchmark yields.
Yield Curve Shapes: Normal: 5-Year Yield < 10-Year Yield (Positive Spread / Upward Sloping) Flat: 5-Year Yield = 10-Year Yield (Zero Spread / Flat Curve) Inverted: 5-Year Yield > 10-Year Yield (Negative Spread / Downward Sloping)
The "Belly" of the Yield Curve
In fixed-income terminology, 5-year bonds sit in the "belly" or intermediate segment of the yield curve, while 10-year bonds anchor the long-intermediate segment.
- 5-Year Government Bonds are highly sensitive to medium-term central bank interest rate trajectories over a standard business cycle (3 to 5 years).
- 10-Year Government Bonds incorporate medium-term rate expectations plus a long-term term premium—the additional yield required by investors to lock up capital for a decade against inflation and duration risks.
The 5-Year / 10-Year Yield Spread
The mathematical difference between the 10-year yield and the 5-year yield ($Y_{10} - Y_5$) provides a clear measure of economic expectations:
- Upward Sloping (Normal Curve): When the 10-year yield is higher than the 5-year yield, the curve reflects standard economic conditions. Investors demand higher yields for longer maturities to compensate for inflation risk over time.
- Curve Flattening: When 5-year yields rise faster than 10-year yields, narrowing the spread, it signals that the market expects monetary tightening or slowing economic growth.
- Curve Inversion: If 5-year yields rise above 10-year yields, the yield curve becomes inverted. This occurs when central banks aggressively raise short-to-medium term interest rates to curb inflation, leading investors to anticipate a future economic slowdown and eventual interest rate cuts.
- Bull vs. Bear Steepening:
- Bull Steepening: Occurs when short-and-medium-term yields (5-year) fall faster than long-term yields (10-year) because central banks are rapidly lowering interest rates to support an economy.
- Bear Steepening: Occurs when 10-year yields rise much faster than 5-year yields due to expanding sovereign debt supply, weakening fiscal deficits, or surging long-term inflation fears.
Primary Macroeconomic Drivers Influencing Benchmark 10-Year Yields
Sovereign bond yields do not move in isolation. They are driven by four core macroeconomic variables:
1. Central Bank Monetary Policy & Interest Rate Expectations
Although central banks directly set short-term overnight policy rates (such as the Federal Funds Rate or the ECB Deposit Facility Rate), market expectations of where policy rates will average over the next decade directly shape the 10-year yield. If traders anticipate a multi-year rate-cutting cycle, 10-year benchmark yields will decline ahead of actual central bank actions.
2. Inflation Expectations and Real Yields
Nominal benchmark bond yields are composed of two distinct components: the real yield and inflation compensation.
$$\text{Nominal 10-Year Yield} = \text{Real Yield} + \text{Expected Inflation Rate}$$
- Breakeven Inflation: The difference between a nominal 10-year government bond yield and an inflation-indexed 10-year bond yield (such as US TIPS) reflects the market's average annual expected inflation rate over the next decade.
- Real Yields: The yield remaining after subtracting expected inflation represents the real return on capital. High real yields indicate tight global monetary conditions and elevated real borrowing costs.
3. Fiscal Policy, Budget Deficits, and Sovereign Supply
Governments must auction new bonds to finance budget deficits and roll over maturing debt. When sovereign debt issuance grows rapidly without a corresponding rise in investor demand, primary dealers must lower bond prices to clear auctions. Lower prices result in higher benchmark yields across the maturity spectrum.
4. Global Safe-Haven Demand and Capital Mobility
During periods of heightened global risk, geopolitical instability, or banking sector distress, investors shift capital into top-tier sovereign bonds. This sudden demand for liquidity boosts bond prices and compresses 10-year yields in premier safe-haven nations like the United States and Germany.
Practical Applications: How Investors and Businesses Use 10-Year Yields
Tracking 10-year benchmark government bond yields provides actionable financial intelligence across multiple sectors:
Equity Valuation and Corporate Finance
In fundamental equity research, analysts use the 10-year government bond yield as the risk-free rate ($R_f$) in the Capital Asset Pricing Model (CAPM) to calculate a company's Weighted Average Cost of Capital (WACC):
$$\text{Cost of Equity} = R_f + \beta \times (\text{Equity Risk Premium})$$
When the 10-year benchmark yield rises, discount rates across valuation models increase. Higher discount rates reduce the present value of future corporate cash flows, exerting downward valuation pressure on high-growth technology stocks and long-duration equities.
Commercial and Residential Real Estate
Mortgage lenders base long-term fixed mortgage pricing on sovereign benchmark yields. In the United States, 30-year fixed residential mortgage rates historically trade at a credit spread of roughly 150 to 300 basis points above the US 10-Year Treasury yield. When the 10-year yield climbs, mortgage rates rise proportionally, slowing residential real estate transactions and altering commercial property capitalization rates.
Fixed-Income Portfolio Management
Institutional bond managers adjust overall portfolio duration—a measure of sensitivity to interest rate shifts—based on yield curve positioning:
- Shortening Duration: If an investor expects 10-year benchmark yields to rise (and bond prices to drop), they reduce portfolio duration by allocating capital to 2-year or 5-year short-duration bonds.
- Lengthening Duration: If an investor anticipates falling inflation and lower benchmark yields, they lengthen duration into 10-year or 30-year sovereign bonds to lock in higher fixed coupon income and capture potential capital gains.
How to Monitor and Analyze Benchmark Yield Data
Investors can track real-time and historical 10-year government bond yields using several reputable financial portals and official statistical databases:
Official Government and Central Bank Portals:
- United States: Access daily yield curve rates via the official U.S. Department of the Treasury portal or FRED (Federal Reserve Bank of St. Louis).
- Eurozone: Access daily yield stats via the Deutsche Bundesbank statistical data engine or the ECB Data Portal.
- United Kingdom: Consult the Bank of England yield curve database and the UK Debt Management Office (DMO).
- Japan: Reference the Ministry of Finance Japan (MOF) bond statistics page.
- India: Monitor the Reserve Bank of India (RBI) Database on Indian Economy (DBIE).
Key Metrics to Track:
- Basis Points (bps): Yield movements are measured in basis points, where $1\text{ bps} = 0.01%$ ($100\text{ bps} = 1.00%$). A yield moving from 4.10% to 4.25% has increased by 15 basis points.
- Intraday Spreads: Track spread differences between international benchmarks (e.g., US 10-Year yield vs. German 10-Year Bund yield) to assess international currency hedging flows and relative macroeconomic strength.
Strategic Recommendations for Investors
- Align Equity Portfolios with Rate Environments: In rising yield regimes driven by inflation, focus on value sectors, cash-generative businesses, and financial institutions that benefit from wider net interest margins. In declining yield regimes, consider increasing exposure to high-quality growth equities.
- Monitor Yield Curve Spreads: Watch the 5-year vs. 10-year spread as a leading indicator of macroeconomic shifts. A widening spread often signals economic recovery or fiscal expansion, while a narrowing spread points toward potential monetary policy tightening or economic moderation.
- Account for Currency and Inflation Risks: International sovereign bonds carry foreign exchange risk. Unhedged foreign bond purchases exposed to currency fluctuations can easily offset fixed yield returns. Always evaluate total yield returns on an inflation-adjusted, currency-hedged basis.
Frequently Asked Questions (FAQ)
Why is the 10-year government bond yield used as the primary benchmark instead of other maturities?
The 10-year maturity balances short-term central bank policy sensitivity with long-term macroeconomic and inflation outlooks. It offers deep trading liquidity, minimal bid-ask spreads, and a structural timeframe that aligns well with corporate capital investment cycles and long-term debt financing.
How does a rise in the 10-year Treasury yield affect stock market valuations?
A rise in the 10-year yield increases the risk-free rate used to discount future corporate earnings in valuation models. Higher discount rates reduce the present value of future earnings, which can depress stock prices—particularly for growth and technology companies whose cash flows are weighted further into the future.
What is the difference between nominal yield and real yield on a 10-year bond?
The nominal yield is the raw interest percentage paid by the government security without adjusting for purchasing power changes. The real yield subtracts anticipated consumer price inflation (breakeven inflation) over the 10-year holding period. Real yield measures the true purchasing-power growth generated by holding the bond to maturity.
What causes the spread between 5-year and 10-year benchmark bond yields to narrow?
The spread between 5-year and 10-year yields narrows (flattens) when market participants anticipate central bank interest rate hikes in the near-to-medium term, or when long-term inflation expectations decline. If medium-term yields rise faster than long-term yields, the yield curve flattens.
Why do European government bond yields trade at a spread relative to the German 10-Year Bund?
While Eurozone nations share a common currency (the Euro) and a single monetary policy managed by the ECB, each sovereign nation retains independent fiscal authority and debt issuance responsibility. Bonds issued by nations with higher debt-to-GDP ratios or fiscal deficits carry subtle credit risk premiums relative to the German Bund, resulting in yield spreads over the German benchmark.