Choosing the right visual representation for your data is the difference between a clear insight and a confusing mess. To select the correct chart, you must identify your primary goal: are you comparing values, showing a distribution, explaining a relationship, or analyzing trends over time? By matching your data structure to the appropriate visual logic, you ensure your audience grasps the "why" behind the numbers instantly.
In the data-driven landscape of 2026, the ability to interpret and create visual narratives is no longer a niche skill for analysts; it is a fundamental requirement for effective communication in every industry. Whether you are building a dashboard in a business intelligence suite or presenting a research paper, understanding the mechanics of various charts is essential. This guide explains the most critical chart types, their specific use cases, and the underlying logic that makes them effective.
1. Comparison Charts: Highlighting Differences and Similarities
Comparison charts are designed to show how different categories or variables relate to one another in terms of magnitude. They are the most common charts used in business reporting because they provide an immediate sense of scale.
Bar Charts and Column Charts
The Bar Chart (horizontal) and Column Chart (vertical) are the workhorses of data visualization. They use the length or height of a rectangular bar to represent a value.
- Best Use Case: Use a column chart when comparing a small number of categories (usually 5–10). Use a horizontal bar chart when you have long category labels that would be difficult to read on a vertical axis, or when you have a large number of categories (10+).
- Pro Tip: Always start your y-axis at zero. Truncating the axis can visually exaggerate differences between categories, leading to a misleading interpretation of the data.
Radar (Spider) Charts
A Radar Chart visualizes multivariate data by plotting multiple axes starting from a central point. Each axis represents a different variable, and the resulting "web" shape shows the strengths and weaknesses of a specific entity.
- Best Use Case: Comparing the profiles of two or more items across the same qualitative metrics (e.g., comparing the performance features of two different software packages or the skill sets of two job candidates).
- Limitation: They become difficult to read if more than three or four entities are overlaid.
2. Time-Series and Trend Charts: Tracking Evolution
When the primary variable is time, you need a chart that emphasizes continuity and change. These charts help viewers identify patterns, cycles, or anomalies over days, months, or years.
Line Charts
The Line Chart connects individual data points with a continuous line. It is the gold standard for showing trends over time because the human eye is naturally adept at following the slope of a line to determine "upward" or "downward" momentum.
- Best Use Case: Showing stock price movements, monthly revenue growth, or temperature changes.
- Why it works: It emphasizes the relationship between points rather than the individual values themselves.
Area Charts
An Area Chart is essentially a line chart with the space between the line and the x-axis filled with color. While it shows trends, its primary purpose is to illustrate the magnitude of change over time.
- Best Use Case: Showing total volume change, such as total energy consumption over a decade.
- Stacked Area Charts: These are used to show how different components of a total have changed over time. For example, showing total company revenue broken down by individual product lines.
Candlestick Charts
Crucial in financial analysis, Candlestick Charts pack four pieces of data into a single visual element: the Open, High, Low, and Close (OHLC) prices for a specific time period.
- Best Use Case: Technical analysis of financial markets (stocks, forex, crypto).
- Anatomy: The "body" of the candle shows the range between opening and closing prices, while the "wicks" (shadows) show the highest and lowest prices reached during that interval.
3. Composition Charts: Understanding the Whole
Composition charts answer the question: "What are the parts of this total?" They represent how a single entity is broken down into various sub-components.
Pie and Donut Charts
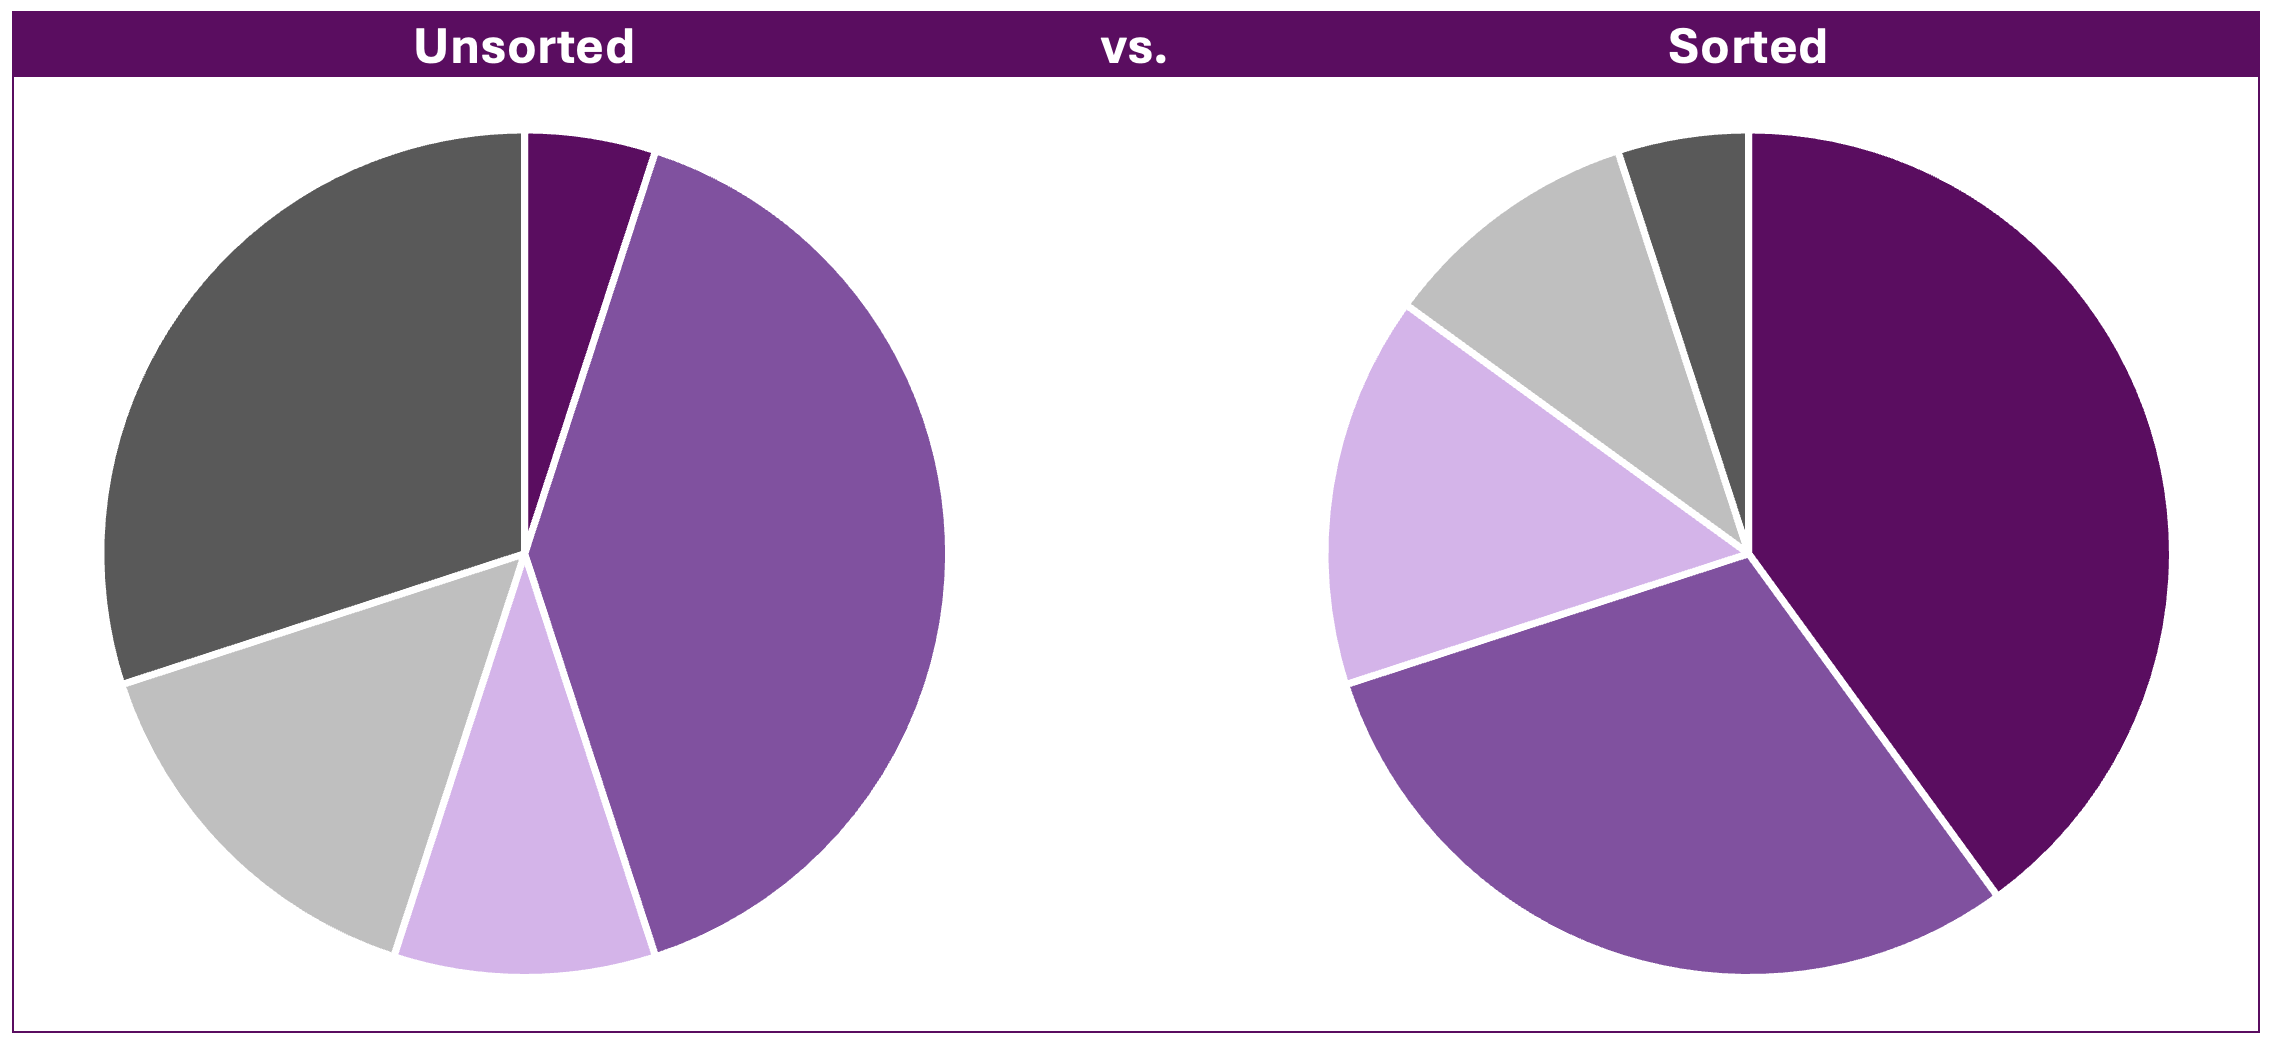
Pie Charts represent a total as a circle, with slices representing percentages. A Donut Chart is the same, but with a hollow center, which often makes it easier to read because the eye focuses on the arc length rather than the area of the slice.
- The Golden Rule: Never use a pie chart for more than five categories. If the slices become too thin, the human brain struggles to accurately compare their relative sizes.
- Common Mistake: Using a pie chart when the parts do not add up to 100%.
Treemaps
A Treemap uses nested rectangles to represent hierarchical data. The area of each rectangle is proportional to its value.
- Best Use Case: Visualizing a large dataset with multiple levels of categories, such as a national budget broken down by department and then by specific programs.
- Advantage: They are incredibly space-efficient, allowing you to show hundreds of data points in a single view while maintaining a clear sense of hierarchy.
Stacked Bar Charts
A Stacked Bar Chart combines comparison and composition. It allows you to see the total size of a category while simultaneously seeing how that total is divided.
- Best Use Case: Comparing total sales across different regions while seeing the contribution of different product categories within each region.
4. Distribution and Relationship Charts: Identifying Patterns
These charts are used by data scientists and researchers to find correlations, outliers, and the "spread" of data. They move beyond simple totals to show how data behaves statistically.
Scatter Plots
A Scatter Plot uses dots to represent the values of two different numeric variables. The position of each dot on the horizontal and vertical axes indicates values for an individual data point.
- Best Use Case: Identifying correlations. For example, "Does increased advertising spend (x-axis) result in higher website traffic (y-axis)?"
- Bubble Charts: A variation where the size of the dot (the bubble) represents a third variable, adding another layer of information.
Histograms
A Histogram looks like a column chart, but it serves a different purpose. It groups continuous data into "bins" to show the frequency of values within certain ranges.
- Best Use Case: Analyzing the distribution of grades in a classroom or the age demographics of a customer base.
- Key Difference: In a column chart, each bar represents a distinct category (e.g., Apple, Orange). In a histogram, the bars represent a continuous range (e.g., ages 20–29, 30–39).
Box and Whisker Plots
The Box Plot provides a visual summary of a dataset’s distribution based on a five-number summary: minimum, first quartile (Q1), median, third quartile (Q3), and maximum.
- Best Use Case: Comparing distributions between several groups (e.g., test scores across different schools) and identifying outliers—data points that fall significantly outside the expected range.
5. Flow and Process Charts: Mapping Complexity
Sometimes data isn't just about numbers; it's about movement, logic, or time-bound tasks.
Sankey Diagrams
A Sankey Diagram uses "flows" whose width is proportional to the quantity of the flow.
- Best Use Case: Visualizing energy transfers, material flows, or the path users take through a website (user journey mapping). It is excellent for showing where "leakage" or loss occurs in a system.
Gantt Charts
The Gantt Chart is the essential tool for project management. It lists tasks on the vertical axis and time intervals on the horizontal axis.
- Best Use Case: Tracking project schedules, dependencies between tasks, and milestone deadlines.
- Why it's vital: It provides a visual roadmap of a project's lifecycle, showing which tasks must be completed before others can begin.
Heatmaps
A Heatmap uses color intensity to represent magnitude across a two-dimensional surface.
- Best Use Case: In web analytics, heatmaps show where users click most frequently on a page. In statistics, they can show the correlation matrix between many variables.
Chart Selection Matrix: A Quick Comparison
Use the following table to narrow down your choice based on your specific data requirements.
| Chart Type | Primary Purpose | Data Structure Needed | Complexity |
|---|---|---|---|
| Column/Bar | Comparison | Categorical + Numeric | Low |
| Line Chart | Trend over time | Time-series + Numeric | Low |
| Pie Chart | Part-to-whole | Categorical (max 5) | Low |
| Scatter Plot | Relationship | Numeric + Numeric | Medium |
| Treemap | Hierarchy | Nested Categorical | Medium |
| Box Plot | Distribution | Numeric (Spread) | High |
| Sankey | Flow/Path | Source/Target + Numeric | High |
| Gantt | Schedule | Tasks + Start/End Dates | Medium |
Principles of Effective Data Visualization
Regardless of the chart type you choose, several universal principles apply to data visualization in 2026:
- Maximize the Data-Ink Ratio: This concept, popularized by Edward Tufte, suggests that as much of the "ink" (or pixels) on a page as possible should be devoted to the data itself. Remove unnecessary gridlines, borders, and decorative 3D effects that distract from the information.
- Avoid "Chartjunk": Do not add illustrations or icons inside your charts that do not provide information. If a visual element doesn't help the viewer interpret the data, it shouldn't be there.
- Color with Purpose: Use color to highlight the most important data point or to group related categories. Avoid using a "rainbow" of colors just for the sake of variety, as this can confuse the viewer.
- Accessibility Matters: Ensure your charts are readable for people with color vision deficiency. Use high-contrast color palettes and consider using patterns or direct labeling in addition to color coding. The W3C Web Accessibility Initiative provides comprehensive guidelines for making visual information accessible.
- Contextualize with Annotations: A chart without a title or axis labels is just a drawing. Always include a clear H1-style title that summarizes the main takeaway, and label your axes with units (e.g., "Revenue in USD" or "Temperature in Celsius").
Frequently Asked Questions
When should I use a table instead of a chart?
Use a table when the audience needs to look up specific, precise values or when you are presenting a large number of metrics for a small number of entities. Charts are superior for showing patterns, trends, and relative scale, but they often sacrifice the precision of the raw numbers.
Is it ever okay to use 3D charts?
Generally, no. 3D effects (like a 3D pie chart or 3D bar chart) distort the viewer's perception of the data. The extra dimension makes it difficult to judge the height of bars or the size of slices accurately. Stick to 2D representations unless you are visualizing actual 3D spatial data (like a topographical map).
What is the difference between a histogram and a bar chart?
While they look similar, the x-axis is fundamentally different. A bar chart compares discrete categories (like "Marketing" vs. "Sales"). A histogram shows the distribution of a single continuous variable (like "Age" or "Income") divided into logical "bins" or ranges.
How do I handle outliers in my charts?
Outliers can skew your data and make a chart difficult to read. In a scatter plot or box plot, outliers should be clearly labeled. In a line or bar chart, you may need to use a "broken" axis or provide a separate callout to explain why the outlier exists without letting it flatten the rest of your data visualization.
What is the best chart for showing correlations?
The scatter plot is the primary tool for showing correlations. To make the correlation clearer, you can add a "trend line" (also called a regression line) which mathematically calculates the best fit through the data points, indicating the direction and strength of the relationship.
Final Recommendation
To master the art of data visualization, start by simplifying your message. Ask yourself: "What is the one thing I want the viewer to remember?" If the answer is a growth trend, use a line chart. If the answer is a market share breakdown, use a treemap or a donut chart. Always prioritize clarity over aesthetic complexity. By adhering to the standards of data integrity and selecting the chart type that aligns with your specific goal, you transform raw information into a powerful tool for decision-making.