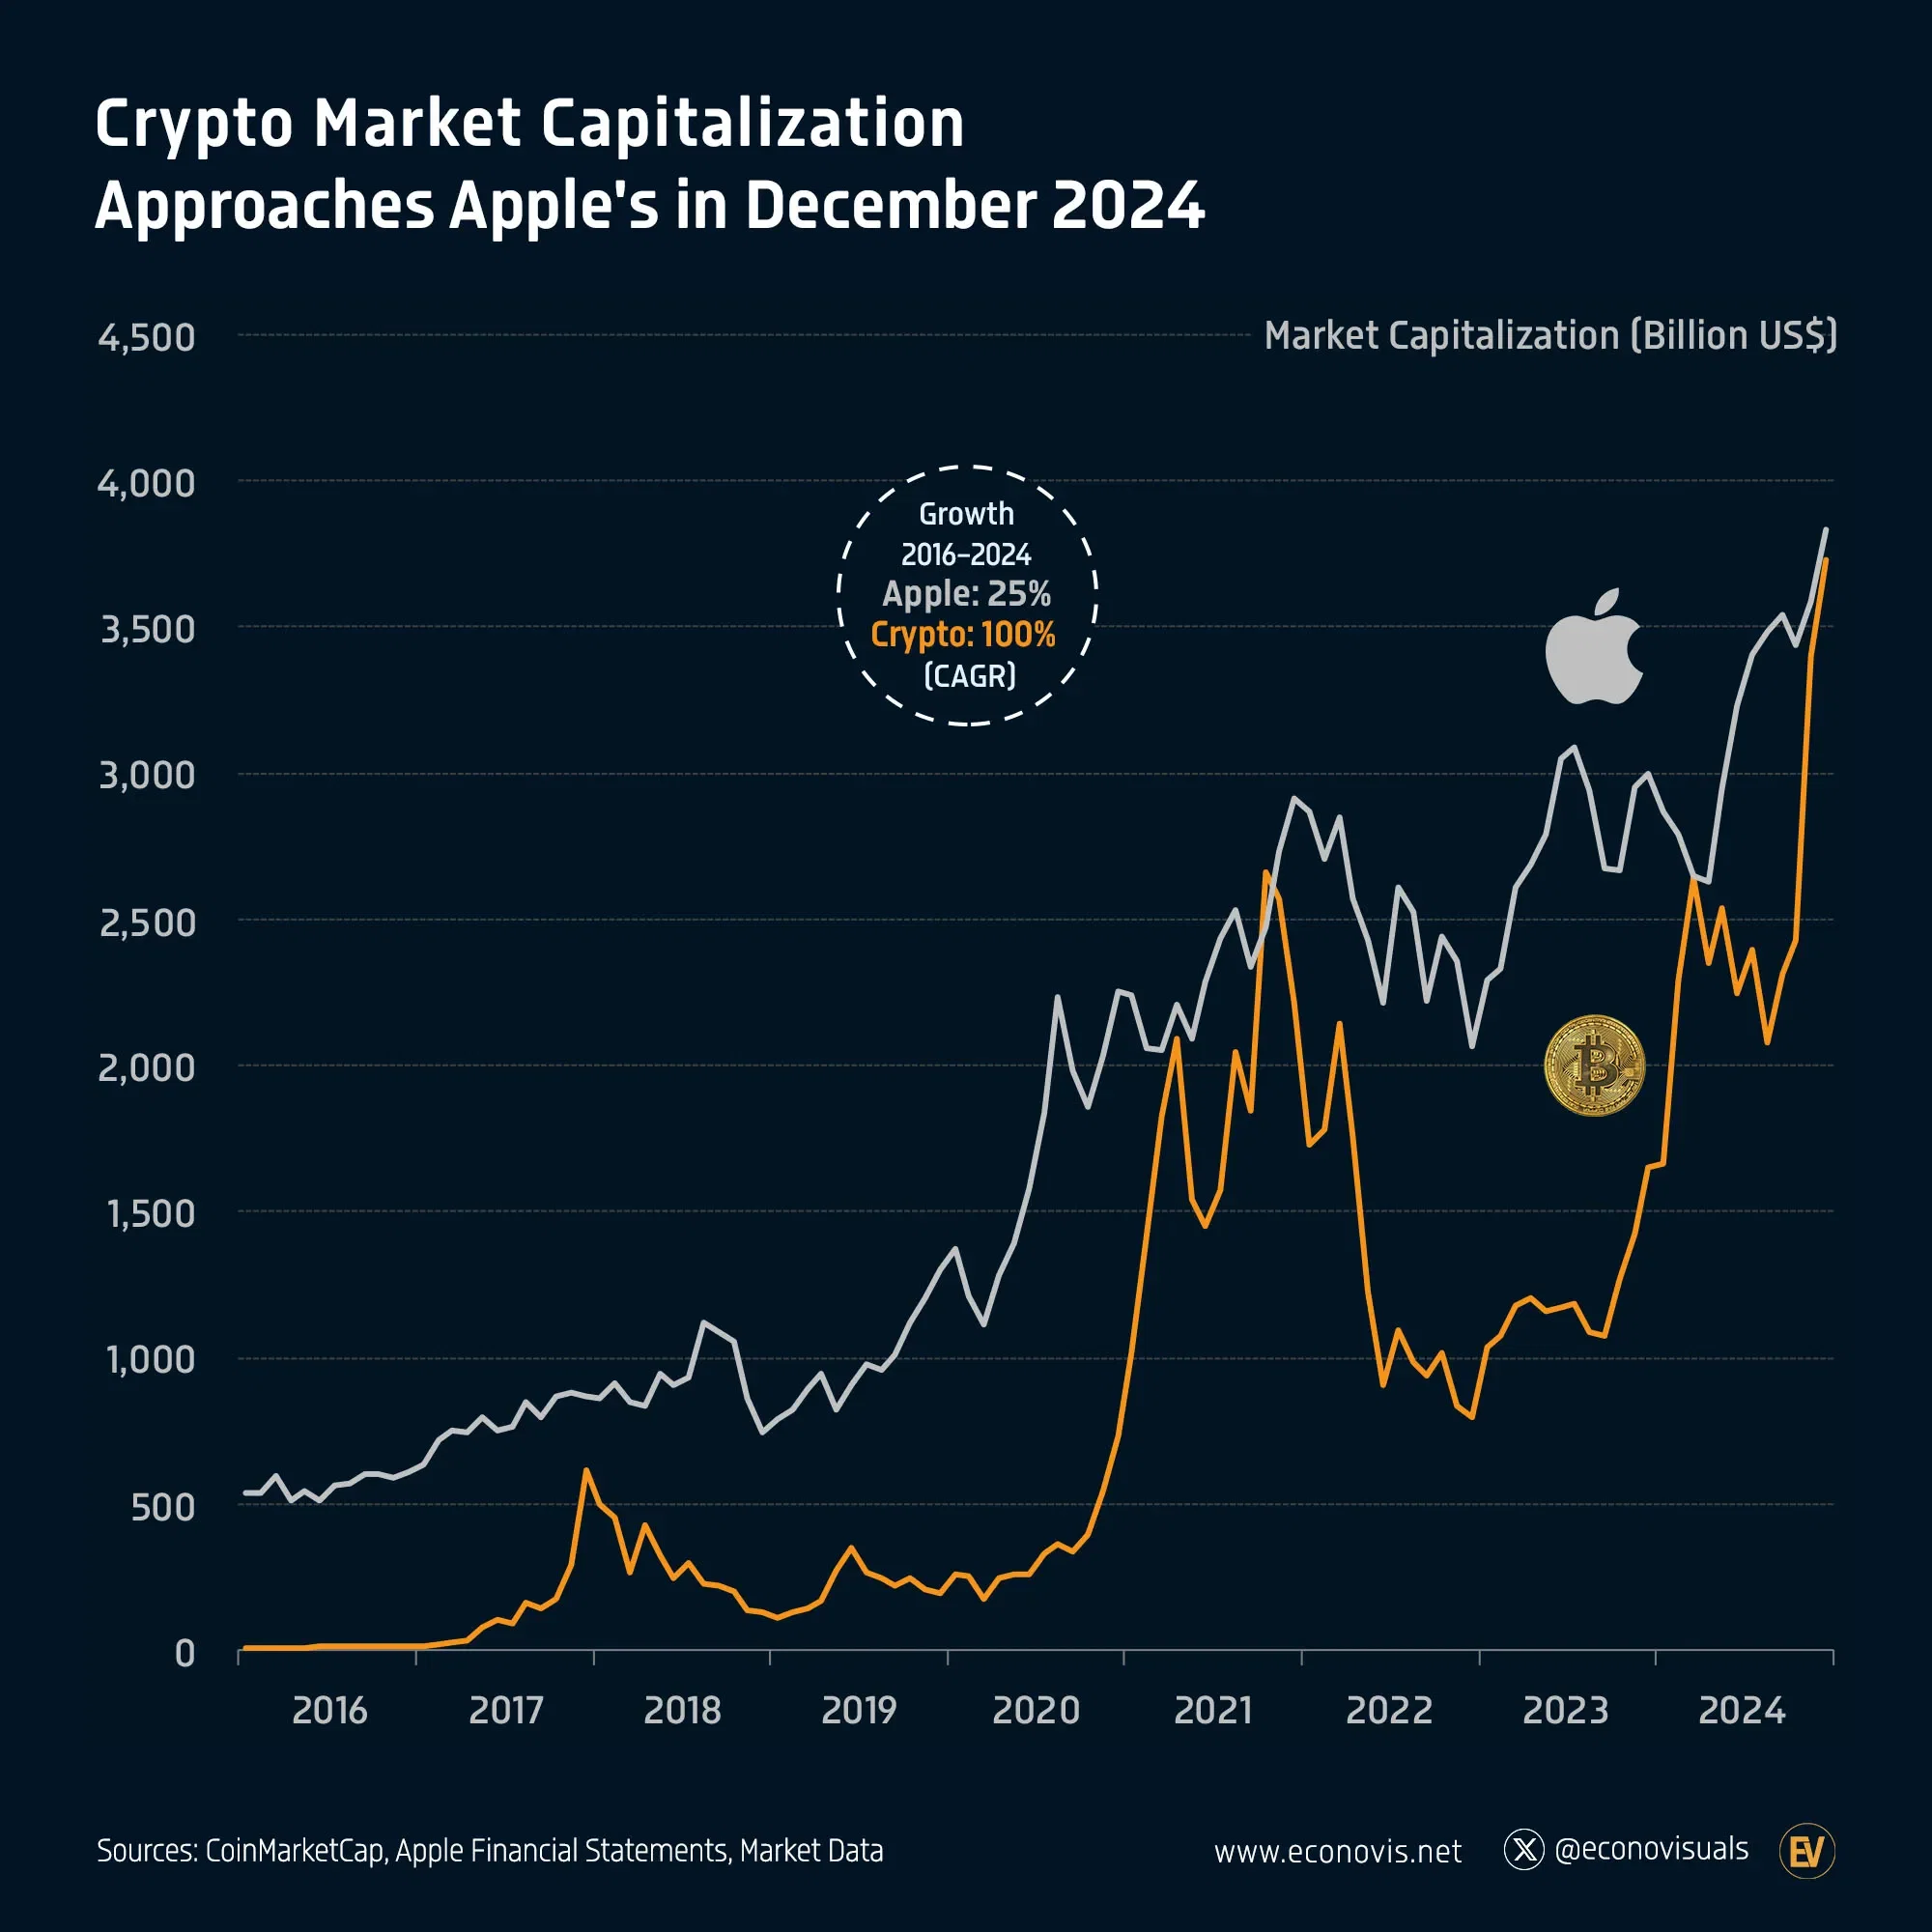
Apple Inc.’s market capitalization history tracks the company’s evolution from a niche computer manufacturer to a dominant global titan. As of 2026, Apple maintains a valuation often exceeding $3.5 trillion, driven by its seamless integration of hardware, software, and services, alongside a persistent strategy of share buybacks and aggressive expansion into generative artificial intelligence.
Understanding Market Capitalization and Apple’s Significance
Market capitalization, or "market cap," represents the total dollar market value of a company's outstanding shares of stock. It is calculated by multiplying the current stock price by the total number of shares outstanding. For investors and economists, Apple’s market cap serves as a barometer for the health of the broader technology sector and the consumer discretionary market.
Apple’s journey is historically significant because it was the first U.S. public company to cross the $1 trillion, $2 trillion, and $3 trillion thresholds. These milestones were not merely symbolic; they reflected shifts in global computing, the transition to a mobile-first world, and eventually, the dominance of platform-based ecosystems. Unlike many of its peers, Apple’s valuation is anchored by a massive installed base of over 2 billion active devices, which creates a "moat" of recurring service revenue that stabilizes its valuation even during periods of hardware stagnation.
The Formative Years: 1980 IPO to the Mid-1990s Crisis
Apple went public on December 12, 1980, at $22 per share. At the time, its market capitalization was approximately $1.8 billion. This was one of the largest initial public offerings (IPOs) since Ford Motor Company in 1956, making more than 40 employees and investors instant millionaires.
However, the 1980s and early 1990s were characterized by volatility. Following the departure of Steve Jobs in 1985, the company struggled to find a cohesive product strategy. While the Macintosh initially gained traction, competition from lower-priced IBM clones running Microsoft Windows began to erode Apple’s market share. By the mid-1990s, Apple’s market cap had plummeted. In 1996 and 1997, the company was months away from bankruptcy, with its valuation dipping below $2.5 billion.
The turning point occurred in late 1996 when Apple acquired NeXT for $429 million, bringing Steve Jobs back as an advisor and later as interim CEO. This period is critical because it established the software foundation (macOS) that would eventually power the company’s resurgence.
The Renaissance: The Return of Steve Jobs (1997–2011)
The decade between 1997 and 2007 is often cited as the most significant turnaround in corporate history. Under Jobs, Apple simplified its product line and launched the iMac G3 in 1998, which returned the company to profitability. By the early 2000s, the market cap began a steady climb.
- The iPod (2001): This device transformed Apple from a computer company into a consumer electronics powerhouse. The introduction of the iTunes Store in 2003 created a vertical ecosystem, tethering hardware to digital sales.
- The iPhone (2007): Perhaps the most impactful product in financial history, the iPhone redefined the smartphone. In January 2007, when the iPhone was announced, Apple’s market cap was around $75 billion. By the end of 2007, it had surpassed $100 billion.
- The iPad (2010): Further diversifying the revenue stream, the iPad solidified Apple’s lead in the "post-PC" era.
By the time Steve Jobs passed away in October 2011, Apple’s market cap had reached approximately $350 billion, making it one of the most valuable companies in the world, rivaling ExxonMobil for the top spot.
The Tim Cook Era: Scaling to Unprecedented Heights (2011–2020)
When Tim Cook took over as CEO in 2011, many skeptics doubted Apple’s ability to innovate without Jobs. However, Cook focused on operational excellence, global supply chain optimization, and "financial engineering" through a massive capital return program.
Between 2012 and 2020, Apple began returning hundreds of billions of dollars to shareholders through dividends and share buybacks. Buybacks are particularly relevant to market cap history because they reduce the number of shares outstanding. Even when the total market cap remained flat, the share price often rose because the earnings were spread across fewer shares.
- The $1 Trillion Milestone (August 2, 2018): Apple became the first U.S. company to hit this mark. This growth was driven by the success of the iPhone X and the burgeoning Services segment (App Store, iCloud, Apple Music).
- The $2 Trillion Milestone (August 19, 2020): In a surprising turn, Apple doubled its valuation in just two years. Despite the global pandemic, the demand for "work-from-home" technology (Macs and iPads) and the resilience of the App Store economy propelled the company upward.
Navigating the 2020s: The Path to $3 Trillion and Beyond
The early 2020s were defined by a transition to silicon independence. By replacing Intel chips with its own M-series processors, Apple increased its margins and improved product performance, further justifying its premium valuation.
On January 3, 2022, Apple briefly became the first company to touch a $3 trillion market cap during intraday trading. Although it retreated due to interest rate hikes and inflationary pressures later that year, it reclaimed the $3 trillion closing mark in June 2023.
The Impact of Apple Intelligence (2024–2025)
Heading into 2024 and 2025, the primary driver of Apple's valuation became "Apple Intelligence"—its proprietary suite of generative AI features. While critics initially argued that Apple was "late" to the AI race compared to Microsoft and Google, the company’s strategy of integrating AI directly into the operating system at the silicon level (On-Device AI) encouraged a massive upgrade cycle for iPhone 16 and iPhone 17 models. This "AI Supercycle" helped sustain the market cap above the $3 trillion floor throughout 2025.
Historical Market Cap Comparison Table
The following table outlines key milestones in Apple's valuation history, illustrating the accelerating pace of its growth.
| Date | Approximate Market Cap | Key Milestone/Event |
|---|---|---|
| Dec 12, 1980 | $1.8 Billion | Initial Public Offering (IPO) |
| Dec 1996 | $2.3 Billion | Acquisition of NeXT / Return of Steve Jobs |
| Jan 2007 | $75 Billion | Introduction of the first iPhone |
| Mar 2011 | $300 Billion | iPad 2 launch; post-Great Recession recovery |
| Aug 2018 | $1 Trillion | First U.S. company to reach $1T |
| Aug 2020 | $2 Trillion | Pandemic-driven tech surge; 5G iPhone 12 anticipation |
| Jan 2022 | $3 Trillion | Intraday peak; M-series chip success |
| June 2023 | $3 Trillion | First sustained close above $3T |
| Late 2025 | $3.5+ Trillion | Apple Intelligence rollout and AI-integrated hardware |
Factors Driving Apple's Valuation Growth
Several structural factors explain why Apple’s market cap history follows an exponential rather than linear curve.
1. The Ecosystem "Moat"
Apple’s "walled garden" creates high switching costs. Once a user owns an iPhone, an Apple Watch, and uses iCloud, the friction involved in moving to Android or Windows becomes a deterrent. This leads to high customer lifetime value (LTV), which investors reward with a higher price-to-earnings (P/E) multiple.
2. Services Segment Expansion
Under Tim Cook, Apple shifted its focus toward Services. In 2026, the Services division—comprising the App Store, Apple Pay, Apple TV+, and advertising—operates with significantly higher margins than hardware. This shift essentially transformed Apple from a hardware company (which typically has lower valuations) into a software-and-services hybrid.
3. Share Buybacks and Dividends
Apple’s capital allocation strategy is unprecedented. By spending over $600 billion on buybacks over the last decade, Apple has effectively retired a significant portion of its share count. This increases the ownership stake of remaining shareholders and supports the stock price even when revenue growth is modest.
4. Supply Chain Dominance
Apple’s ability to secure components (like TSMC-manufactured chips) at scale gives it a cost and performance advantage over competitors. During global supply chain disruptions in the early 2020s, Apple’s scale allowed it to maintain inventory levels that others could not, further consolidating its market share.
Competitive Landscape: The Race for the Top Spot
Apple does not exist in a vacuum. Its market cap history is often a game of "musical chairs" with other tech giants.
- Microsoft: Historically Apple's greatest rival, Microsoft surpassed Apple in valuation in early 2024 due to its early lead in enterprise AI and partnership with OpenAI.
- Nvidia: By 2024 and 2025, Nvidia’s explosive growth in GPU demand briefly pushed it into competition for the title of the world's most valuable company.
- Alphabet (Google) and Amazon: While both have reached the trillion-dollar club, they have generally trailed Apple in total market cap due to lower hardware margins and different regulatory challenges.
As of 2026, the "Magnificent Seven" stocks continue to dominate the S&P 500, with Apple often trading places with Microsoft for the #1 position depending on quarterly earnings results and the perceived success of their respective AI implementations.
Future Outlook: What Influences Apple’s Market Cap in 2026 and Beyond?
Looking forward from 2026, several variables will determine if Apple can reach a $4 trillion or $5 trillion valuation:
- Monetization of AI: Investors are looking for Apple to move beyond "free" AI features included with hardware and toward a "Siri Premium" or AI-subscription model.
- Regulatory Pressure: Anti-monopoly lawsuits in the U.S. and EU regarding the App Store’s "tax" and the integration of default services remain the largest risks to Apple’s valuation.
- Expansion into New Verticals: With the "Apple Car" project officially shuttered in 2024, the focus has shifted to Spatial Computing (Vision Pro) and robotics. The success of the second and third generations of the Vision Pro will be a major factor in growth projections for the late 2020s.
FAQ
What was Apple's lowest market capitalization?Following its 1980 IPO, Apple’s valuation hit several low points during the mid-1990s. In 1997, prior to the Microsoft investment and the launch of the iMac, its market cap fell to approximately $2 billion. Adjusted for inflation, this remains the most precarious period in the company’s history.
Why did Apple's market cap grow so quickly during the pandemic?The COVID-19 pandemic accelerated digital transformation. Demand for MacBooks and iPads for remote work and school spiked, while App Store revenue increased as people spent more on mobile gaming and digital entertainment. Additionally, low interest rates led investors to seek safety in "Big Tech" stocks with strong cash flows.
How do share buybacks affect Apple's market cap?Share buybacks reduce the number of shares outstanding. While a buyback technically reduces the company's cash assets (which could slightly lower market cap), it usually increases the share price because each remaining share represents a larger percentage of the company. Over the long term, Apple’s aggressive buybacks have been a primary driver of its stock price appreciation.
Who are Apple's main competitors for market cap dominance?As of 2026, the main competitors are Microsoft and Nvidia. Microsoft competes via its enterprise cloud and AI leadership, while Nvidia’s valuation is driven by its hardware dominance in the data center and AI training markets.
When did Apple first reach $1 trillion?Apple officially reached a $1 trillion market capitalization on August 2, 2018. It was the first publicly traded U.S. company to achieve this feat, following the Chinese state-controlled PetroChina, which briefly touched $1 trillion in 2007.
Practical Recommendation for Observers
For those tracking Apple’s market capitalization history, it is essential to look beyond the "headline" trillion-dollar numbers. Focus on the Price-to-Earnings (P/E) ratio and Services revenue growth. A rising market cap accompanied by expanding Services margins suggests a healthy, sustainable valuation. Conversely, if the market cap rises while hardware sales decline and P/E ratios stretch to historical highs (above 35x), it may indicate that the stock is becoming overvalued relative to its fundamental growth.
Investors should also monitor the quarterly 10-Q and annual 10-K filings with the SEC to track the exact number of shares outstanding, as Apple's ongoing buyback program continuously alters the math behind its market cap.