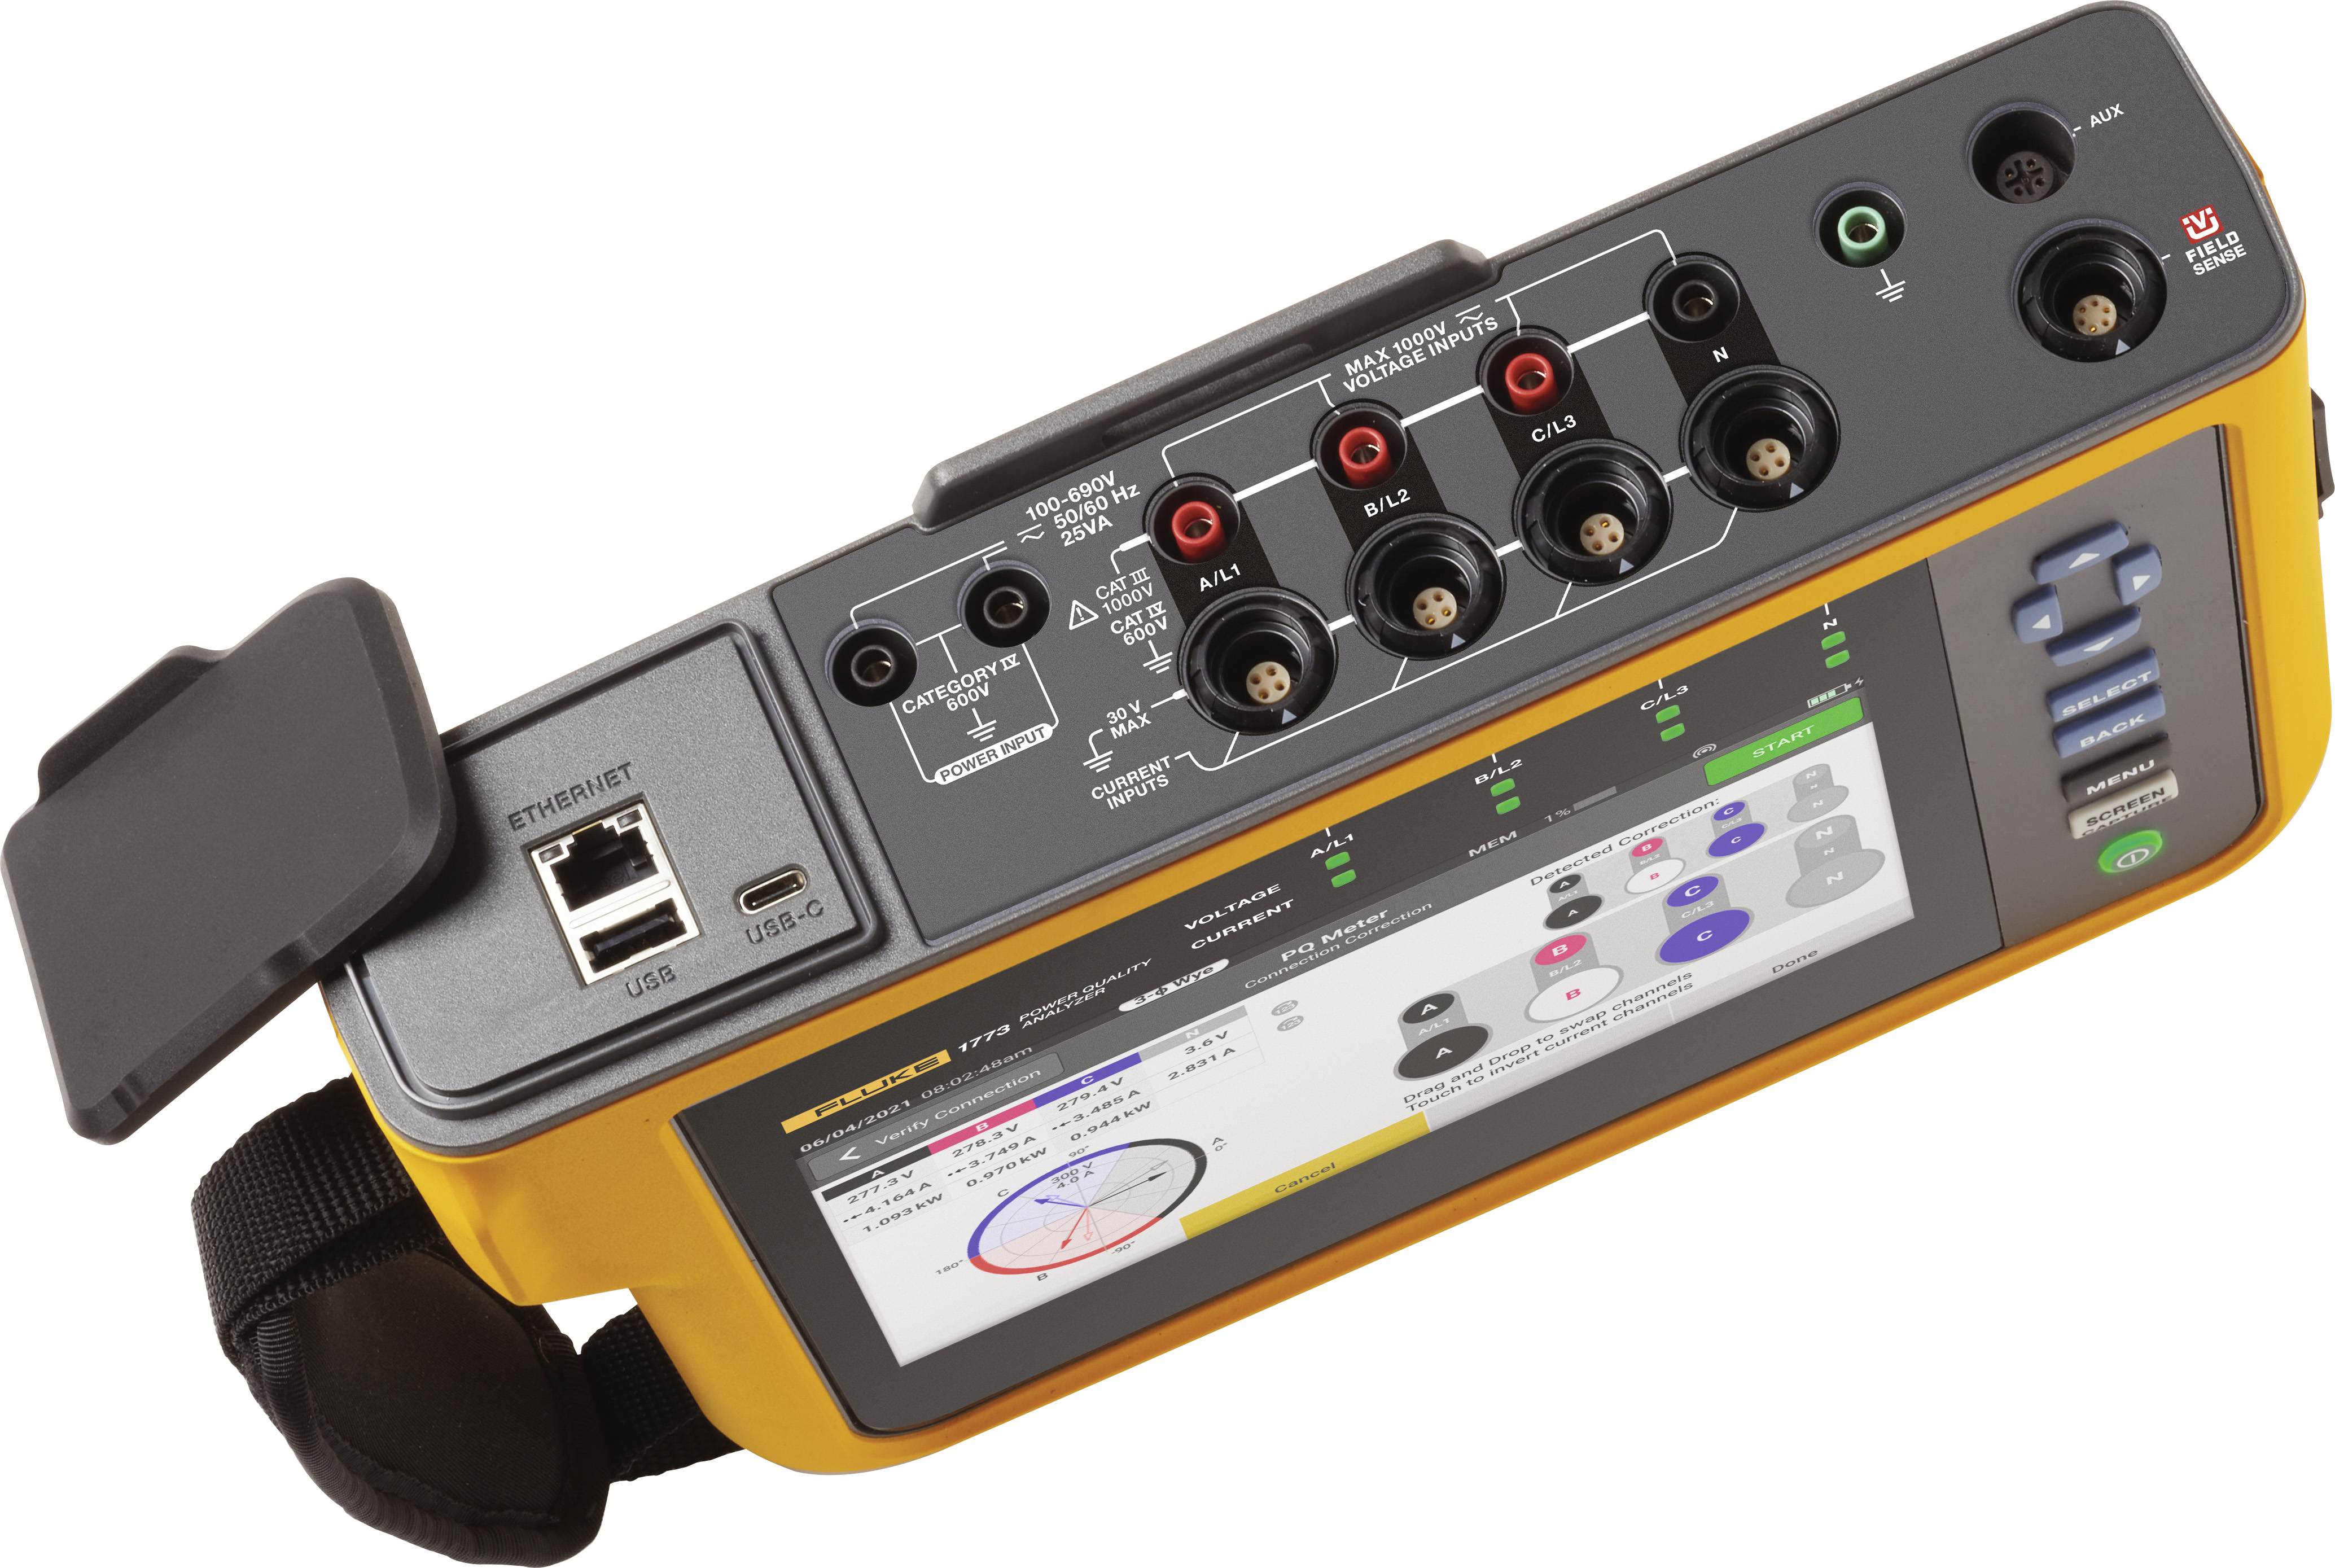
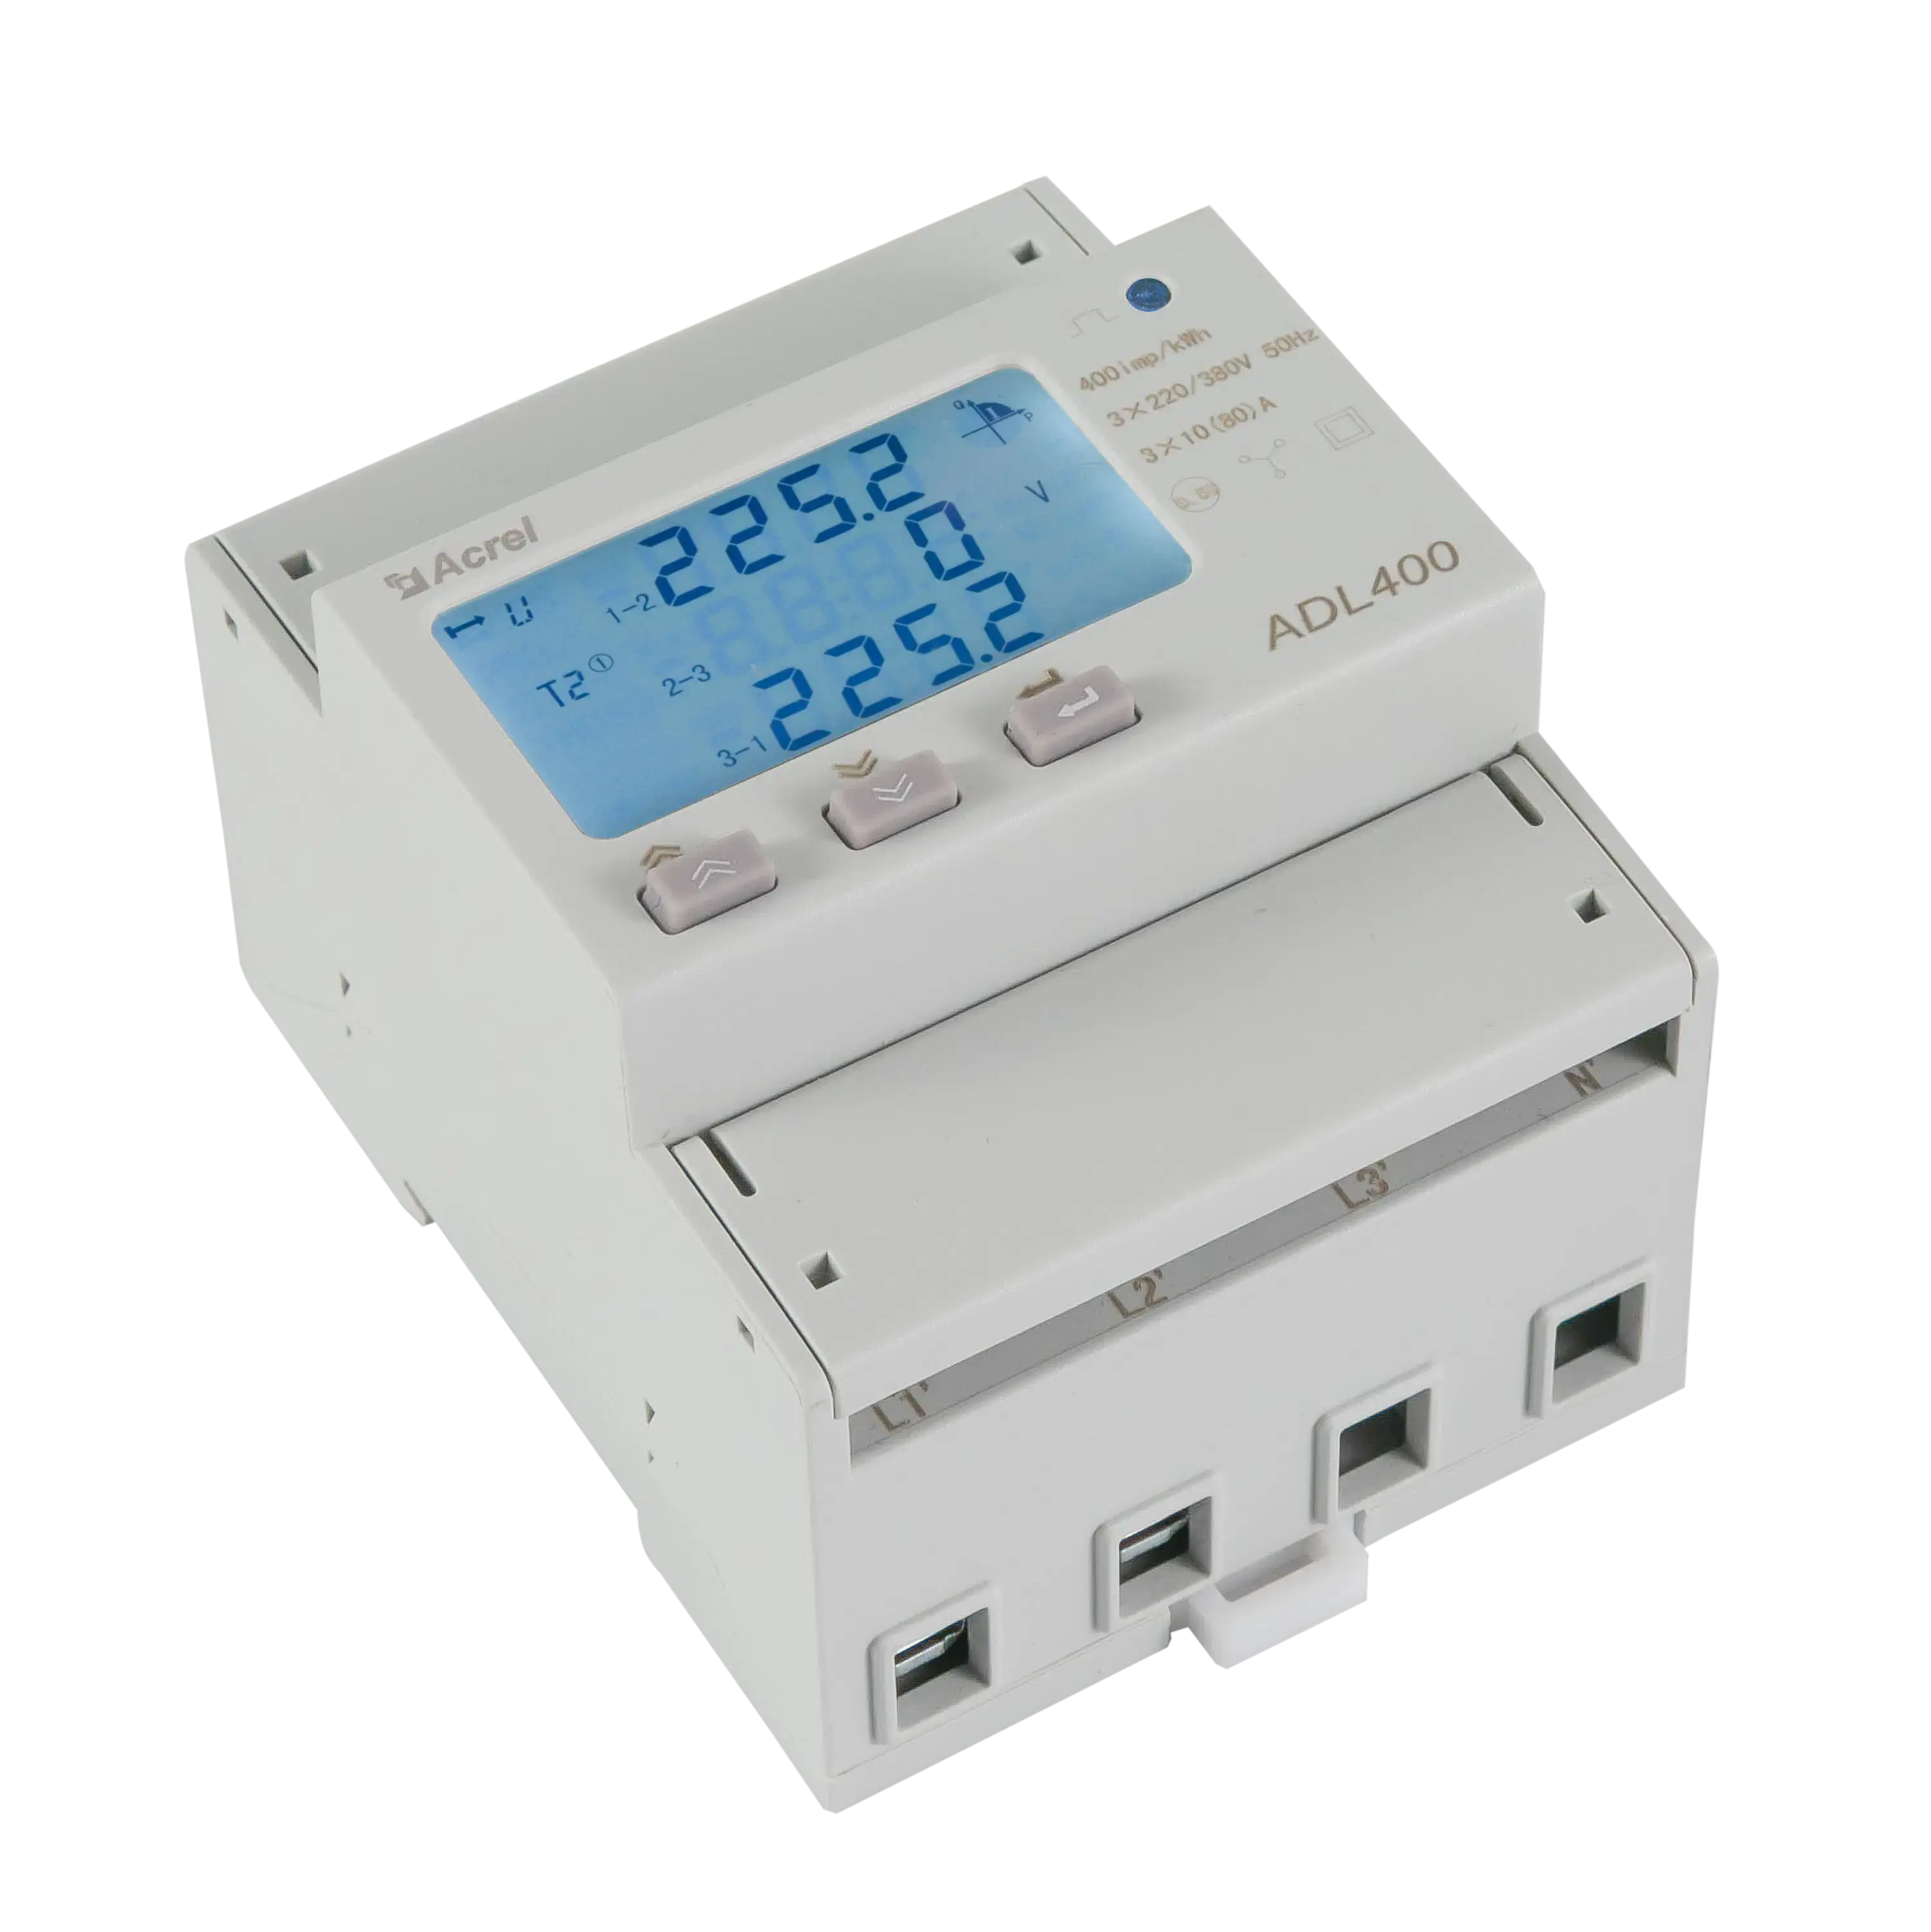
A 3 phase power meter data logger is a specialized electronic monitoring device used to continuously measure, record, and store electrical parameters—such as voltage, current, active power, reactive power, power factor, and frequency—across a three-phase electrical system over an extended period. This instrumentation allows engineers, facility managers, and energy auditors to capture transient anomalies, analyze load profiles, and verify compliance with utility standards.
Understanding 3 Phase Power Systems and Data Logging
To appreciate the function of a 3 phase power meter data logger, one must first examine the fundamentals of three-phase electrical distribution. Unlike single-phase systems commonly found in residential environments, three-phase systems utilize three distinct alternating current conductors that carry waves of the same frequency but are separated by one-third of a cycle (120 degrees). This configuration delivers a constant, balanced transfer of power to large commercial and industrial loads, minimizing voltage drops and reducing conductor material requirements.
Data logging introduces a temporal dimension to these measurements. While a standard handheld digital multimeter provides a momentary snapshot of electrical values, a data logger tracks changes over minutes, hours, days, or even months. By recording time-stamped intervals of voltage sags, current spikes, harmonic distortion, and power consumption trends, technicians can diagnose intermittent faults that defy casual inspection. These devices bridge the gap between real-time metering and long-term energy management, providing actionable intelligence for facility operations.
Core Technical Specifications to Evaluate
Selecting the appropriate hardware requires a thorough understanding of key electrical and performance specifications. Choosing a logger with inadequate ratings can result in distorted data, damaged equipment, or catastrophic safety failures.
Voltage and Current Inputs
Three-phase systems operate across various voltage levels, from low-voltage 208V/480V commercial feeds to medium-voltage industrial lines via potential transformers (PTs). The data logger must accommodate the specific nominal voltage of the target system.
- Direct-connect loggers accept direct inputs up to a specified limit (often 600V CAT III or CAT IV).
- Transformer-coupled loggers accept inputs scaled down by Current Transformers (CTs) and Potential Transformers (PTs).
Current measurement is equally critical. Technicians typically utilize flexible Rogowski coils or solid/split-core current transformers to capture current without breaking the circuit. The logger's current inputs must match the output signal of these sensors, usually expressed as millivolts (mV), 1A, or 5A secondary ratings.
Sampling Rate and Memory Capacity
The intended application dictates the required sampling speed.
- Energy auditing and load profiling require logging intervals of 1 minute to 15 minutes, which demands minimal memory and battery preservation.
- Power quality analysis (detecting harmonics, flickers, and rapid transients) requires high-speed sampling rates, often capturing thousands of samples per cycle, necessitating deep onboard memory and fast processors.
Storage media ranges from internal flash memory to removable SD cards or secure cloud storage integrations via Wi-Fi, Ethernet, or cellular modems.
Feature Comparison of Common Data Logger Categories
Different operational scenarios require distinct instrument classes. The table below outlines the primary categories of three-phase power logging devices, highlighting their typical applications, strengths, and limitations.
| Logger Category | Typical Use Case | Primary Strengths | Key Limitations |
|---|---|---|---|
| Basic Energy Loggers | Long-term kWh submetering, tenant billing, carbon footprint tracking. | Cost-effective, long battery life, simple setup. | Lack of advanced power quality or harmonic analysis. |
| Power Quality Analyzers | Troubleshooting complex industrial machinery, diagnosing sensitive electronic failures. | High sampling rates, captures dips, swells, and harmonics. | High cost, steeper learning curve, complex data software. |
| Portable Troubleshooting Meters | Field service audits, temporary load checks, quick diagnostics. | Highly mobile, magnetic mounts, rapid deployment. | Battery-dependent, limited onboard storage for long-term studies. |
| Fixed Panel-Mount Monitors | Permanent facility sub-metering, SCADA integration, automated energy management. | Continuous operation, hardwired power, real-time communication protocols (Modbus, BACnet). | Requires professional installation, non-portable. |
Step-by-Step Installation and Deployment Process
Deploying a 3 phase power meter data logger in an industrial or commercial environment requires strict adherence to electrical safety protocols and manufacturer guidelines. Improper installation exposes personnel to arc-flash hazards and invalidates recorded data.
1. Safety Preparations and Personal Protective Equipment (PPE)
Before opening any electrical panel, verify that the work complies with local electrical safety regulations (such as NFPA 70E in the United States). Wear appropriate arc-flash rated PPE, safety glasses, and insulated gloves. Whenever possible, de-energize the equipment during sensor installation; if live working is unavoidable, utilize rated insulated tools and qualified personnel procedures.
2. Sensor Placement and Wiring
- Voltage Leads: Connect the phase voltage leads (typically labeled L1, L2, L3) to the corresponding phases of the distribution board, and attach the neutral and ground leads securely. Ensure inline fuses are present on the voltage leads to protect the meter and wiring.
- Current Sensors: Attach the CTs or Rogowski coils around the phase conductors (A, B, and C). Pay strict attention to the directional arrows on the sensors; pointing them away from the source toward the load is essential for accurate real power and power factor calculations. Ensure the correct phase orientation (e.g., CT1 on Phase A, CT2 on Phase B, CT3 on Phase C).
3. Configuration and Calibration
Power on the data logger using its internal battery, external power supply, or control power tap. Connect the device to a computer or mobile tablet via USB, Bluetooth, or local Wi-Fi. Using the manufacturer's software:
- Enter the exact PT and CT ratios.
- Select the correct wiring configuration (e.g., 3-phase 3-wire Delta, 3-phase 4-wire Wye).
- Set the logging interval and time synchronization.
4. Verification and Baseline Testing
Before leaving the logger to record unattended, review the real-time display or live software dashboard. Verify that voltage levels match expected utility values, current readings correspond to active equipment loads, and the power factor is realistic (typically between 0.80 and 0.95 inductive in industrial settings). An inverted power factor or negative active power reading indicates reversed CT polarity or phase mismatch.
Practical Applications and Data Analysis
Once the data collection period concludes—ranging from a 7-day utility profile to a 30-day facility audit—the raw dataset must be exported and interpreted.
Identifying Peak Demand Charges
Commercial utility bills often incorporate demand charges based on the highest average power consumption over a specific window (commonly 15 or 30 minutes) within the billing cycle. A 3 phase power meter data logger highlights these peaks, enabling facility managers to implement peak-shaving strategies, such as staggering heavy machinery startup times or utilizing energy storage systems.
Diagnosing Power Quality Issues
Modern facilities rely heavily on nonlinear loads, such as variable frequency drives (VFDs), LED lighting drivers, and switched-mode power supplies. These devices introduce harmonic distortions that can overheat transformers, trip circuit breakers prematurely, and degrade motor insulation. Advanced data loggers quantify Total Harmonic Distortion (THD) for both voltage and current, allowing engineers to size harmonic filters or active power filters correctly.
Common Mistakes and Troubleshooting Strategies
Even experienced technicians occasionally encounter issues during power logging studies. Recognizing these pitfalls prevents wasted time and corrupted data.
- Incorrect Phase Rotation Settings: If the logger reports unexpected active power or reactive power values despite correct physical hookups, verify the phase sequence configuration in the software. Mismatched ABC vs. CBA rotation leads to profound calculation errors.
- Loose CT Connections: High-resistance connections on secondary CT leads can generate dangerous high voltages and corrupt data readings. Always ensure shorting blocks are used if disconnecting live CTs (though primary current should be isolated first).
- Clock Drift: For long-term studies involving multiple instruments or correlation with utility smart meters, ensure all device internal clocks synchronize via Network Time Protocol (NTP) or manual configuration prior to deployment.
- Ignoring Environmental Limits: Deploying a non-weatherproof logger in a damp or outdoor environment without a NEMA-rated enclosure will lead to hardware failure and data loss.
Professional Advisory Notice
Electrical testing and data logging involve exposure to lethal voltages and high fault-current environments. This article serves for informational and educational purposes only and does not substitute for professional electrical engineering services, certified training, or adherence to local electrical codes. Always consult qualified electricians and manufacturer documentation before undertaking electrical measurements.
Frequently Asked Questions
What is the difference between a standard energy meter and a 3 phase power meter data logger?
A standard energy meter typically displays cumulative energy consumption (kWh) on a local screen for billing purposes. A 3 phase power meter data logger records a wide array of electrical parameters over time, storing time-stamped data points that can be downloaded and analyzed using software to diagnose power quality and load profiles.
Can a 3 phase data logger be used on single-phase systems?
Many 3 phase data loggers are versatile enough to be configured for single-phase or split-phase (120/240V) monitoring by simply utilizing one or two of the available voltage and current channels. However, users must consult the manufacturer manual to ensure proper channel configuration and input rating compliance.
How long can a data logger run unattended?
Unattended runtime depends primarily on the logging interval, the number of active channels, and the storage capacity or battery life. A device logging basic RMS parameters every 15 minutes may run for months on internal flash memory, whereas high-speed power quality event logging can fill memory within hours.
What causes a negative power factor reading on a data logger?
A negative power factor or negative active power reading almost always indicates that a current transformer (CT) has been installed backward relative to the voltage reference, or that the phase leads and CT leads do not correspond correctly (e.g., Phase A voltage paired with Phase B current).
Do I need to de-energize equipment to install a power data logger?
De-energizing equipment is always the safest approach and is recommended whenever possible. However, many modern loggers utilize flexible Rogowski coils and voltage clips designed for temporary connection using insulated PPE, allowing installation on energized panels by qualified professionals.