A/B testing, or split testing, is a controlled experimental method used to compare two versions of a digital asset—such as a webpage, email, or mobile app feature—to determine which performs better against a defined metric. By randomly splitting traffic between an original (Control) and a modified version (Variant), organizations identify statistically significant improvements based on user behavior rather than intuition.
The Core Mechanism of A/B Testing
At its most fundamental level, A/B testing is an application of the scientific method within a digital environment. The process begins with a hypothesis: a measurable assumption that a specific change will result in a better outcome. For example, changing a call-to-action (CTA) button color from grey to green may be hypothesized to increase click-through rates (CTR) by drawing more visual attention.
To test this, a software platform manages the distribution of visitors. Half of the incoming traffic is shown the Control (A), while the other half is shown the Variant (B). It is critical that the assignment is randomized and persistent, ensuring that if a user visits the site multiple times, they see the same version throughout the duration of the experiment. This consistency prevents "experience fragmentation," which could skew the data and invalidate the results.
Necessary Prerequisites for Successful Testing
Before launching an A/B test, several technical and structural prerequisites must be in place. Without these, the data collected may be noisy, biased, or statistically insignificant.
- Sufficient Traffic Volume: A test requires a baseline of visitors to achieve statistical significance. If a site has low traffic, it may take months to gather enough data points to distinguish a genuine improvement from random chance.
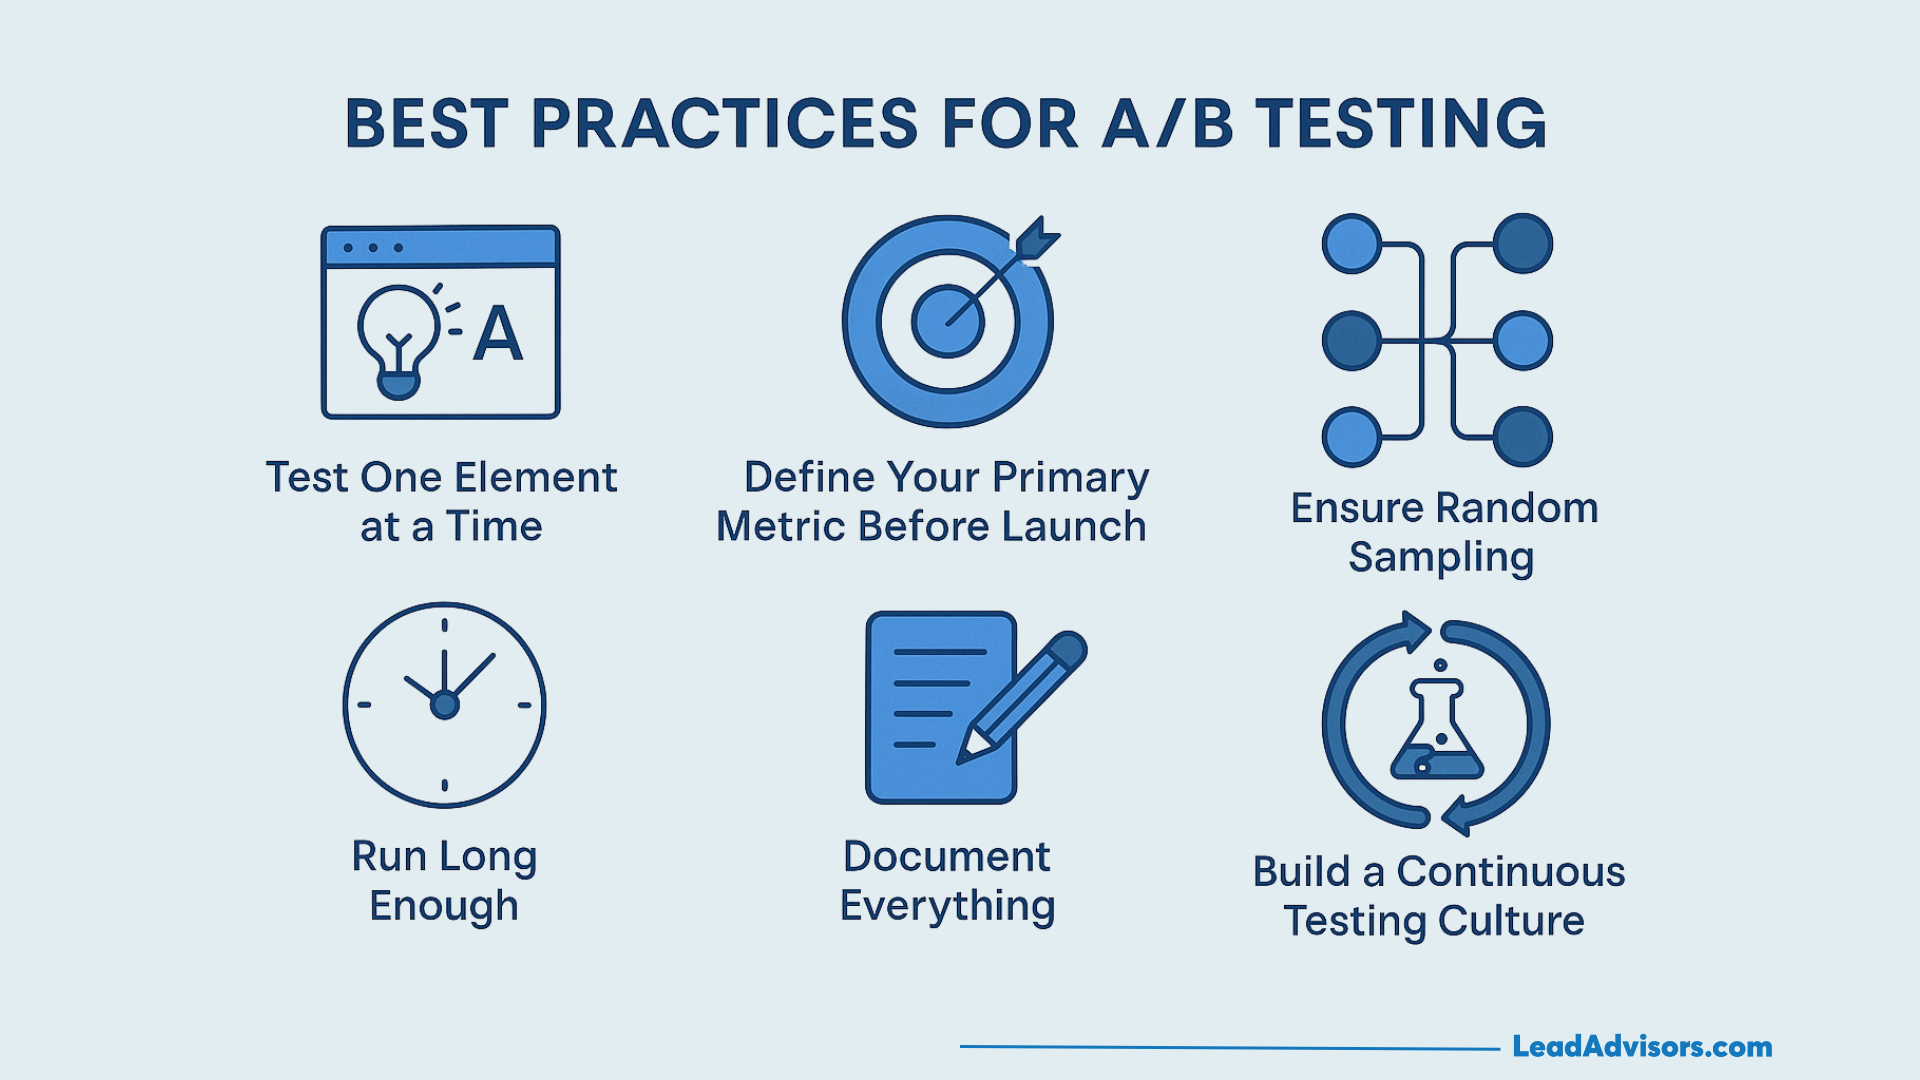
- Clear Success Metrics: You must define the Key Performance Indicator (KPI) before the test begins. Whether it is the conversion rate, average order value, or bounce rate, the metric must be tracked accurately by your testing platform.
- Experimental Duration: A test must run for at least one full business cycle (typically at least one or two weeks) to account for daily and weekly fluctuations in user behavior, such as differences between weekday and weekend activity.
- Baseline Integrity: You must ensure that tracking pixels and analytics tools are correctly configured. If your data collection is flawed, the outcome of the experiment will be based on inaccurate information.
The Workflow of an A/B Test
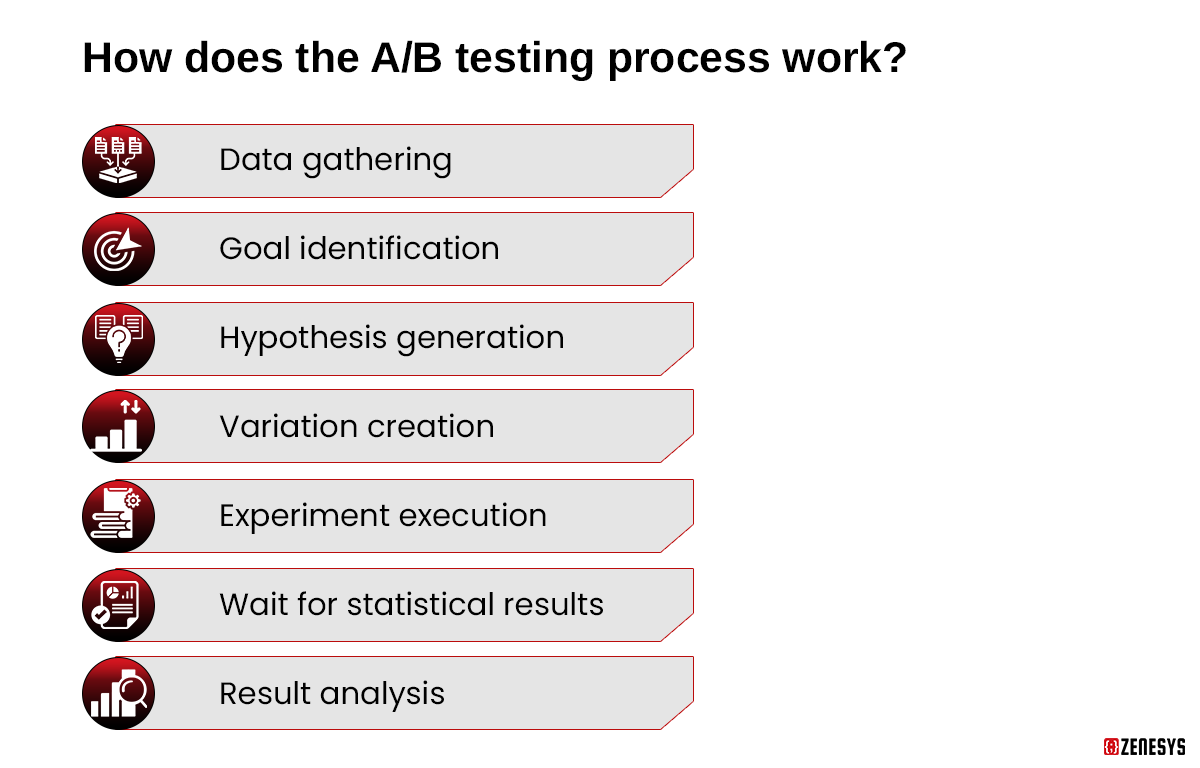
Executing a rigorous A/B test involves a structured workflow that minimizes errors and maximizes the validity of the results.
- Observation and Research: Use qualitative and quantitative data to identify pages with high friction or low conversion. Look at heatmaps, session recordings, and funnel analytics to find bottlenecks.
- Hypothesis Formation: State your hypothesis clearly: "I believe that [Change X] will lead to [Result Y] because [Reason Z]."
- Design and Implementation: Create the variant. This can involve anything from simple text changes to complex layout overhauls. Ensure the variant is technically stable and mobile-responsive.
- Execution: Launch the test and allow it to run until the pre-determined sample size is reached. Do not stop the test early because it "looks like a winner"—this is known as the "peeking problem," and it drastically increases the likelihood of a false positive.
- Data Analysis: Use statistical analysis to confirm that the observed difference is statistically significant (usually calculated with a p-value of 0.05 or lower).
- Implementation and Iteration: If the variant wins, implement it as the new control. If the null hypothesis holds true, document the learning and use the insights to inform future test ideas.
Comparative Methods: A/B Testing vs. Multivariate Testing
While A/B testing is the standard for comparing two distinct versions, more complex scenarios may call for alternative methodologies. Understanding these differences is essential for choosing the right tool for the job.
| Feature | A/B Testing | Multivariate Testing (MVT) |
|---|---|---|
| Complexity | Low | High |
| Traffic Needed | Moderate | High |
| Primary Goal | Testing one major change | Testing multiple variable combinations |
| Execution Time | Faster | Slower |
| Outcome Insight | Which version works best | Which combination of elements works best |
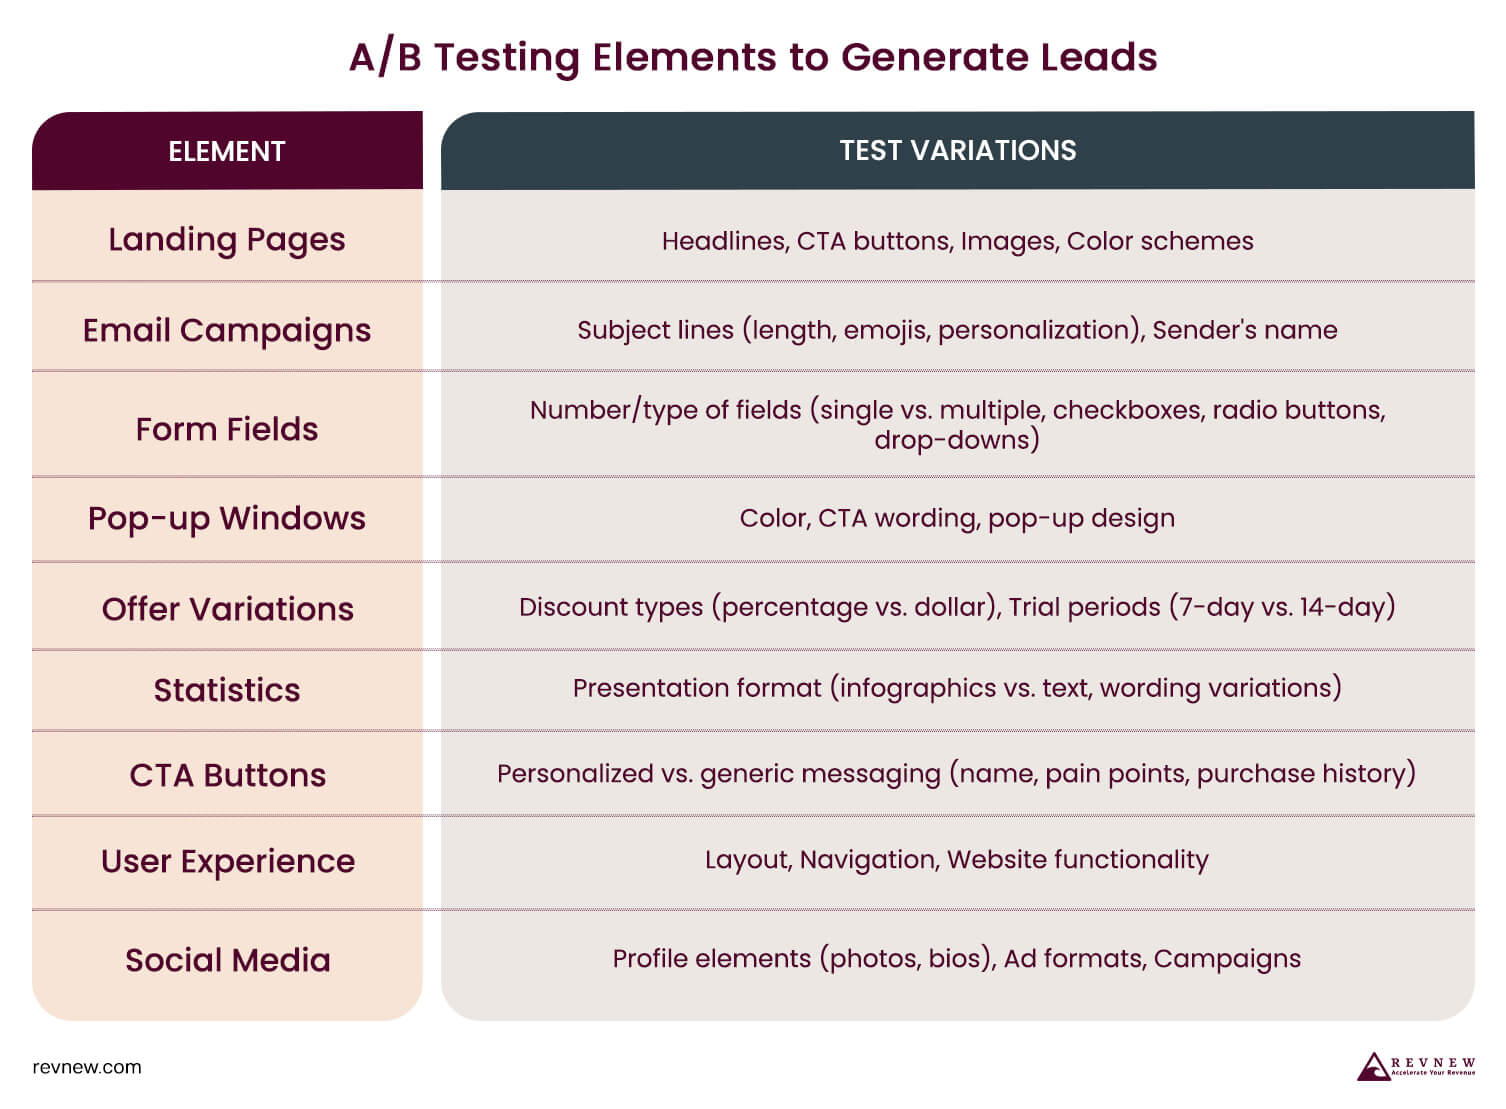
A/B testing is ideal for testing high-impact changes, such as value propositions, hero images, or major page layouts. Multivariate testing, by contrast, tests multiple elements on a page (e.g., headline, button color, and image) simultaneously to see which combination yields the highest conversion. Because MVT divides traffic into many small buckets, it requires significantly higher traffic volume to reach statistical significance.
Common Mistakes and Risks
Even with the right tools, common pitfalls can lead to flawed insights.
- Testing Too Many Variables: If you change the headline, the image, and the color scheme in one variant, you will not know which specific change caused the shift in performance. This is why testing one variable at a time is the industry standard for A/B testing.
- Ignoring Statistical Power: A test without a high enough sample size often reports "winners" that are actually just noise. Always calculate the required sample size before starting a test.
- Running Too Many Tests Simultaneously: If you run two tests on the same page at the same time, the results of one may influence the other, making it impossible to isolate the impact of either change.
- Confirmation Bias: Developing a strong attachment to one version can lead to ignoring data that suggests your hypothesis was incorrect. Treat every test as an opportunity to learn, not as a chance to confirm an existing belief.
Establishing Statistical Significance
Statistical significance is the degree to which you can be confident that your results are not due to chance. In 2026, most professional testing platforms utilize Bayesian or Frequentist statistical models to provide this calculation automatically.
The "p-value" represents the probability that your results occurred randomly. A p-value of 0.05 indicates there is a 5% risk that the observed difference happened by coincidence. When a test reaches statistical significance, it means the delta between the Control and the Variant is large enough that the results are likely replicable. However, statistical significance is not the same as practical significance; a tiny improvement might be statistically significant but not worth the cost of maintaining the code or design changes.
Ethical Considerations and User Impact
While optimization is generally focused on business metrics, it is vital to keep the end-user experience in mind. Over-optimization can sometimes lead to "dark patterns," where design choices are manipulated to force clicks or conversions in ways that harm user trust. Furthermore, ensure that all testing respects data privacy regulations. Ensure that any personally identifiable information (PII) is handled in accordance with regional data protection frameworks.
Frequently Asked Questions
How long should I run an A/B test? An A/B test should run for at least two weeks. This duration allows for the capture of weekly patterns and ensures that the test results account for different visitor behaviors that occur on weekends versus weekdays. Always aim for a predetermined sample size to ensure statistical validity.
What is the minimum traffic required for A/B testing? There is no "one size fits all" number. The required traffic depends on your baseline conversion rate and the minimum detectable effect (the smallest improvement you care to measure). Use an online sample size calculator to determine if your current traffic volume is sufficient to reach a reliable conclusion in a reasonable timeframe.
What do I do if my test result is inconclusive? An inconclusive result is still a valid result. It often indicates that the change you made did not have a meaningful impact on user behavior. Use this data to refine your next hypothesis. Avoid re-running the same test immediately unless you believe there was a technical error in the initial implementation.
Can I test on mobile and desktop separately? Yes, and you often should. User behavior varies significantly between devices. If a design element works well on desktop but performs poorly on mobile, you might consider device-specific testing to tailor the experience to each platform's constraints and user intents.
Recommendations for Next Actions
To begin your A/B testing journey, start by auditing your current analytics setup to ensure your conversion tracking is accurate. Select one high-traffic page that has a clear goal—such as a signup or a product purchase. Formulate a single, evidence-based hypothesis regarding a change to one element on that page. Once your testing platform is configured, launch the experiment and commit to letting it run for at least two weeks before reviewing the data. Remember that the ultimate goal is not just to "win" a test, but to build an ongoing process of iterative improvement that provides genuine value to your users.