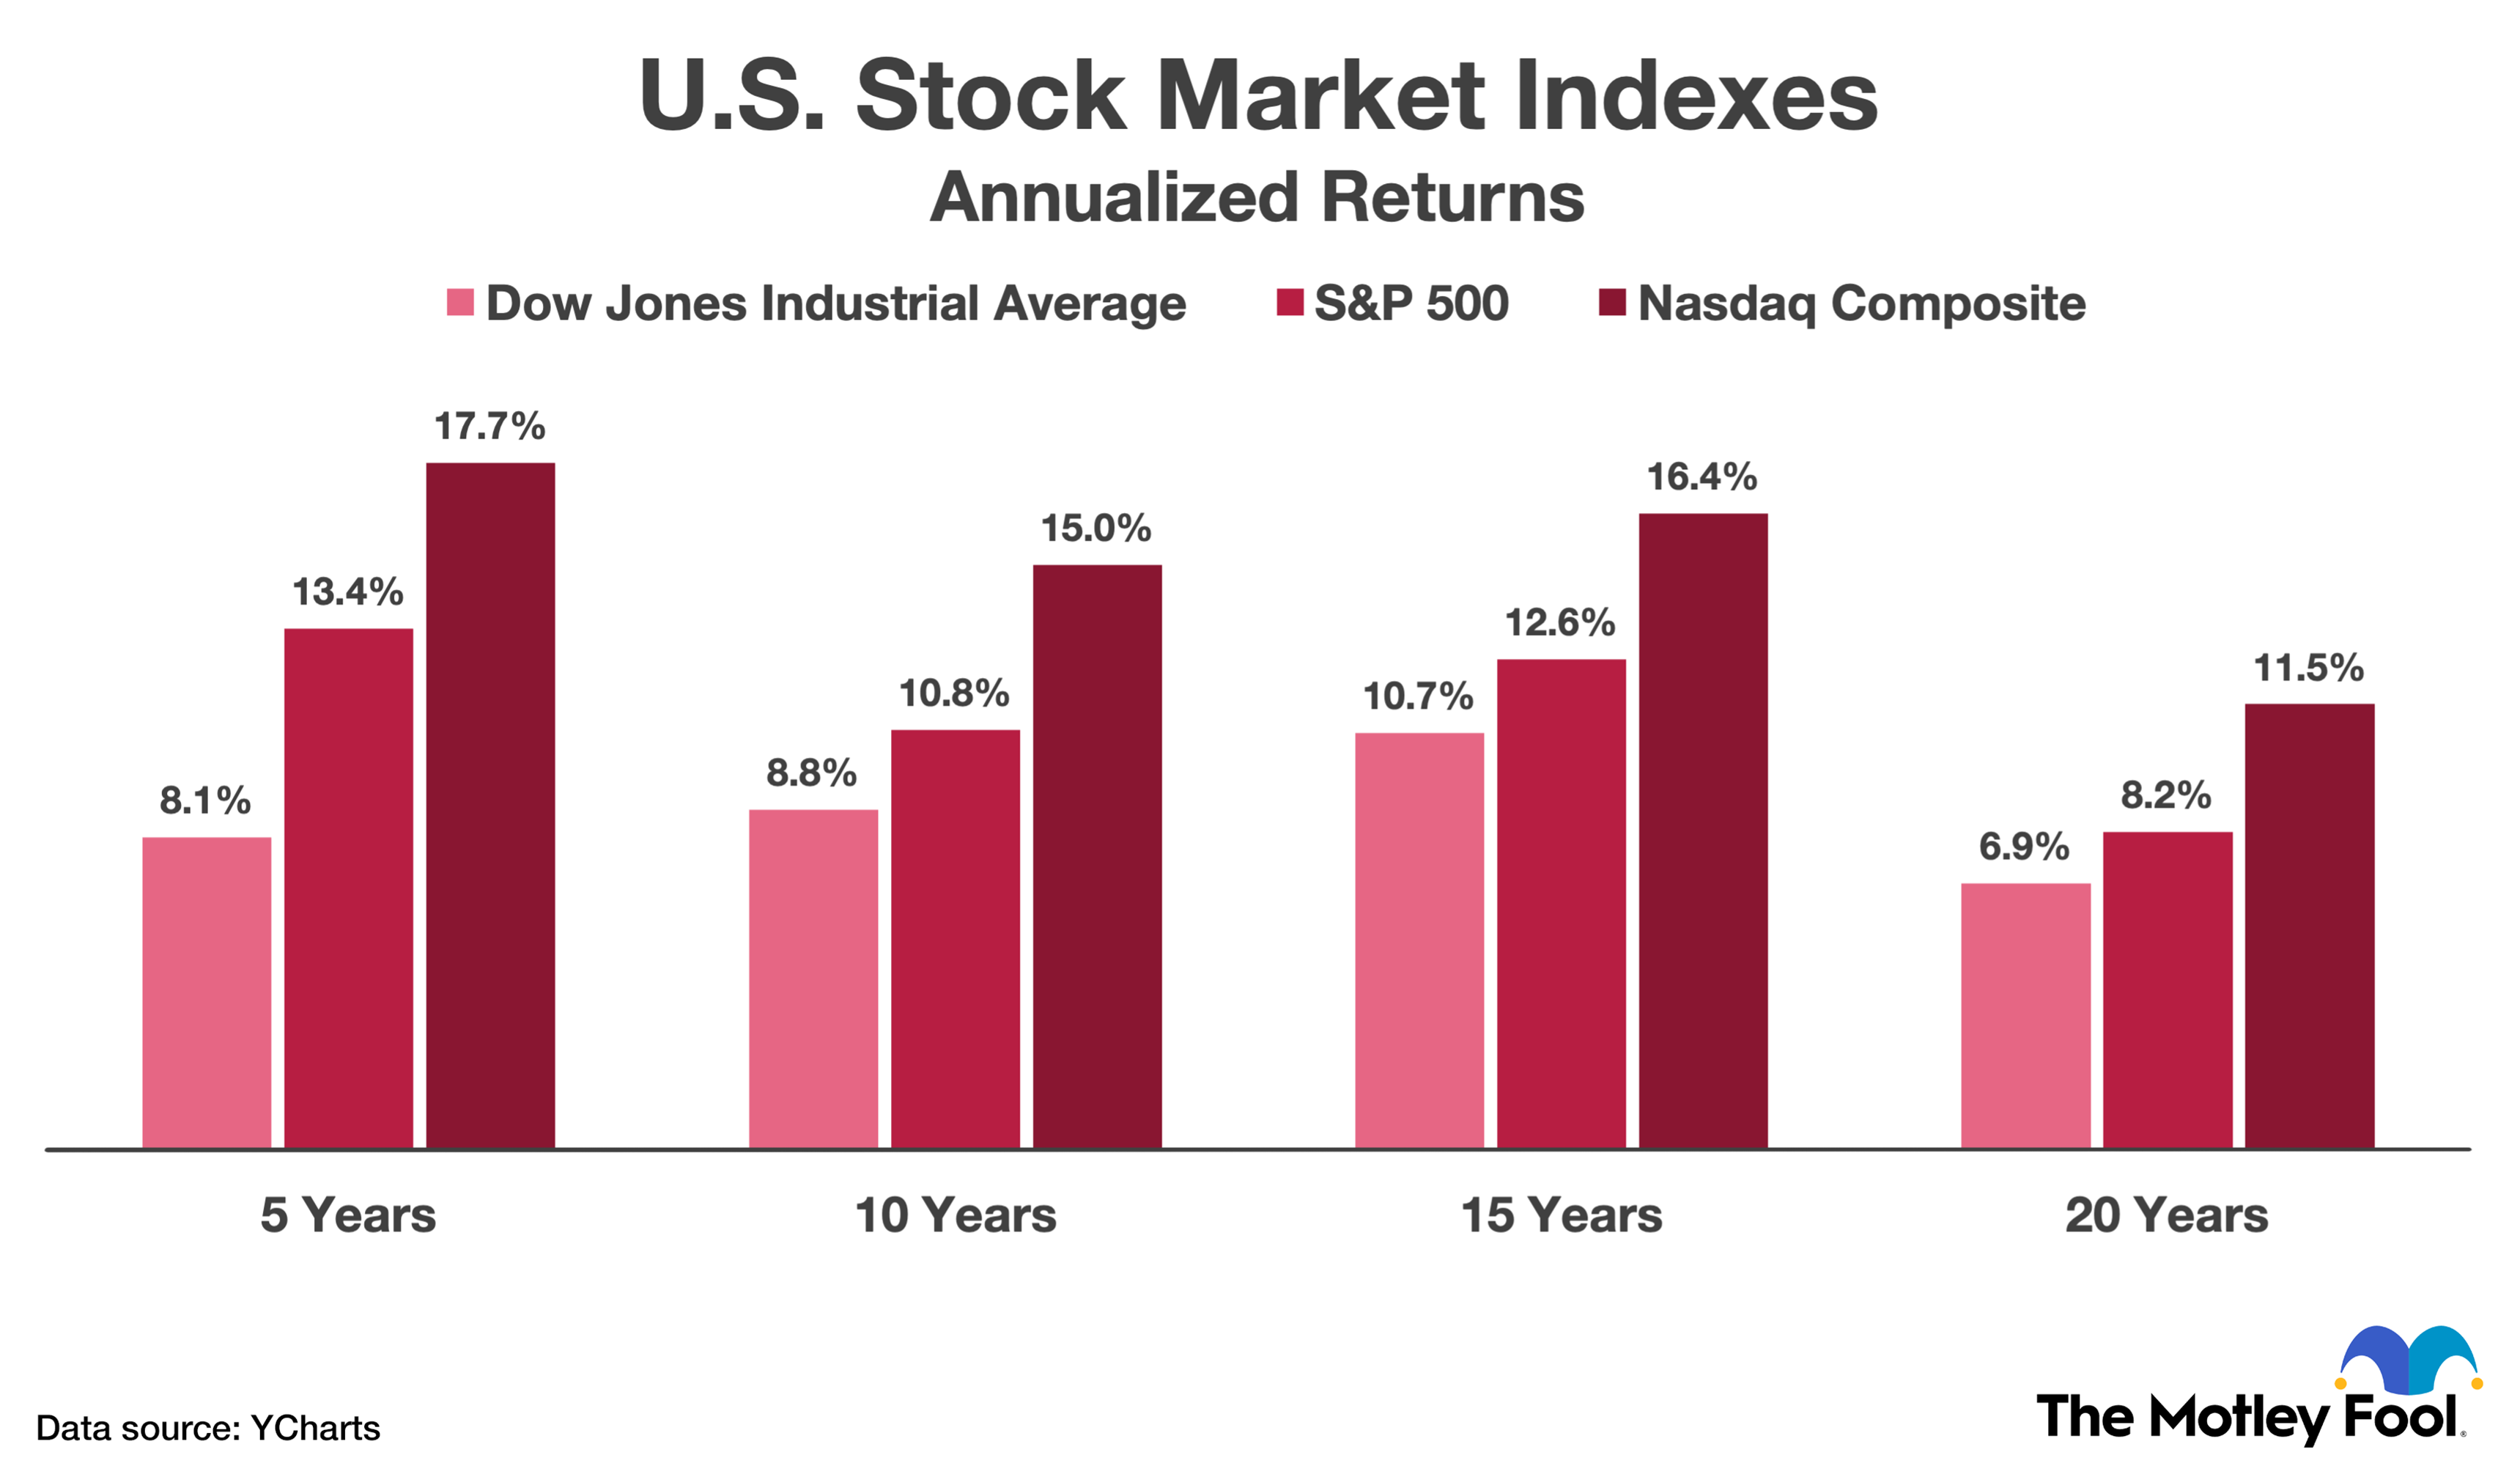
Annualized return is the geometric average amount of money earned by an investment each year over a specific time period. It accounts for the effects of compounding and provides a standardized way to compare the performance of different assets held for varying lengths of time, whether for several months or many years.
Understanding the annualized return is a fundamental requirement for any investor looking to make objective decisions in 2026's complex financial landscape. While simple returns show the total percentage gain or loss, they fail to account for the time it took to achieve those results. By "smoothing out" the returns over a yearly basis, the annualized return metric—often referred to as the Compound Annual Growth Rate (CAGR)—allows an investor to compare a three-month Treasury bill, a five-year corporate bond, and a decade-long real estate investment on an equal footing.
Understanding the Concept of Annualized Return
The primary purpose of annualization is to provide a common denominator for time. In the world of finance, time is as critical a variable as capital. If one investment returns 20% over five years and another returns 10% over one year, a novice investor might assume the first investment was more successful because the absolute percentage is higher. However, the annualized return reveals that the second investment was significantly more efficient at generating wealth per unit of time.
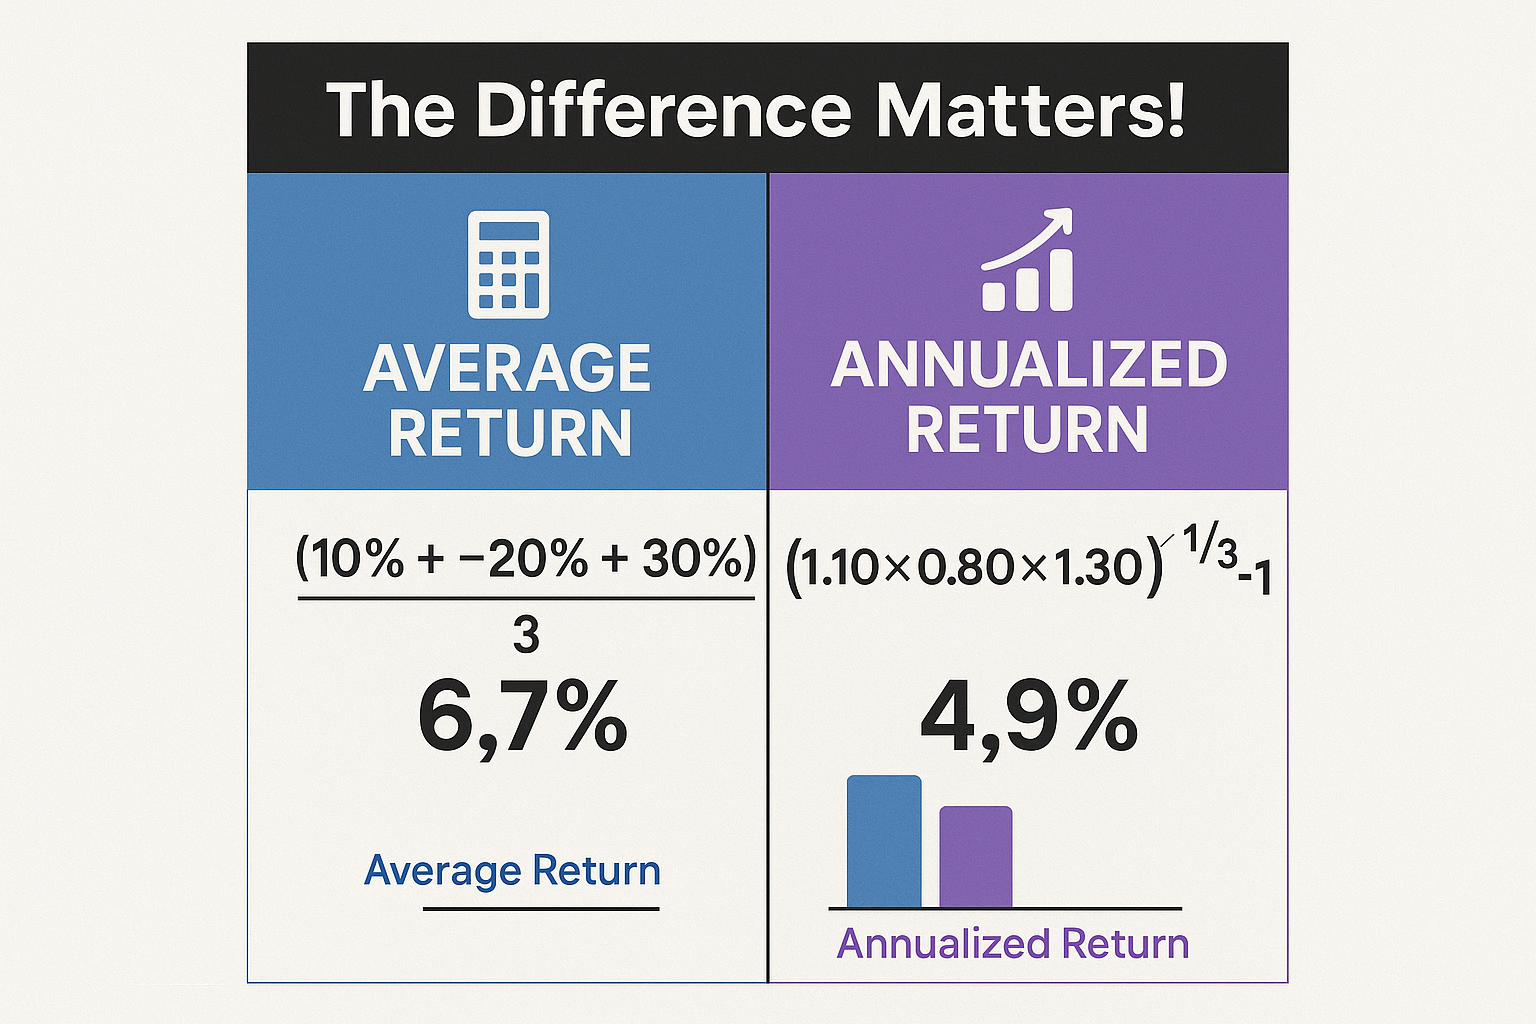
Annualization assumes that the investment's performance is "re-invested" or compounded. This is a critical distinction from a simple arithmetic average. In an arithmetic average, you simply add up the yearly returns and divide by the number of years. This method is often misleading because it ignores the reality of how money grows. If a portfolio drops by 50% in year one and grows by 50% in year two, the arithmetic average is 0%, but the investor has actually lost 25% of their initial capital. The annualized return correctly reflects this loss by using geometric mean calculation.
In 2026, financial regulators and institutions place a high premium on the use of annualized returns to prevent misleading marketing. For example, the Securities and Exchange Commission (SEC) requires mutual funds to report standardized performance over one-, five-, and ten-year periods using formulas that reflect annualization. This ensures that investors are not lured by "cherry-picked" short-term windows of high performance that are not sustainable or comparable to long-term benchmarks.
How to Calculate Annualized Return
Calculating the annualized return requires three primary pieces of data: the beginning value of the investment, the ending value (including dividends or interest), and the total duration of the investment held. The complexity of the math depends on whether the period is longer or shorter than one year.
The Mathematical Formula
The standard formula for calculating the annualized return is:
Annualized Return = [(Ending Value / Beginning Value)^(1/n)] - 1
In this equation, "n" represents the number of years the investment was held. If you held an investment for six months, "n" would be 0.5. If you held it for five years, "n" would be 5. To express the result as a percentage, you multiply the final decimal by 100.
Step-by-Step Calculation Example
Suppose you invested $10,000 in a diversified ETF on January 1, 2021. By January 1, 2026, the value of that investment grew to $16,500.
- Identify the variables: Beginning Value = $10,000; Ending Value = $16,500; n = 5 years.
- Divide the ending value by the beginning value: $16,500 / $10,000 = 1.65. This is your total cumulative return factor.
- Apply the exponent: Raise 1.65 to the power of (1/5), which is 0.2. Using a financial calculator, 1.65^0.2 = 1.1053.
- Subtract 1: 1.1053 - 1 = 0.1053.
- Convert to percentage: 0.1053 * 100 = 10.53%.
The annualized return for this five-year period is 10.53%. This means that, on average, the investment grew by 10.53% every year, with the gains of each year compounding upon the previous ones.
Annualized Return vs. Average Return
The distinction between "annualized" and "average" (specifically arithmetic average) is one of the most common points of confusion in retail investing. The arithmetic average return is calculated by summing the returns of each sub-period and dividing by the number of periods. While this is useful for understanding volatility, it is practically useless for understanding the actual growth of wealth.
The phenomenon known as "volatility drag" is the reason why these two numbers diverge. High volatility lowers the geometric return relative to the arithmetic return. If an asset has a return of +20% in year one and -20% in year two, the arithmetic average is 0%. However, the actual value of the investment has decreased. $100 becomes $120 after year one, and then $120 loses 20% ($24), leaving the investor with $96. The annualized return would be -2.02%, reflecting the reality that the investor is poorer than when they started.
For this reason, professional money managers and the CFA Institute emphasize time-weighted annualized returns. This method strips away the impact of cash inflows and outflows (investor behavior) to focus purely on the performance of the underlying assets. When you see a "10-year return" on a fund factsheet in 2026, it is almost certainly an annualized geometric return, as this is the only metric that accurately describes the historical rate of wealth accumulation.
The Risks of Annualizing Short-Term Data
While annualizing is essential for comparison, it carries a significant risk when applied to short timeframes. This is known as "extrapolation bias." Annualizing a daily or weekly return assumes that the specific conditions of that short window will persist for an entire 365-day cycle—a scenario that is rarely realistic in volatile markets.
For example, if a cryptocurrency gains 5% in a single day, a simple annualization calculation would suggest an annual return of over 54,000,000% (using compounding). Even if using a non-compounding "simple annualization" (5% * 365), the result is 1,825%. Neither number provides useful information because the probability of an asset maintaining a 5% daily gain for a year is virtually zero.
Generally, financial experts advise against annualizing any period shorter than one year unless it is for the purpose of comparing fixed-income instruments like 90-day T-bills or Certificates of Deposit (CDs), where the rate of return is contractually guaranteed. For stocks, commodities, or currencies, annualizing a one-month "hot streak" is a common marketing tactic used to deceive inexperienced investors into believing a trend is more sustainable than it actually is.
Comparison of Return Metrics
To choose the right metric for your analysis, it is helpful to understand how annualized return compares to other common performance indicators used in 2026.
| Metric | Calculation Basis | Best Use Case | Accounts for Compounding? |
|---|---|---|---|
| Annualized Return (CAGR) | Geometric Mean | Comparing assets over different time horizons | Yes |
| Simple Total Return | (Ending - Beginning) / Beginning | Measuring total profit over a specific, static period | No |
| Arithmetic Average | Sum of yearly returns / Years | Assessing the typical "vibe" or volatility of returns | No |
| Yield (Current) | Annual Income / Price | Income-focused investments (Bonds, Dividends) | No |
| Real Annualized Return | Annualized Return - Inflation | Measuring actual purchasing power growth | Yes |
| Internal Rate of Return (IRR) | Discount rate where NPV = 0 | Projects with multiple cash inflows/outflows | Yes |
Advanced Considerations: Inflation and Taxes
A "nominal" annualized return tells you how many more dollars you have, but it does not tell you what those dollars can buy. In 2026, as global economies navigate various inflationary pressures, calculating the "Real Annualized Return" is vital. To find the real return, you must subtract the annual inflation rate from your nominal annualized return (or use the more precise Fisher Equation: (1+Nominal)/(1+Inflation) - 1).
If your portfolio earns an annualized return of 8% over three years, but inflation averages 3% during that same period, your real annualized return is approximately 5%. This 5% represents your actual increase in purchasing power. Ignoring inflation can lead to a "money illusion," where an investor feels wealthy because their balance is growing, even though the cost of living is rising just as fast.
Taxation is another layer that complicates the practical application of annualized returns. Since taxes are typically paid annually (or at the time of sale), they act as a "leakage" that reduces the amount of capital available for compounding. An investment with a 10% annualized return in a tax-advantaged account like a 401(k) or IRA will significantly outperform the same 10% return in a taxable brokerage account, because the latter loses a portion of its gains to the government every time a position is rebalanced or a dividend is paid.
Operational Limitations and Best Practices
When using annualized returns to build a portfolio in 2026, keep the following operational constraints in mind:
- Survivorship Bias: When looking at the annualized returns of a specific sector, remember that the data often only includes companies that survived the entire period. Failed companies that went bankrupt are removed from the index, which can artificially inflate the "average" annualized return of the sector.
- The "End-Date" Sensitivity: Annualized returns are highly sensitive to the start and end dates chosen. A 10-year annualized return calculated at the peak of a bull market will look much better than the same calculation performed after a 20% market correction. Always look at "rolling" annualized returns to see how the metric changes over different market cycles.
- Inconsistency of Cash Flows: The standard annualized return formula assumes a single lump-sum investment. If you are adding $500 to your account every month (Dollar Cost Averaging), the standard formula will not be accurate. In this case, you must use the Money-Weighted Return or IRR (Internal Rate of Return) functions found in software like Excel or Google Sheets.
Frequently Asked Questions
Can an annualized return be negative?
Yes. A negative annualized return indicates that the investment has lost value over the specified period. For example, if you invested $1,000 and five years later you have $800, your annualized return would be approximately -4.36%. This means you lost an average of 4.36% of your remaining capital each year through the duration of the investment.
Is CAGR the same as annualized return?
For most practical purposes, yes. Compound Annual Growth Rate (CAGR) is the specific mathematical term for the geometric mean return of an investment over time. While "annualized return" is a broader descriptive term that can sometimes refer to simple annualization of short-term rates, in the context of portfolio reporting, the two terms are used interchangeably.
Why do mutual funds show 1, 3, and 5-year annualized returns?
Financial regulators, such as the Financial Industry Regulatory Authority (FINRA), require these intervals to provide a comprehensive view of performance across different market conditions. A 1-year return shows recent momentum, while 5- and 10-year returns provide insight into the fund manager’s ability to navigate various economic cycles and maintain consistency.
Does annualized return include dividends?
Yes, a true annualized return should be based on the "Total Return," which includes both price appreciation (capital gains) and any income generated (dividends or interest). If you ignore dividends, you are looking at the "Price Return," which significantly underestimates the performance of many asset classes, particularly value stocks and bonds.
How do I calculate annualized return in Excel?
You can calculate it manually using the formula =(Ending_Value/Beginning_Value)^(1/Years)-1. Alternatively, if you have a series of dates and cash flows, you can use the XIRR function, which is designed to handle irregular intervals and provide an accurate annualized internal rate of return.
Practical Recommendation
When evaluating any investment opportunity or reviewing your current portfolio performance in 2026, always prioritize the annualized return over the total return. The total return tells you where you arrived, but the annualized return tells you how fast you traveled to get there.
To make the most of this metric, always compare the annualized return of an asset against a relevant benchmark. For example, do not compare the annualized return of a high-yield bond fund to the S&P 500; instead, compare it to a high-yield bond index. Furthermore, always verify if the reported figures are "net of fees." High management expense ratios (MERs) can quietly erode a 10% gross annualized return into a 7% net return, drastically changing your long-term wealth trajectory. Before making any major financial decisions, consult with a qualified financial advisor to ensure these calculations align with your specific tax situation and risk tolerance.