In auto insurance, statistics are not "lost" in a physical sense but are the fundamental tools used to measure and predict loss ratios. A "loss" in this context refers to the financial payout for claims. Statistics are subject to variance, inaccuracy, and external shifts—such as economic inflation or technological changes—which can lead to a "loss of predictive power" if not managed correctly.
The relationship between statistics and loss is the cornerstone of the insurance industry. To understand if and how statistics are "subject to loss," one must distinguish between the statistical data itself (the historical record of accidents and claims) and the "loss" that the insurance company incurs when it pays out money. In 2026, as we integrate more real-time data and artificial intelligence into underwriting, the question becomes even more nuanced: how do we ensure that the statistics we rely on remain accurate representations of current risks?
The Actuarial Foundation: Statistics as the Measurement of Loss
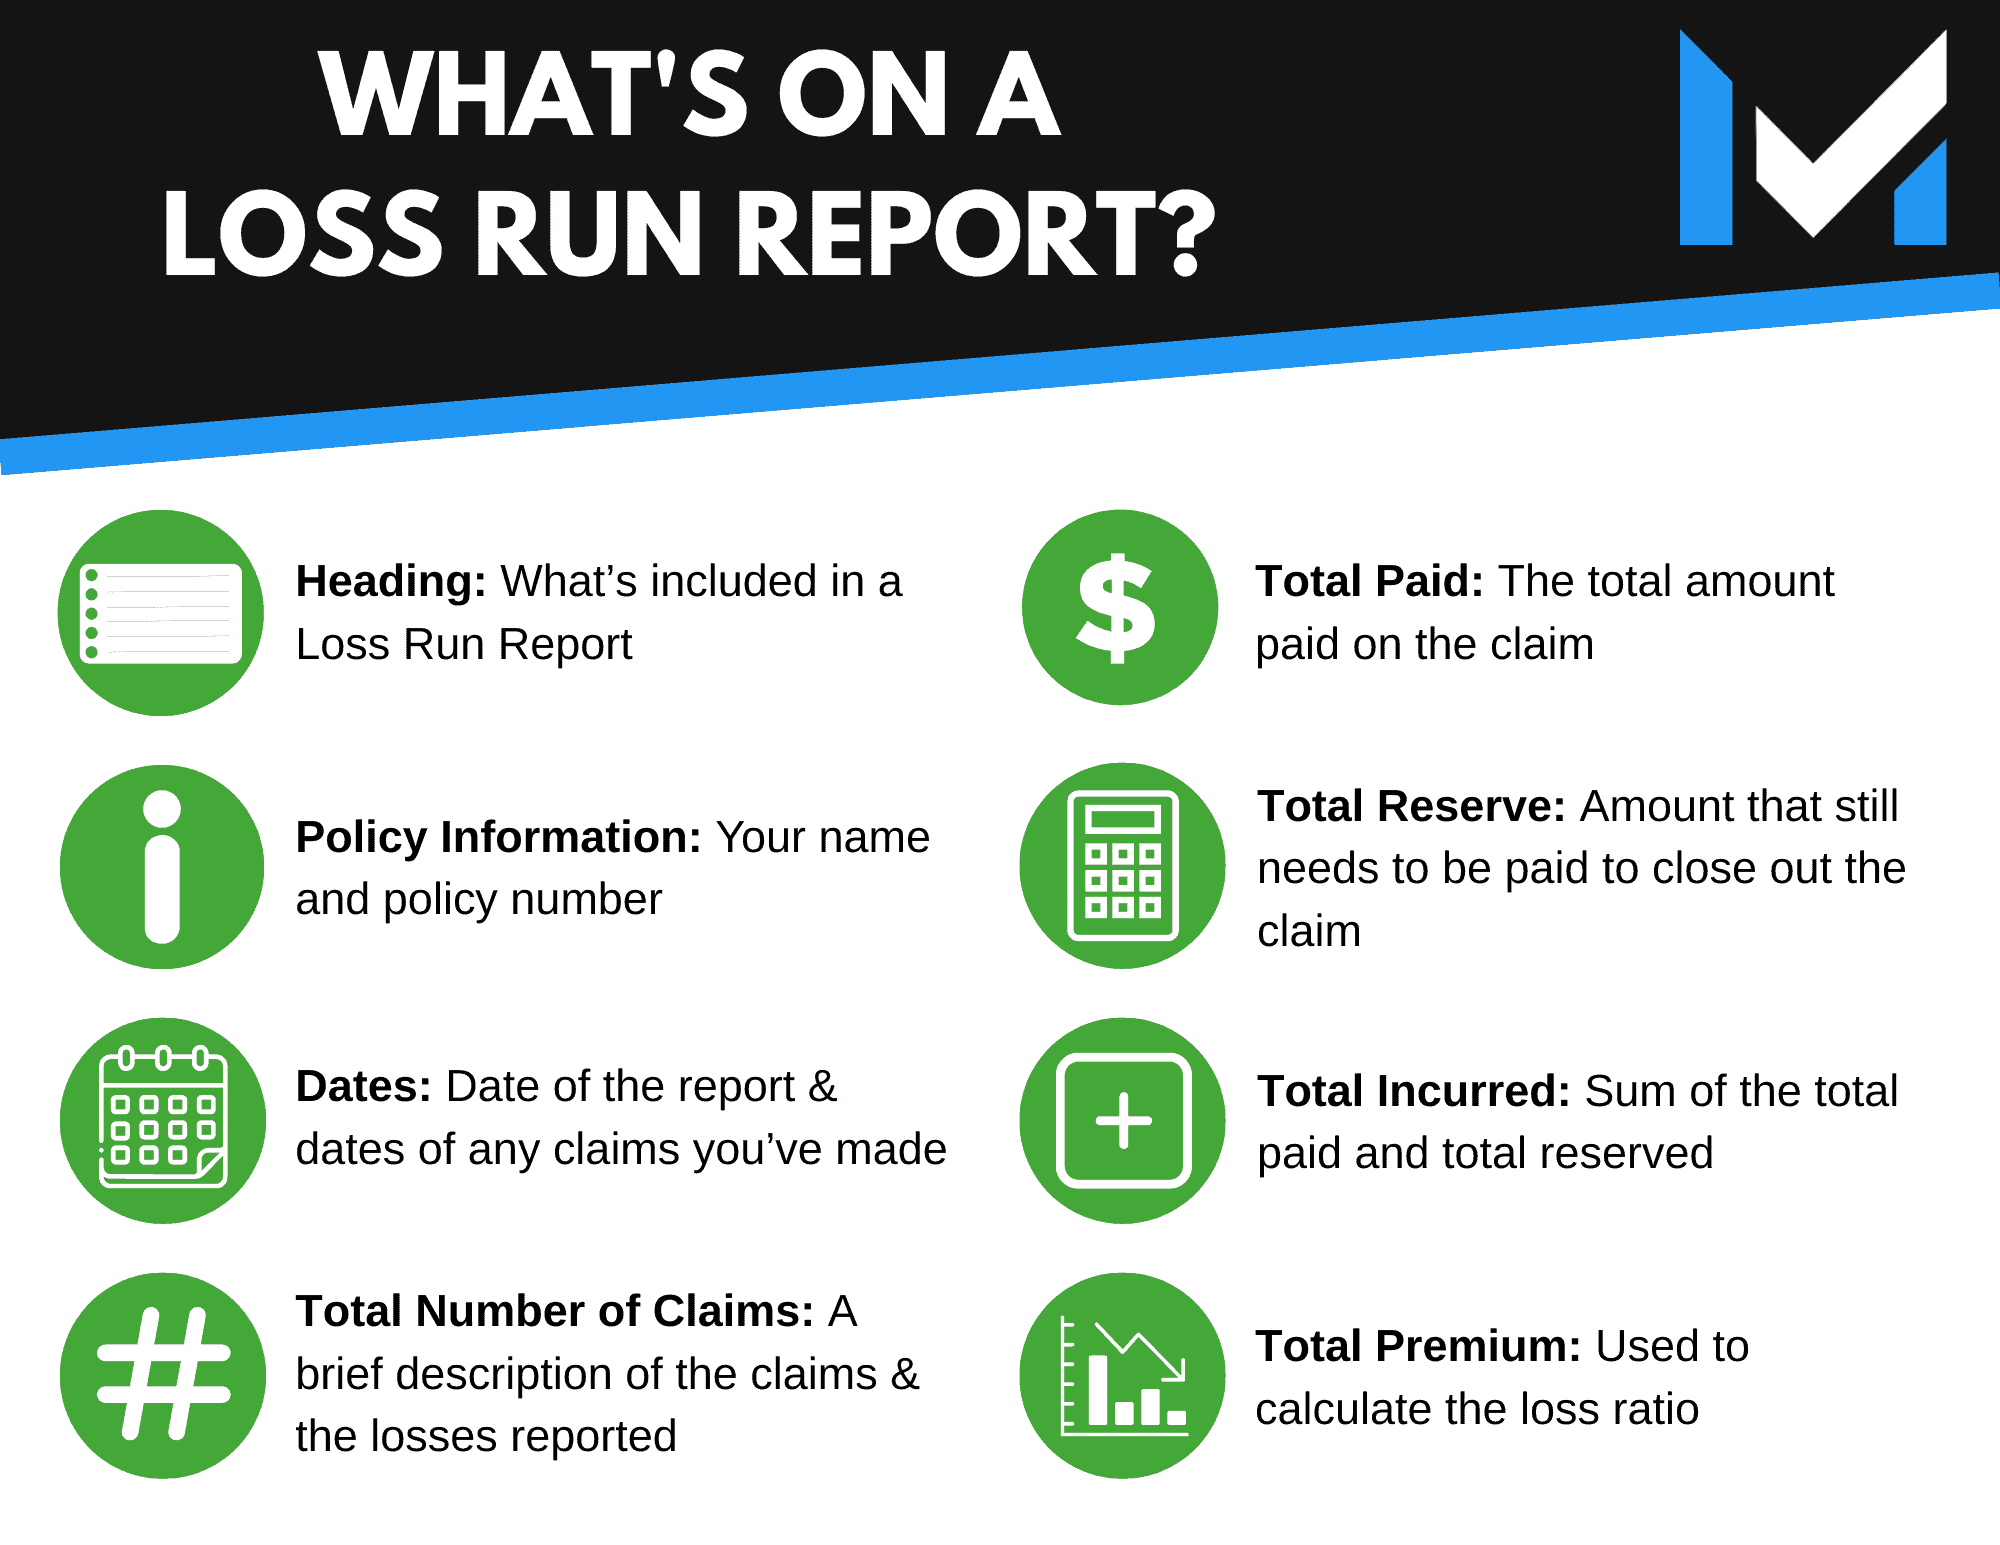
At its core, insurance is the business of pricing risk. To do this, companies employ actuaries who use vast datasets to determine the likelihood of a future event. In auto insurance, the primary statistic of concern is the loss ratio. This is a simple but powerful calculation: the total losses paid out in claims plus the costs of adjusting those claims, divided by the total premiums collected.
Defining the Loss Ratio and Its Statistical Weight
When an insurer evaluates its performance, the loss ratio is the ultimate "health check." If a company collects $100 million in premiums and pays out $70 million in claims, its loss ratio is 70%. The remaining 30% must cover administrative costs, marketing, and profit.
Statistics are used to keep this ratio stable. By looking at decades of data regarding driver age, location, vehicle type, and historical accident frequency, insurers can predict with high accuracy how much they will likely pay out in any given year. However, these statistics are subject to volatility. If a sudden spike in accidents occurs—perhaps due to a particularly harsh winter or a rise in distracted driving—the statistical model may "fail" to predict the actual loss, leading to a financial deficit.
The Law of Large Numbers
The reliability of statistics in insurance depends heavily on the Law of Large Numbers. This mathematical principle states that as the number of exposure units (insured drivers) increases, the actual loss experience will more closely develop toward the expected loss experience.
For an individual driver, the chance of an accident might feel like a random "flip of a coin." But for an insurer with five million policyholders, the "randomness" disappears into a predictable curve. Statistics are not "lost" here; rather, they are refined. The larger the dataset, the lower the risk that a statistical anomaly will cause a significant financial loss for the carrier.
Can Statistics Experience a "Loss" of Predictive Power?
The most critical way statistics are "subject to loss" is through the degradation of their predictive accuracy. In the insurance world, this is often referred to as model drift or statistical obsolescence. If the data used to build a model no longer reflects the current environment, the model loses its value.
The Impact of Economic and Social Inflation
As of 2026, one of the primary threats to statistical integrity in auto insurance is social inflation. This refers to the rising costs of insurance claims resulting from things like increased litigation, higher jury awards, and broader definitions of liability.
Historical statistics from 2015 or 2020 may suggest that a certain type of injury claim costs $50,000. However, if legal trends in 2026 have pushed that average to $100,000, the old statistics have suffered a "loss of relevance." If the insurer continues to price policies based on the old data, they will face significant under-pricing and financial loss.
Similarly, economic inflation affects the "loss" part of the equation. The cost of labor and parts for vehicle repairs has fluctuated wildly over the past few years. Statistics regarding the "average cost of repair" must be updated almost monthly to remain valid. When parts for electric vehicles (EVs) or Advanced Driver Assistance Systems (ADAS) become more expensive, the old statistical averages become a liability.
Technological Shifts and Data Obsolescence
The rapid advancement of vehicle technology in 2026 has rendered many traditional statistics obsolete. Consider the following:
- Sensor Calibration: In the past, a bumper replacement was a simple mechanical task. Today, it involves recalibrating expensive LIDAR and radar sensors.
- EV Battery Vulnerability: Even a minor collision can sometimes compromise an EV battery pack, leading to a "total loss" designation for a vehicle that looks otherwise functional.
- Autonomous Features: As more vehicles adopt Level 3 and Level 4 autonomy, the statistical "fault" shifts from the human driver to the software manufacturer.
If an insurance company relies on statistics from a decade ago, they are essentially using a map of a different city. The "loss" here is the inability of the data to capture the current risk landscape.
Data Integrity and the Risk of Physical Information Loss
While we have focused on the conceptual loss of statistical accuracy, there is also the literal risk of data loss. In the age of big data, insurance companies are massive targets for cyberattacks.
If an insurer loses access to its historical claims database due to ransomware or a catastrophic server failure, they lose their ability to price risk. This is a "loss of statistics" in its most literal and dangerous form. Without historical data, an insurer cannot perform the actuarial calculations necessary to remain solvent. This is why modern insurers invest heavily in redundant data storage, blockchain verification, and advanced cybersecurity protocols.
Regulatory Requirements for Data Retention
The National Association of Insurance Commissioners (NAIC) and various state regulators mandate strict data retention policies. Statistics must be preserved not just for pricing, but for market conduct examinations. If a regulator suspects an insurer is discriminating against certain demographics, the insurer must produce the statistical evidence used to justify their rates. Losing this data can result in massive fines and the loss of a license to operate.
How Insurers Mitigate Statistical Variance and Financial Loss
To prevent statistics from leading them astray, insurance companies use several layers of protection. These methods ensure that even if a statistical model is slightly off, the company remains stable.
- Credibility Factors: Actuaries assign a "credibility score" to datasets. If a data pool is small (e.g., a new type of sports car with few drivers), the actuary will give the statistics low credibility and supplement them with broader industry data.
- Trend Factors: Insurers apply "trend" multipliers to historical data to account for inflation and changing behaviors. This "future-proofs" the statistics.
- Reinsurance: When the actual losses exceed the statistically predicted losses by a large margin (such as during a massive hurricane or hailstorm), insurance companies turn to reinsurance. This is essentially insurance for insurance companies, protecting them from statistical "outliers."
- Telematics: By 2026, telematics (monitoring driving in real-time via smartphone apps or car sensors) has become the gold standard. This reduces the reliance on "static" historical statistics and replaces them with "dynamic" real-time statistics.
Comparison: Traditional Actuarial Methods vs. Modern Predictive Analytics (2026)
| Feature | Traditional Statistics | Modern Predictive Analytics (2026) |
|---|---|---|
| Data Source | Historical claims (3–5 years old) | Real-time telematics and IoT data |
| Update Frequency | Annually or Semi-annually | Monthly or instantaneous |
| Risk Assessment | Demographic-based (Age, Zip Code) | Behavior-based (Braking, Speed, Time of Day) |
| Primary "Loss" Risk | Lagging data/Inflation | Privacy regulations/AI "Black Box" errors |
| Accuracy | High for groups, low for individuals | High for both groups and individuals |
| Computational Method | Generalized Linear Models (GLM) | Machine Learning & Neural Networks |
Frequently Asked Questions
What does "total loss" mean in a statistical context?
In insurance terms, a total loss occurs when the cost to repair a vehicle exceeds a certain percentage of its actual cash value (usually 70% to 80%). Statistically, insurers track "Total Loss Frequency" to understand how vehicle age and technology affect the likelihood of a car being scrapped rather than repaired. This helps them set premiums for newer, more expensive vehicles.
Can my personal statistics cause a loss for the insurance company?
Yes. If you are categorized as a "preferred" (low-risk) driver but then cause a multi-million dollar accident, you represent a statistical variance. The premium you paid did not cover the loss you generated. However, the insurer expects this to happen occasionally; they balance your loss against the thousands of other preferred drivers who had no accidents.
How do statistics account for "uninsured motorists"?
Insurers use "uninsured motorist statistics" to determine the likelihood that a policyholder will be hit by someone without insurance. These statistics are subject to economic shifts; for instance, when the economy dips, the number of uninsured motorists typically rises. Insurers must adjust their rates for Uninsured Motorist (UM) coverage based on these shifting statistical trends.
Why do insurance rates go up even if I haven't had an accident?
This is due to the aggregate loss statistics of your demographic or geographic area. If statistics show that accidents in your city have become 20% more expensive due to rising medical costs or increased litigation (social inflation), your rates will likely rise to ensure the insurer can cover those predicted future losses, regardless of your personal driving record.
How are statistics used in "usage-based insurance" (UBI)?
In 2026, UBI uses statistics to create a "personalized loss profile." Instead of comparing you to every other 35-year-old, the company compares your specific driving data (miles driven, hard braking incidents) against their database of millions of miles driven by others. This reduces the "loss" associated with guessing a driver's habits based on general demographics.
Practical Recommendation: Navigating the Statistical Landscape
For the consumer and the insurance professional alike, the lesson is clear: statistics are only as good as the data feeding them.
If you are a policyholder, understand that your "statistical identity" is shifting. In 2026, you have more power than ever to influence the statistics used to price your policy. Opting into telematics programs allows you to provide "hard data" that can override the "lagging statistics" of your demographic group. This is often the most effective way to lower your premiums in a high-inflation environment.
For those in the industry, the focus must remain on data hygiene and model validation. To prevent a "loss of predictive power," models must be stress-tested against "black swan" events and adjusted for the rapid technological evolution of the automotive fleet. Statistics are not static; they are a living record of risk that requires constant maintenance to remain a reliable shield against financial loss.