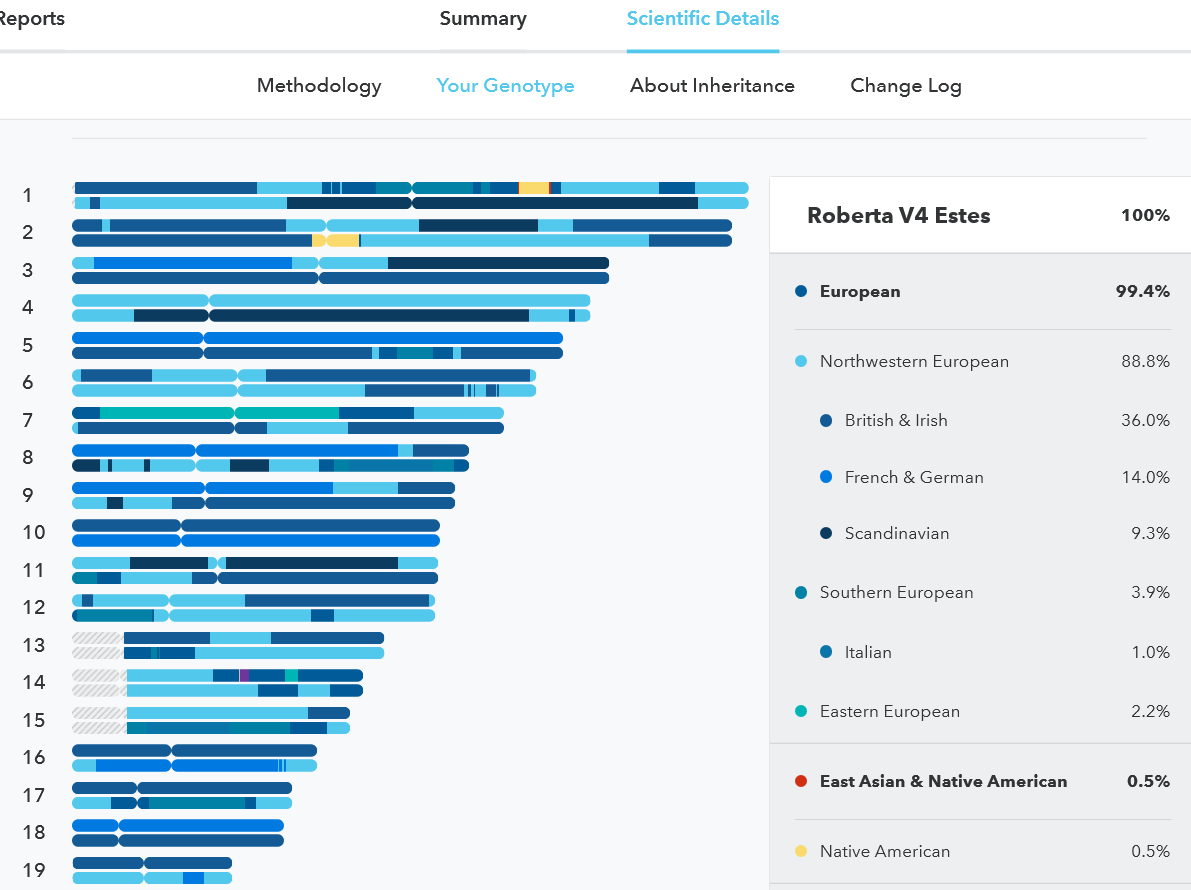
An AncestryDNA report converts autosomal genetic data into three primary sections: your Ethnicity Estimate, DNA Matches, and Ancestry Traits. By analyzing single nucleotide polymorphisms (SNPs) across your genome and comparing them against reference populations and other users, the report outlines your geographic origins, identifies biological relatives through shared centimorgans, and highlights polygenic personal traits.
How the AncestryDNA Test Works: From Saliva to Genetic Data
To understand your AncestryDNA report, it helps to understand how the test processes your biological sample. When you send your saliva sample to the testing laboratory, technicians extract deoxyribonucleic acid (DNA) from the cheek cells contained within the fluid. The lab uses a custom single nucleotide polymorphism (SNP) microarray chip to read hundreds of thousands of specific positions across your autosomal genome.
Autosomal DNA consists of the 22 pairs of non-sex chromosomes inherited from both biological parents. Because autosomal DNA undergoes genetic recombination during reproduction—where genetic material from maternal and paternal lines randomly shuffles—you inherit exactly 50% of your autosomal DNA from your mother and 50% from your father. However, the exact combination of DNA passed down from earlier generations (such as grandparents and great-grandparents) varies randomly.
Once the microarray chip scans your sample, it generates a text file containing your raw DNA data. This raw data lists your genotype at specific genomic addresses (rsIDs). Ancestry's proprietary algorithms process these data points through two primary analytic pipelines: population genetic algorithms that generate your Ethnicity Estimate and relational matching algorithms that construct your DNA Matches list.
Breaking Down Your Ethnicity Estimate
Your Ethnicity Estimate is often the first page you see when opening your AncestryDNA results. This section provides an interactive map and a breakdown of percentages representing geographic regions where your ancestors likely lived within the past 300 to 1,000 years.
- YOUR ETHNICITY ESTIMATE
- ETHNICITY REGIONS
- Broader historical areas
- Calculated via reference panels
- Expressed in ranges
- GENETIC COMMUNITIES
- Recent ancestry (100–300 years)
- Network of shared DNA matches
- ETHNICITY REGIONS
Reference Panels and Regional Percentages
Ancestry calculates your regional percentages by comparing your DNA against a reference panel composed of thousands of individuals with deep, documented roots in specific global locations. If a specific sequence of your DNA matches markers predominantly found in the reference group for Scotland, that segment is assigned to the Scottish region.
It is crucial to recognize that an ethnicity percentage is an estimate, not an absolute mathematical certainty. Ancestry calculates these numbers by running your data through algorithmic iterations to determine the most likely breakdown, while also generating a range for each region.
For example, your report might display "35% England & Northwestern Europe." However, clicking on that estimate reveals a confidence range—such as 28% to 42%. This range reflects statistical variation in the algorithm. In regions where genetic markers overlap significantly between neighboring populations (such as France, Germany, and England), these ranges help account for historical human migration and gene flow.
Ethnicity Regions vs. Genetic Communities
Ancestry distinguishes between broad Ethnicity Regions and highly localized Genetic Communities:
- Ethnicity Regions reflect deep historical origins, often dating back 500 to 1,000 years or more. These categories describe large geographic areas like "Eastern Europe & Russia" or "Indigenous Americas—Mexico."
- Genetic Communities focus on recent historical movements, typically covering the last 100 to 300 years. Instead of relying solely on reference panels, communities are identified using network analysis of DNA matches who share common family trees and recent geographic histories.
If your report identifies a Genetic Community—such as "Early Alabama, Mississippi & Louisiana Settlers"—it indicates that you share close genetic networks with a specific cluster of people who migrated to that precise area during a defined historical window. Communities are frequently more reliable and actionable for genealogical research than broad regional percentages because they correspond directly to documented historical migration patterns.
Why Ethnicity Estimates Update Over Time
Users frequently notice that their ethnicity percentages change every year or two. These changes occur because consumer genomics companies continually refine their methodologies. As reference panels expand to include more populations worldwide, and as computer vision and machine learning algorithms improve at distinguishing subtle genetic differences between adjacent countries, Ancestry recalculates user reports. An update does not mean your underlying DNA changed; rather, it reflects a clearer scientific interpretation of your existing data.
Interpreting Your DNA Matches
The DNA Matches section is the most practical tool within your report for family history research. This feature automatically compares your autosomal DNA against every other user in Ancestry's database to identify biological relatives.
Centimorgans (cM) and Shared Segments Explained
To interpret your match list, you must understand the primary unit of genetic measurement: the centimorgan (cM). A centimorgan is a unit of measure for genetic linkage, representing the probability that a specific segment of DNA will recombine across a single generation.
Rather than counting individual DNA letters, geneticists measure the total length of shared DNA blocks in centimorgans. The human genome contains approximately 6,800 cM across all autosomal chromosomes combined. The higher the total amount of shared cM between you and another person, the closer your biological relationship.
Along with total cM, Ancestry reports the number of shared DNA segments. A segment is an unbroken string of DNA passed down from a common ancestor. Over generations, biological recombination breaks these continuous segments into smaller fragments. Therefore:
- Large, continuous segments indicate a recent common ancestor (e.g., a parent or grandparent).
- Numerous small, scattered segments suggest a distant common ancestor (e.g., a 4th or 5th cousin).
Relationship Categories and Shared cM Ranges
Ancestry groups your matches into estimated relationship categories based on total shared cM. However, because genetic recombination is random, shared cM values fall within statistical ranges rather than fixed numbers.
| Predicted Relationship | Average Shared DNA (%) | Typical Shared cM Range | Common Ancestor Distance |
|---|---|---|---|
| Parent / Child | 50% | 3,300 – 3,700 cM | 1 generation (Parent) |
| Full Sibling | ~50% (37%–53%) | 2,200 – 3,300 cM | 1 generation (Parents) |
| Grandparent / Half Sibling / Aunt or Uncle | ~25% | 1,300 – 2,300 cM | 2 generations (Grandparents) |
| 1st Cousin | ~12.5% | 575 – 1,300 cM | 2 generations (Great-Grandparents) |
| 2nd Cousin | ~3.125% | 75 – 360 cM | 3 generations (Great-Great-Grandparents) |
| 3rd Cousin | ~0.78% | 90 – 180 cM | 4 generations (3rd Great-Grandparents) |
| 4th Cousin to Distant | < 0.39% | 6 – 90 cM | 5+ generations |
(Note: Data derived from statistical analyses by the International Society of Genetic Genealogy and empirical research from the Shared cM Project.)
Because ranges overlap—for example, a half-aunt and a first cousin can share similar amounts of cM—you must evaluate both the total cM value and traditional genealogical records to confirm an exact relationship.
Leveraging ThruLines and Family Trees
Ancestry's ThruLines feature integrates genetic data with member-created family trees. When you link a public or searchable private family tree to your DNA test, ThruLines compares your tree data with the trees attached to your DNA matches.
If the system detects matching ancestors across multiple trees, it generates a diagram illustrating how you and a specific DNA match might be related.
- COMMON ANCESTOR NODE (e.g., Great-Grandparent)
- YOUR ANCESTRY
- Grandparent
- Parent
- YOU
- MATCH ANCESTRY
- Grandparent Branch
- Parent Branch
- DNA MATCH
- YOUR ANCESTRY
Important Caution: ThruLines relies on user-submitted trees, which may contain biographical errors or incorrect family connections. Always treat ThruLines as a research hypothesis that requires independent verification using primary records, such as census data, birth certificates, and land deeds.
Exploring Ancestry Traits
Depending on your subscription level or test package, your AncestryDNA report may include an Ancestry Traits module. This section examines genetic variants associated with physical characteristics, sensory responses, and wellness attributes.
Unlike simple genetic traits controlled by a single gene (like blood type), most consumer traits are polygenic, meaning they are influenced by dozens or hundreds of different genetic variants working together, alongside environmental factors.
Examples of analyzed traits include:
- Physical Traits: Hair structure (curly vs. straight), eye color, skin pigmentation, attached vs. unattached earlobes, and peak athletic performance indicators.
- Sensory Traits: Sensitivity to bitter tastes (such as phenylthiocarbamide/PTC), cilantro taste preference (whether it tastes soapy), and sweet craving tendencies.
- Nutrient & Fitness Traits: Beta-carotene uptake efficiency, caffeine consumption patterns, and muscle fiber composition potential.
Your report assigns a prediction based on your genotype at known marker locations. For instance, if you carry multiple variants associated with blue eyes, the report states that you are "more likely to have light eyes." However, because traits account for genetic probabilities rather than absolute deterministic rules, it is normal for your actual physical appearance to differ from a specific trait prediction.
Common Misconceptions and Troubleshooting
Reading a genetic report can occasionally lead to unexpected or confusing conclusions. Addressing these common edge cases helps clarify your results.
Misconception 1: Full Siblings Should Have Identical Ethnicity Estimates
Full biological siblings share approximately 50% of their total DNA, but they do not inherit the exact same 50% from each parent (except for identical twins). During meiosis, sperm and egg cells receive a randomized combination of autosomal segments.
As a result, one sibling might inherit a 12% segment of Scandinavian DNA from a grandfather, while another sibling inherits only 4% of that same segment. Both siblings share the same parental lines, but their differing genetic combinations lead to slight variations in their respective Ethnicity Estimates.
Misconception 2: Missing Known Ancestors in Your Ethnicity Breakdown
If your documented paper trail shows a great-great-grandmother who emigrated from Ireland, but your report displays 0% Irish ethnicity, there are three primary explanations:
- Genetic Dilution: On average, you inherit roughly 6.25% of your DNA from a great-great-grandparent. However, due to random recombination, that percentage can range from 0% to roughly 11%. It is entirely possible to inherit zero measurable DNA from a specific 4th-great-grandparent.
- Overlapping Regional Markers: The algorithm may have categorized those specific genetic markers under a neighboring, genetically similar region, such as "Scotland" or "Wales & England."
- Paper Trail Discrepancies: Non-paternity events (NPEs), adoption, or unrecorded legal parentage can mean that a legal or social ancestor is not a biological relative.
Misconception 3: Distantly Related DNA Matches That Do Not Share Ancestors
If you share a low amount of DNA with a match (e.g., 6 to 10 cM), the match might represent identical by state (IBS) DNA rather than identical by descent (IBD) DNA.
- Identical by Descent (IBD): The shared segment was passed down directly from a shared recent ancestor.
- Identical by State (IBS): The shared segment is a coincidence or a very ancient survival marker common across an entire historic population, rather than evidence of a traceable genealogical relationship.
Step-by-Step Actions: How to Use Your Results
Once you understand how to read your AncestryDNA report, take these steps to organize and maximize your findings:
RECOMMENDED WORKFLOW FOR DNA RESULTS:
- SECURE ACCOUNT: Enable Two-Factor Authentication (2FA)
- LINK FAMILY TREE: Connect public/searchable tree to test
- ORGANIZE MATCHES: Use Leeds Method to cluster color tags
- EXAMINE CHR. SEGMENTS: Review shared cM using Shared cM tools
- DOWNLOAD RAW DATA: Save secure local zip file backup
Step 1: Secure Your Account and Review Privacy Settings
Go to your Account Settings and enable two-factor authentication (2FA). Review your DNA privacy choices:
- Decide whether your profile name is visible to matches.
- Choose whether to display your full Ethnicity Estimate and family tree to matches.
- Opt in or out of scientific research projects.
Step 2: Link a Searchable Family Tree
Connect a public or searchable private family tree to your DNA profile. A linked tree enables automated tools like ThruLines and highlights common surnames directly in your match list.
Step 3: Organize Your DNA Matches (The Leeds Method)
Use Ancestry's color-coded tagging system to group your matches into distinct family clusters:
- Filter your match list to show matches between 90 cM and 400 cM.
- Assign a specific color tag to a match based on a known relative or shared ancestral line.
- Use the "Shared Matches" tab to identify every other individual who shares that same segment cluster.
- Repeat this process to group matches into four distinct clusters representing your four grandparent lines.
Step 4: Backup Your Raw DNA File
Download a local copy of your raw DNA data file (.txt or .zip format) directly from your Ancestry settings page. Keep this file in a secure, encrypted storage location. Having your raw data allows you to upload it to third-party academic and genealogical platforms—such as GEDmatch or MyHeritage—if you choose to expand your search across additional databases.
Frequently Asked Questions
What is the difference between autosomal DNA tests and Y-DNA or mtDNA tests?
An autosomal DNA test (like AncestryDNA) examines chromosomes 1–22, providing information about all ancestral lines within recent generations (5–10 generations). A Y-DNA test traces only the direct paternal line (father to father) and is available only to biological males. An mtDNA test traces the direct maternal line (mother to mother) using mitochondrial DNA.
How accurate is AncestryDNA?
AncestryDNA is highly accurate for identifying biological relatives (DNA Matches down to approximately 2nd cousins) and for broad geographic regional analysis. However, regional percentage breakdowns are statistical estimates that refine over time as reference panels improve.
Can an AncestryDNA report reveal medical conditions?
The core AncestryDNA report focuses on ethnicity, genealogy, and non-medical physical traits. It does not provide clinical diagnostic reports for medical conditions. For clinical genetic screening, consult a certified genetic counselor or a primary medical provider.
Why do my matches show shared cM instead of percentages?
Centimorgans (cM) provide a more precise scientific measurement than broad percentages, especially for distant relationships. While 1% of shared DNA can represent a range of different relationship types, the exact cM count (e.g., 215 cM) allows genetic genealogists to calculate exact probability distributions for specific familial relationships.
What should I do if I discover an unexpected relationship?
Unexpected genetic findings—such as non-paternity events, undisclosed adoptions, or previously unknown half-siblings—are relatively common in consumer genomics. Take time to document match information, download shared match details, and consider consulting a genetic genealogy professional or counselor before initiating contact.
Practical Summary and Next Steps
Your AncestryDNA report serves as a roadmap connecting biological data to historical records. To get the most value from your test:
- Treat Ethnicity Estimates as broad contexts, focusing primarily on Genetic Communities for historical migration research.
- Focus on DNA Matches with higher shared centimorgans (cM) to systematically trace biological lineages.
- Group matches using shared match tools to map out specific ancestral branches before reaching out to distant relatives.
By combining your genetic data with thorough documentary record research, you can systematically confirm family lineages, break through genealogical obstacles, and gain a clearer understanding of your family history.