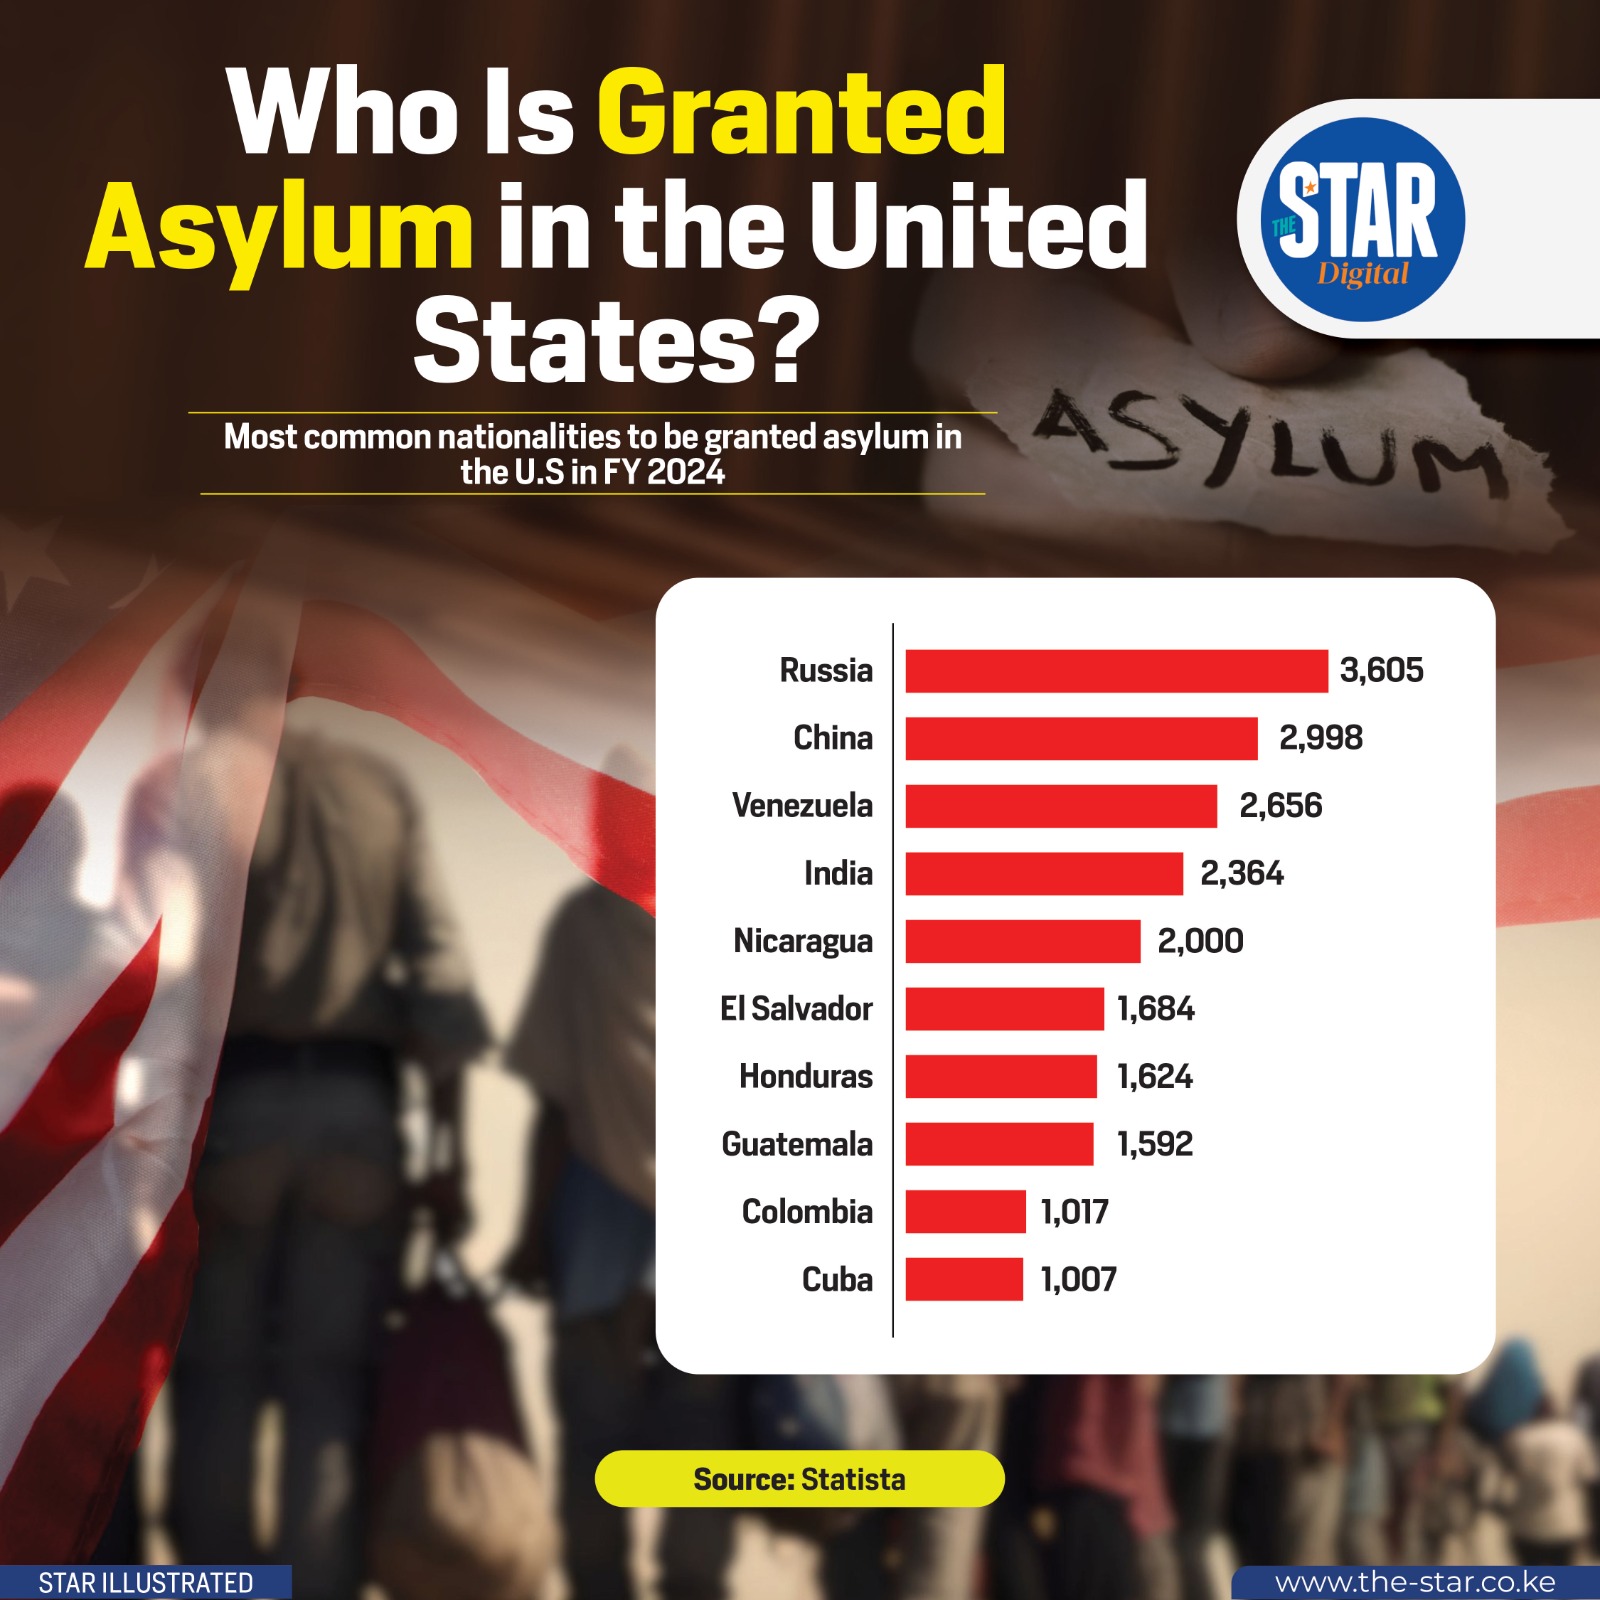
Asylum statistics in the United States represent the intersection of humanitarian obligation, national security, and administrative capacity. As of 2026, the data shows a system managing a record-breaking backlog exceeding 3.5 million pending cases across affirmative and defensive pathways. While grant rates vary significantly by nationality and legal representation, the overall volume of applications continues to outpace the adjudication capacity of federal agencies.
Understanding the Two Pathways: Affirmative vs. Defensive Asylum
To interpret United States asylum statistics accurately, one must first distinguish between the two primary legal tracks: the affirmative process and the defensive process. These tracks are managed by different federal agencies and involve distinct procedural steps, which are reflected separately in annual statistical reports.
The Affirmative Asylum Process
The affirmative process applies to individuals who are already physically present in the United States, regardless of how they arrived, and who are not currently in removal proceedings. These applications are handled by U.S. Citizenship and Immigration Services (USCIS), a component of the Department of Homeland Security (DHS).
Statistically, affirmative asylum seekers represent a diverse demographic, including those who entered on valid visas (such as student or tourist visas) and subsequently found they could not safely return home. In 2026, USCIS data indicates that the "Last In, First Out" (LIFO) scheduling priority remains in effect to deter individuals from using the backlog solely as a means to obtain work authorization. Despite this, the volume of new affirmative receipts has remained high, driven by geopolitical instability in regions like Eastern Europe and South America.
The Defensive Asylum Process
Defensive asylum occurs when an individual requests asylum as a defense against removal from the United States. This typically applies to people apprehended at the border or those who were referred to immigration court by USCIS after an unsuccessful affirmative application. These cases are adjudicated by the Executive Office for Immigration Review (EOIR), which falls under the Department of Justice (DOJ).
Defensive statistics are often much larger in volume than affirmative ones because they include the vast majority of individuals processed at the U.S. southern border. According to the Executive Office for Immigration Review, the number of defensive asylum grants is a critical metric for measuring the efficiency of the immigration court system.
Current Volume and Backlog Trends in 2026
The defining characteristic of asylum statistics in 2026 is the staggering scale of the pending caseload. This backlog is the result of a decade-long trend where the number of individuals seeking protection has consistently exceeded the number of asylum officers and immigration judges available to hear their cases.
The Growth of the Pending Caseload
As of early 2026, the combined backlog between USCIS and EOIR has reached unprecedented levels. The EOIR backlog alone has surpassed 3 million cases, a significant portion of which are asylum-related. This massive accumulation means that a person filing for asylum today may wait several years before receiving a final merits hearing.
Several factors contribute to this growth:
- Increased Border Encounters: Persistent migration flows from the "Northern Triangle" (Guatemala, Honduras, and El Salvador) and newer surges from Venezuela, Cuba, and Nicaragua.
- Resource Constraints: While Congress has authorized additional immigration judges in recent years, the rate of new case filings continues to outstrip the rate of case completions.
- Procedural Complexity: Changes in asylum law, such as the "Circumvention of Lawful Pathways" rule, have added layers of administrative review, sometimes slowing down the initial screening process.
Processing Time Realities
For many applicants, the statistic that matters most is the "wait time." In 2026, the average processing time for an asylum case in high-volume jurisdictions like New York, Miami, or Los Angeles can range from 3 to 6 years. These delays have secondary statistical effects, such as an increase in the number of Employment Authorization Document (EAD) applications, as asylum seekers are eligible to work while their cases are pending.
Asylum Grant Rates by Nationality and Region
Grant rates—the percentage of cases that result in a favorable outcome for the applicant—are not uniform. They fluctuate based on the political conditions of the country of origin and the specific legal precedents applicable to those regions.
High-Approval Nationalities
Historically and continuing into 2026, applicants from certain countries see higher approval rates. For example, individuals from Eritrea, Ethiopia, and China often have grant rates exceeding 50% or 60%. In the case of Chinese applicants, many claims are based on religious persecution or political dissent, which have long-standing, well-documented legal foundations in U.S. immigration courts.
Lower-Approval Nationalities and "Particular Social Groups"
Conversely, applicants from Central American countries often face lower grant rates, sometimes dipping below 20% in certain jurisdictions. This is frequently because their claims are based on gang violence or domestic abuse. Under U.S. law, these must be tied to a "particular social group," a legal category that has been subject to shifting interpretations by successive administrations and federal courts.
The Impact of Geopolitical Shifts
In 2026, statistics show a notable increase in asylum grants for individuals from Ukraine and Venezuela, reflecting the U.S. government's recognition of the systemic collapse or ongoing conflict in those nations. However, many Venezuelans are also processed under Temporary Protected Status (TPS), which can sometimes reduce the total number of formal asylum applications as individuals opt for the more immediate stability of TPS.
The Role of Credible Fear Screenings at the Border
A significant portion of asylum statistics originates with the Credible Fear Screening process. This is the initial "gatekeeping" interview conducted by USCIS asylum officers for individuals who are subject to expedited removal but express a fear of return to their home country.
| Metric | 2024 (Actual) | 2025 (Estimated) | 2026 (Projected) |
|---|---|---|---|
| Total Credible Fear Referrals | 150,000+ | 175,000+ | 190,000+ |
| Positive Fear Findings (%) | ~65% | ~55% | ~50% |
| Cases Referred to Immigration Court | 95,000+ | 100,000+ | 110,000+ |
| Average Days to Initial Screening | 14-30 | 20-45 | 30-60 |
Data from the Department of Homeland Security suggests that the bar for passing a credible fear interview has become more rigorous. The "positive fear finding" rate has seen a downward trend in 2025 and 2026 due to stricter eligibility rules for those who transit through third countries without seeking protection there first.
Key Factors Influencing Asylum Outcomes
Statistics reveal that an asylum seeker’s chances of success are not solely dependent on the merits of their claim. Two external variables play a disproportionate role: legal representation and the specific judge assigned to the case.
The Power of Legal Representation
The disparity in outcomes between represented and unrepresented asylum seekers is one of the most consistent findings in immigration data. According to TRAC Immigration, applicants with an attorney are nearly three times more likely to win their cases than those representing themselves (pro se).
In 2026, the complexity of asylum law—including the need to gather evidence from abroad and navigate intricate filing deadlines—makes professional legal counsel almost essential. However, statistics show that a significant portion of the backlog involves individuals who cannot afford an attorney and do not have access to pro bono services.
Judicial Variation (The "Luck of the Draw")
Asylum statistics also highlight "judicial disparities." Within the same immigration court, one judge may grant 80% of asylum cases while another grants only 10%. This variation is often attributed to different interpretations of what constitutes a "well-founded fear of persecution." For practitioners and applicants, these statistics are a sobering reminder of the subjectivity inherent in the current system.
Historical Context and Recent Policy Shifts
To understand where we are in 2026, we must look at the policy evolution of the early 2020s. The expiration of Title 42 (a public health order used to expel migrants) in May 2023 marked a pivot point. It was replaced by the "Circumvention of Lawful Pathways" rule, which created a rebuttable presumption of asylum ineligibility for those who crossed the border illegally between ports of entry.
The Impact of "Parole" Programs
One reason asylum application numbers for certain nationalities (like Haitians and Cubans) shifted in 2024 and 2025 was the introduction of specialized parole programs. These programs allowed individuals to apply for entry from their home countries. Statistically, this moved some "asylum seeker" volume into "parolee" categories, though many of these individuals still eventually apply for asylum to secure permanent status.
The 2026 Landscape
By 2026, the use of the CBP One™ mobile app has become the primary statistical driver for asylum processing at the border. Individuals who schedule an appointment via the app are generally processed differently than those who cross without an appointment. This has created a bifurcated statistical set: "App-Scheduled" applicants vs. "Spontaneous" arrivals, with the former generally having higher rates of successful entry into the asylum pipeline.
Challenges in Data Collection and Reporting
While federal agencies provide a wealth of data, there are gaps in "real-time" asylum statistics.
- Data Lags: Official year-end reports often take several months to be finalized and published.
- Case Categorization: Sometimes, a case is closed not because asylum was granted, but because the individual adjusted status through a family member or won a different form of relief, such as "Withholding of Removal" or protection under the "Convention Against Torture" (CAT).
- Withdrawals: A notable percentage of the backlog is cleared through "administrative closure" or withdrawals, where the applicant decides to leave the U.S. or stops pursuing the claim.
For the most accurate and up-to-date figures, researchers rely on the USCIS Electronic Reading Room and the DOJ's quarterly statistical updates.
Frequently Asked Questions
What is the current asylum grant rate in the United States?
In 2026, the national average grant rate for asylum in immigration courts hovers around 45% to 50%. However, this number is a broad average; grant rates for specific nationalities can be as high as 80% or as low as 15%. Factors such as having a lawyer and the specific region where the court is located significantly influence these odds.
How long does the average asylum case take in 2026?
Due to the backlog of over 3 million cases, the average processing time is currently between 3 and 5 years. Affirmative cases (with USCIS) may move faster if the applicant is prioritized under the "Last In, First Out" policy, but defensive cases in the immigration court system are subject to long queues depending on the court's specific docket.
Can I work while my asylum application is pending?
Yes, under current regulations, asylum seekers can apply for an Employment Authorization Document (EAD) 150 days after filing a complete asylum application, provided no delays were caused by the applicant. The EAD cannot be issued until the application has been pending for at least 180 days. This "180-day clock" is a major statistical metric tracked by USCIS.
Which country has the most asylum seekers in the U.S.?
As of 2026, Venezuela, Cuba, and Nicaragua represent the largest groups of new asylum seekers, followed closely by traditional origin countries like Guatemala and Honduras. There has also been a significant statistical increase in applicants from China, India, and various African nations seeking protection at the southern border.
What is the difference between asylum and refugee status?
The primary difference is location. A refugee is someone who applies for protection while still outside the United States (usually through the UN Refugee Agency and the U.S. Refugee Admissions Program). An asylum seeker is someone who is already at a port of entry or inside the United States when they apply. Statistically, refugee admissions are capped annually by the President, while there is no statutory limit on the number of people who can be granted asylum.
Summary and Next Actions
The 2026 asylum statistics highlight a system under extreme pressure. For those navigating this process, the data suggests three critical takeaways:
- Legal representation is the single most important factor in achieving a positive outcome.
- Wait times are substantial, necessitating a plan for long-term residency and employment while a case is pending.
- Policy is dynamic; changes in border rules and judicial precedents can alter grant rates and eligibility almost overnight.
If you or someone you know is part of these statistics, the best next action is to consult with a qualified immigration attorney or a DOJ-accredited representative. They can help navigate the specific requirements of the USCIS or EOIR pipelines and ensure that all evidence is properly documented to maximize the chances of a successful claim.