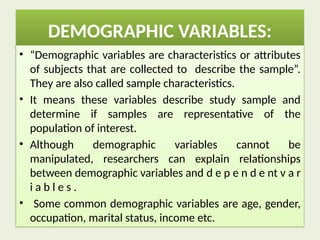
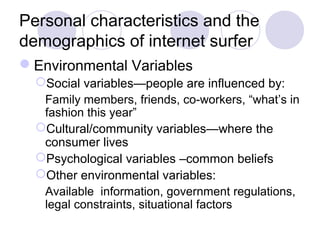
Demographic variables are the quantifiable characteristics of a given population used by researchers to segment markets and identify target audiences. In 2026, the five most common variables—age, gender, income, education level, and occupation—remain the foundational pillars for understanding consumer behavior, resource allocation, and personalized marketing strategy.
Market research serves as the bridge between a company’s offerings and the specific needs of its consumers. While psychographics and behavioral data provide depth, demographic variables offer the essential "who" behind the data. By categorizing a broad population into manageable segments based on these shared traits, organizations can tailor their messaging, product development, and pricing strategies to resonate with the people most likely to convert.
1. Age: The Lifecycle and Generational Anchor
Age is perhaps the most fundamental demographic variable because it dictates a consumer’s life stage, purchasing power, and cultural touchstones. In 2026, researchers categorize age not just by chronological years, but by generational cohorts and life-stage milestones.
Generational Cohorts in 2026
Researchers often group individuals into cohorts such as Generation Alpha (now entering their teens), Generation Z (the core young professional workforce), Millennials (now in peak earning years), and Baby Boomers (active retirees). Each group possesses distinct technological fluencies and value systems. For instance, Gen Alpha’s consumption habits are heavily influenced by immersive digital environments, whereas older Millennials may prioritize family-oriented utility and sustainable practices.
Life-Stage Analysis
Beyond birth year, age indicates specific life transitions. A 25-year-old might be navigating their first major career move, while a 65-year-old might be transitioning into a "second act" career or full retirement. Researching age variables allows brands to predict when a consumer will need specific services—such as life insurance, tuition financing, or healthcare—based on these predictable biological and social cycles.
Technical Application
When collecting age data, researchers must choose between open-ended questions (numerical age) or categorical brackets (e.g., 18–24, 25–34). Categorical brackets are generally preferred in 2026 to protect privacy and reduce survey fatigue, though they require careful calibration to ensure the ranges are statistically significant for the specific industry being studied.
2. Gender: Moving Toward Inclusive Segmentation
Gender has historically been a primary variable for industries like fashion, personal care, and automotive. However, in the current 2026 landscape, the application of gender as a demographic variable has evolved from a simple binary classification to a more nuanced understanding of identity and consumer preference.
Evolving Definitions and Accuracy
Modern market research recognizes that traditional binary segments (Male/Female) may not capture the full reality of the modern consumer base. Many firms now include "Non-binary," "Prefer not to say," or "Self-describe" options. This inclusivity is not merely a social gesture; it is a data-integrity requirement. Forcing respondents into inaccurate categories leads to "dirty data," which can skew market insights and result in alienated customer segments.
Gender-Neutral and Targeted Marketing
While some products remain gender-specific due to physiological needs, 2026 sees a massive surge in gender-neutral marketing. By analyzing gender variables, researchers can determine if a product’s appeal is truly lopsided or if there is an untapped opportunity to market a traditionally "masculine" product to women, or vice versa. This variable helps in refining the visual language and tone of advertising campaigns to ensure they align with the gender identity of the highest-value segments.
Influence on Decision-Making
Statistical trends often show differences in how genders approach the "buyer’s journey." For example, historical data from the U.S. Bureau of Labor Statistics often indicates variations in household purchasing influence between genders. Identifying these patterns allows researchers to target the primary decision-maker in a household more effectively.
3. Income: Assessing Purchasing Power and Price Elasticity
Income is the variable that determines what a consumer can buy, rather than just what they want to buy. In market research, income is typically measured as gross household income (HHI), providing a snapshot of the economic resources available to a consumer unit.
Discretionary vs. Essential Spending
High-income segments often exhibit lower price sensitivity and a higher demand for luxury goods, personalized services, and convenience. Conversely, lower-income segments may prioritize value, durability, and essential utility. Researchers use income data to calculate price elasticity—the degree to which the price of a product affects consumer demand. In 2026, with shifting global economies, keeping an accurate pulse on real-time income fluctuations is vital for maintaining competitive pricing.
Geographic Income Variations
Income must often be analyzed in conjunction with geography (geodemographics). A $75,000 annual income in a rural area represents significantly more purchasing power than the same amount in a major metropolitan hub like New York or London. Researchers use this variable to determine where to place physical retail locations or where to focus localized digital ad spend.
Wealth and Net Worth
In high-end market research, income alone may be insufficient. Researchers often look at "High Net Worth Individuals" (HNWIs) by considering assets and investments. This deeper dive into the income variable is essential for the finance, real estate, and private aviation sectors, where the ability to afford a product is based on accumulated wealth rather than monthly salary.
4. Education Level: Cognitive Drivers and Media Consumption
Education level is a powerful predictor of a consumer’s interests, media habits, and even their vocabulary. It is often categorized into segments such as high school graduate, some college, bachelor’s degree, and advanced degrees (Master’s, PhD, MD).
Information Processing
Consumers with higher levels of formal education may respond better to data-driven, evidence-based marketing that provides technical specifications and long-form content. Conversely, segments with less formal education might prefer straightforward, benefit-driven messaging that focuses on immediate results and social proof. Understanding this variable helps copywriters and designers tailor the complexity of their communications.
Correlation with Other Variables
Education level is a "proxy" variable, meaning it often correlates strongly with income and occupation. However, it offers unique insights into values. For example, higher education levels often correlate with an increased interest in environmental sustainability and corporate social responsibility (CSR). Brands prioritizing these values will target highly educated demographics even if their income levels vary.
Platform Selection
Research frequently shows that education levels influence where people spend their time online. Platforms like LinkedIn tend to have a higher concentration of users with advanced degrees compared to more entertainment-centric platforms. By analyzing the education variable, market researchers can optimize their media buy to ensure they are reaching the right cognitive demographic.
5. Occupation: Professional Identity and Routine
Occupation identifies what a person does for a living and, by extension, how they spend a significant portion of their time. This variable is crucial for both B2B (Business-to-Business) and B2C (Business-to-Consumer) research.
Professional Needs and Pain Points
In B2B research, occupation (or job title) is the primary filter. A Chief Technology Officer (CTO) has different needs and pressures than a Marketing Manager. In B2C research, occupation helps brands understand the daily routine of their customers. A construction worker has different clothing, nutritional, and scheduling needs than a software engineer who works remotely.
Socioeconomic Status (SES)
Occupation is a core component of Socioeconomic Status. It influences social circles, lifestyle aspirations, and brand affiliations. For instance, certain "status" brands specifically target "White Collar" professionals, while other brands find success by catering to the "Blue Collar" workforce with messages of reliability and hard work.
Work Environment Shifts
In 2026, researchers specifically track the "nature of work"—whether it is remote, hybrid, or on-site. This sub-variable of occupation has profound implications for the travel, real estate, and home-office equipment industries. By knowing a respondent’s occupation, researchers can infer their likely work environment and tailor product solutions accordingly.
Comparison of Demographic Variables
The following table summarizes how these five variables are typically utilized in a 2026 market research framework:
| Variable | Common Data Types | Primary Strategic Use |
|---|---|---|
| Age | Numerical, Brackets, Generations | Product lifecycle and life-stage targeting. |
| Gender | Binary, Non-binary, Self-describe | Personalization and inclusive brand positioning. |
| Income | Gross Household Income (HHI), Brackets | Pricing strategy and luxury/value tiering. |
| Education | Degree level, Years of schooling | Content complexity and media placement. |
| Occupation | Job title, Industry, Work mode | B2B lead scoring and lifestyle utility. |
Integrating Variables for Market Segmentation
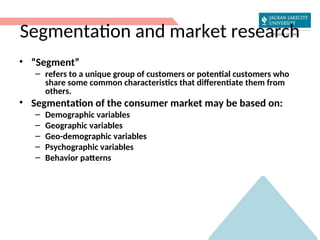
While each variable is powerful on its own, the true value of market research emerges when these variables are cross-tabulated. This process, known as multi-segmentation, allows for the creation of detailed "buyer personas."
For example, a luxury electric vehicle (EV) manufacturer might not just look for "high income." They might look for "Ages 35–50" (Age) who are "Advanced Degree holders" (Education) working in "Technology or Executive Management" (Occupation). By layering these demographic filters, the brand can ensure their marketing budget is not wasted on consumers who meet one criteria but lack the others.
The Role of Intersectionality
In 2026, researchers also consider "intersectionality"—how different demographic variables overlap to create unique consumer experiences. An older woman with a high income may have vastly different purchasing motivations than a younger man with the same income. Acknowledging these intersections prevents the "demographic trap" of oversimplification.
Data Collection and Ethics in 2026
Collecting demographic data requires strict adherence to privacy regulations such as the GDPR (General Data Protection Regulation) and various regional AI and data privacy acts updated through 2026.
Zero-Party vs. First-Party Data
Researchers now prioritize "Zero-Party Data"—information that a consumer intentionally and proactively shares with a brand. This is often collected through interactive quizzes or preference centers. It is considered more reliable and ethical than "Third-Party Data" purchased from external brokers, which has faced increasing legal restrictions.
Anonymization and Aggregation
To maintain trust, modern research platforms automatically anonymize demographic data. This means that while a researcher knows 45% of their audience is in the "30–39" age bracket, they cannot link that data back to a specific individual’s identity without explicit consent.
Common Pitfalls in Demographic Research
Despite their utility, demographic variables can lead to strategic errors if not handled with care.
- Stereotyping: Assuming all members of a demographic act the same. Not all Gen Z consumers are tech-obsessed, and not all high-income individuals buy luxury goods.
- Outdated Brackets: Using age or income brackets that are too wide. A 20-year-old and a 34-year-old are often in the same "18–34" bracket but have completely different lifestyles.
- Ignoring Psychographics: Relying solely on demographics while ignoring values, hobbies, and personality traits (psychographics) leads to a two-dimensional view of the customer.
- Data Decay: Demographic data changes. People get promoted (Income/Occupation), earn degrees (Education), and age. Continuous data refreshing is required for accuracy in 2026.
FAQ
Why is demographic segmentation better than mass marketing?
Mass marketing treats all consumers as a single group, which leads to high "waste" in advertising spend. Demographic segmentation allows brands to allocate resources to the specific groups most likely to buy, increasing the Return on Investment (ROI) and making messaging more relevant to the receiver.
Can demographics predict consumer behavior on their own?
Demographics provide the "who," but they rarely explain the "why." To predict behavior accurately, researchers must combine demographics with psychographics (values and attitudes) and behavioral data (past purchase history and website interactions).
How has the "Gender" variable changed in research recently?
In recent years, leading into 2026, there has been a significant shift toward gender fluidity in marketing. Many researchers now treat gender as a spectrum or focus more on "psychographic gender"—how a person identifies with traditionally masculine or feminine traits regardless of their biological sex.
What is the most important demographic variable?
There is no single "most important" variable; its importance depends on the product. For a retirement community, age is paramount. For a high-end investment firm, income and occupation take precedence.
How do I collect demographic data ethically?
In 2026, the gold standard is transparency. Tell your respondents exactly why you are collecting their age or income, how it will be used to improve their experience, and ensure your data storage complies with the latest privacy laws like the GDPR or CCPA.
Strategic Recommendation
To effectively leverage the 5 common demographic variables in 2026, organizations should move beyond static data collection. Begin by auditing your current customer database to identify which of these five variables are currently missing or outdated. Implement a "progressive profiling" strategy where you collect small pieces of demographic data over multiple interactions rather than overwhelming a user with a long survey at the start. Finally, always validate your demographic findings with qualitative research, such as interviews or focus groups, to ensure the "who" identified by your variables aligns with the real-world motivations of your customers.