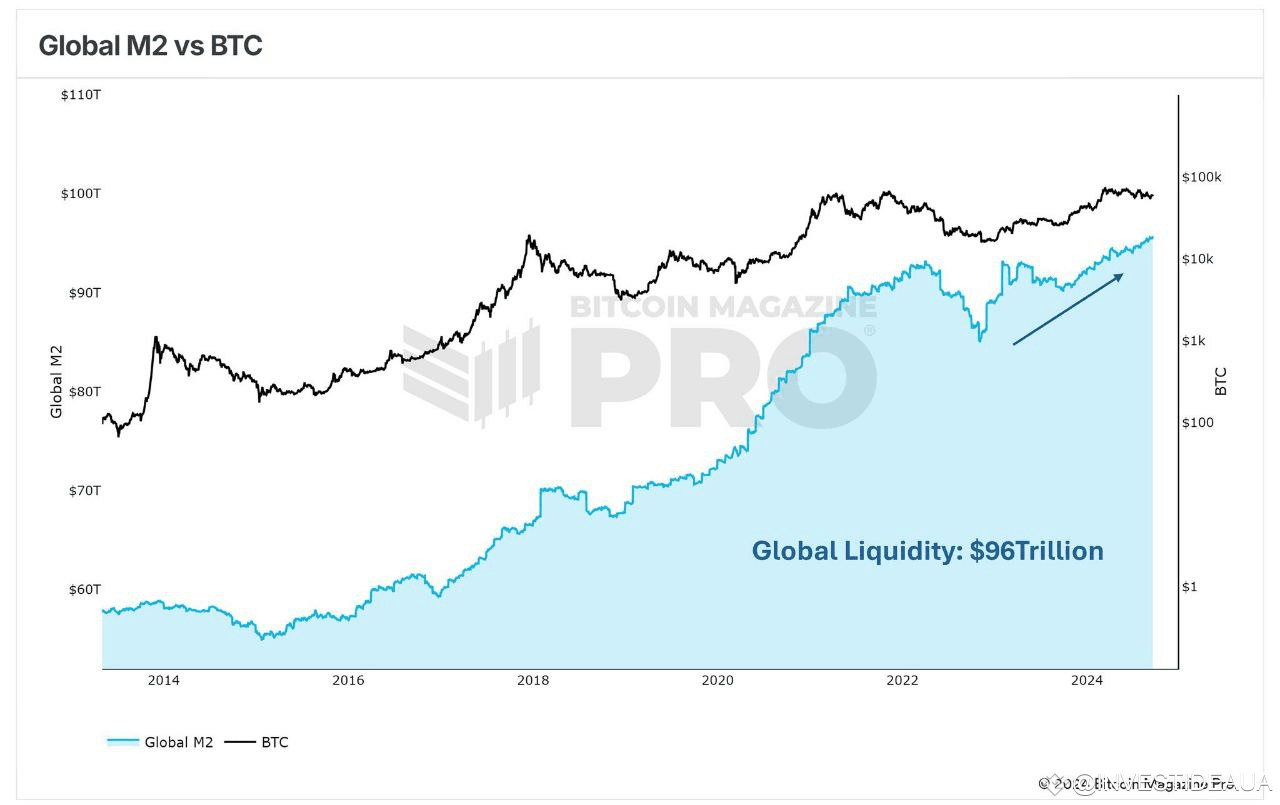
The single most critical fact about the global M2 money supply is that its aggregate expansion and contraction directly serve as a leading liquidity gauge for international asset valuations and macroeconomic trends. When central banks expand or restrict this broad measure of money—which encompasses cash, checking deposits, and easily convertible near-money assets—it alters systemic liquidity, reshapes capital allocation, and impacts pricing pressures worldwide.
To fully understand this dynamic, economists, financial analysts, and market participants must look past isolated domestic monetary policies. They must examine how international money aggregates interact with global trade, debt structures, and asset markets. This article explores the mechanics of global M2 money supply, examining its core components, historical context, calculation complexities, and practical implications for modern economic analysis.
Defining the Global M2 Money Supply
Before analyzing the broader impacts of the international money supply, it is essential to establish a precise definition of what M2 actually represents. Central banking institutions worldwide categorize money into tiered aggregates—most commonly M0, M1, M2, and sometimes M3. While definitions vary slightly by jurisdiction, the underlying economic concepts remain consistent.
The Standard Components of M2
The M2 money supply builds directly upon narrower measures of money, incorporating instruments that offer high liquidity alongside slightly restricted immediate access.
- M0 (Monetary Base): Currency in circulation (physical paper notes and coins) plus commercial bank reserves held at the central bank.
- M1 (Narrow Money): M0 minus vault cash and central bank reserves, plus demand deposits, checking accounts, and other checkable deposits held by the public.
- M2 (Broad Money): M1 plus savings deposits, time deposits (such as small-denomination certificates of deposit under specific regulatory thresholds), and retail money market mutual fund balances.
- M2
- M1
- M0 (Cash & Coins)
- Demand & Checking Accounts
- Savings Deposits, Small CDs, Retail Money Market Funds
- M1
Why M2 Matters More Than Narrow Money
While M1 captures money immediately available for transactions, M2 captures funds that can be mobilized for spending or investing within a short timeframe without significant penalty. This makes M2 a more comprehensive gauge of total purchasing power within an economy. When households shift funds from long-term locked investments into savings accounts or retail money market funds, those assets transition into the M2 aggregate, shifting the overall liquidity profile tracked by monetary policymakers.
The Global Dimension: Aggregating Diverse Monetary Policies
There is no single, centralized governing body that issues a unified "global M2" currency. Instead, the global M2 money supply represents an analytical aggregate of the individual M2 metrics reported by the world’s major central banks, most notably the United States Federal Reserve, the European Central Bank (ECB), the People's Bank of China (PBOC), the Bank of Japan (BOJ), and other prominent monetary authorities.
The Dominance of Major Economies
Because monetary size correlates with economic output and financial market depth, the global M2 aggregate is heavily skewed toward a handful of dominant jurisdictions.
- The United States: Drives global dollar liquidity through Federal Reserve policy, influencing international trade invoicing and offshore dollar lending.
- China: Features one of the largest absolute M2 aggregates in the world, reflecting high domestic savings rates and extensive state-directed banking credit creation.
- The Eurozone: Combines the monetary footprints of multiple member nations under the centralized policy direction of the ECB.
- Japan: Maintains structurally distinct monetary dynamics characterized by prolonged periods of quantitative easing and low interest rate environments.
Currency Conversion and Aggregation Challenges
Calculating a unified global M2 figure requires translating local currency metrics into a common unit of account, typically the U.S. dollar. This introduces analytical complexities driven by foreign exchange rate fluctuations. For instance, if local M2 measures remain entirely stable within Europe and Japan, but the U.S. dollar appreciates significantly against the euro and the yen, the converted global M2 figure expressed in dollars may contract. Analysts must therefore distinguish between nominal currency shifts and actual domestic credit expansion.
Mechanics of Money Creation and Contraction
Understanding how the global M2 money supply changes requires examining the dual mechanisms of monetary policy: central bank actions and commercial banking operations. Money is not merely printed; it is largely brought into existence through credit creation within the banking system.
Fractional Reserve Banking and Credit Expansion
Commercial banks play a primary role in expanding the M2 money supply. When a bank extends a loan, it typically creates a deposit in the borrower's action. This action expands M1 and M2 without requiring an equivalent physical transfer of central bank reserves.
- Loan Origination: A borrower secures a business loan or mortgage from a commercial bank.
- Deposit Creation: The bank credits the borrower’s checking account with the loan proceeds.
- Liquidity Circulation: The borrower spends the funds, transferring the deposit to another economic entity, which keeps the newly created money active within the broader financial system.
Conversely, when loans are paid off faster than new loans are issued, or when banks tighten lending standards due to perceived credit risk, the money supply contracts. This process is frequently referred to as credit deleveraging.
Central Bank Policy Instruments
Central banks influence this commercial credit cycle using several primary tools:
- Interest Rate Policy: Adjusting benchmark policy rates alters the cost of borrowing for commercial banks, which subsequently filters down to consumer and corporate lending rates.
- Open Market Operations: Buying or selling government securities injects or drains reserves from the banking system, altering the liquidity available for lending.
- Reserve Requirements and Regulatory Ratios: Mandating the proportion of deposits that banks must hold in reserve restricts or expands their capacity to extend new credit.
Historical Context and Structural Shifts
The trajectory of the global M2 money supply has evolved significantly over recent decades, shaped by structural financial innovations, regulatory overhauls, and extraordinary macroeconomic interventions.
Pre-Crisis Stability vs. Post-Crisis Expansion
Prior to the global financial crisis of 2007–2008, major central banks managed M2 growth through conventional interest rate adjustments, maintaining predictable, relatively stable growth trajectories aligned with nominal gross domestic product (GDP) expansion.
The subsequent implementation of large-scale asset purchases—commonly known as quantitative easing (QE)—fundamentally altered these patterns. Central banks purchased massive quantities of government bonds and mortgage-backed securities from non-bank financial institutions, swapping illiquid assets for bank reserves. While initial waves of quantitative easing primarily expanded the monetary base (M0) without causing immediate hyperinflation in consumer prices—largely because commercial banks accumulated excess reserves rather than lending them out aggressively—subsequent fiscal and monetary expansions during the 2020–2021 period drove unprecedented double-digit percentage surges in M2 growth across major economies.
Comparing Monetary Expansion Phases
| Period / Event | Primary Driver | Impact on Global M2 | Consequent Economic Outcome |
|---|---|---|---|
| Pre-2008 Era | Conventional interest rate management and normal commercial bank lending. | Steady, moderate, predictable upward trajectory. | Stable economic growth matched with moderate, predictable inflation rates. |
| 2008–2014 Crisis Response | Initial quantitative easing and emergency liquidity facilities. | Moderate-to-high expansion concentrated in the monetary base; subdued M2 velocity. | Asset price appreciation with muted consumer price inflation due to high bank reserve hoarding. |
| 2020–2021 Pandemic Policy | Combined aggressive central bank asset purchases and direct fiscal stimulus transfers. | Historic, rapid, double-digit expansion across M1 and M2 aggregates. | Subsequent widespread inflationary pressures and global supply chain adjustments. |
| 2022–2026 Normalization | Policy rate hikes, quantitative tightening (QT), and credit tightening. | Stagnation or outright contraction of M2 in several major jurisdictions. | Stabilization of money growth, elevated borrowing costs, and moderated economic momentum. |
The Link Between Global M2 and Asset Prices
The single key fact about global M2—its role as an aggregate liquidity gauge—carries direct implications for financial markets. Liquidity is the lifeblood of asset prices. When the global pool of M2 expands faster than the global production of goods and services, excess capital seeks deployment, frequently flowing into equities, real estate, commodities, and digital assets.
The Liquidity Transmission Mechanism
- Surplus Liquidity Creation: Central bank operations and commercial lending create excess funds within institutional and retail accounts.
- Yield Chasing: Low returns on cash and short-term fixed-income instruments push investors further out along the risk curve.
- Asset Valuation Inflation: Higher demand for risk assets bids up prices across public and private markets, frequently outstripping underlying corporate earnings growth or rental yields.
- Lagged Consumer Impact: As asset values rise and broader spending increases, consumer demand catches up, leading to broad-based inflationary pressures across goods and services.
Conversely, when global M2 contracts or its rate of growth slows significantly—a condition known as quantitative tightening—liquidity drains from the financial system. Investors are forced to deleverage, risk assets often face downward valuation pressures, and borrowing costs rise, which can cool economic activity.
Common Misconceptions Regarding Money Supply
Analyzing the global M2 money supply involves navigating several pervasive myths and oversimplified assumptions that can misguide financial decision-making.
Myth 1: More M2 Automatically Equals Immediate Consumer Inflation
A frequent mistake is assuming that an increase in the M2 money supply translates instantly into a proportional increase in the Consumer Price Index (CPI). In reality, the relationship depends heavily on velocity—the frequency at which a unit of currency is used to purchase domestically produced goods and services. If newly created money remains idle within bank accounts or is funneled entirely into financial market speculation rather than everyday commerce, consumer price inflation may remain subdued for extended periods.
Myth 2: Central Banks Control M2 Directly
While central banks maintain direct control over base money (M0) and short-term interest rates, they do not directly dictate the exact volume of M2. M2 is co-created by commercial banks and private borrowers through loan demand. If commercial banks tighten lending standards due to economic uncertainty, or if businesses and consumers refuse to take on new debt regardless of low interest rates, M2 growth can slow despite aggressive central bank easing.
Myth 3: Global M2 Moves in Unison Everywhere
Although major central banks often coordinate policy responses during global economic crises, domestic M2 growth rates frequently diverge. Structural differences in banking systems, local regulatory policies, demographic trends, and national fiscal deficits ensure that money supply growth in the United States, China, the Eurozone, and emerging markets can move at contrasting speeds.
Practical Applications for Analysts and Investors
Understanding the dynamics of the global M2 money supply provides practical value for individuals analyzing macroeconomic conditions, managing investment portfolios, or navigating corporate financial planning.
Monitoring Rate-of-Change Metrics
Savvy analysts rarely look at absolute M2 figures. Instead, they track the year-over-year percentage change and the three-month annualized growth rate of global M2 aggregates. A sharp acceleration in the rate of change often signals impending liquidity expansion, while a transition into negative year-over-year growth signals systemic liquidity contraction.
Integrating M2 with Cross-Asset Analysis
Investors use global M2 trends alongside other macroeconomic indicators to gauge market risk:
- Fixed Income: Monitor M2 growth to anticipate interest rate shifts and bond yield movements.
- Equities: Compare M2 expansion against corporate earnings growth to identify whether market rallies are driven by fundamental business growth or purely by monetary liquidity expansion.
- Commodities: Track broad money supply trends as an indicator of currency purchasing power and hard asset demand.
Frequently Asked Questions
What is the single key fact about global M2 money supply?
The single most important fact is that global M2 acts as the primary barometer for international systemic liquidity. Its expansion and contraction directly influence global asset valuations, credit availability, and long-term macroeconomic trends across international markets.
Why is M2 considered more comprehensive than M1?
M1 includes only physical currency and immediate demand deposits used for daily transactions. M2 includes M1 plus savings deposits, time deposits, and retail money market accounts, capturing funds that can be quickly converted into spending power.
Does the world have a single official global M2 figure?
No single global central bank calculates a unified global M2 statistic. Instead, financial researchers and international institutions aggregate the individual M2 money supply metrics reported by major central banks, typically converting local currencies into U.S. dollars for comparative analysis.
Why didn't quantitative easing after 2008 cause immediate hyperinflation?
Following the 2008 financial crisis, much of the newly created base money was held by commercial banks as excess reserves rather than being lent out into the broader economy. Because bank lending velocity remained low, broad money supply growth did not trigger immediate consumer price inflation.
How does a contracting M2 affect financial markets?
When global M2 contracts or slows down significantly, liquidity within the financial system decreases. This typically leads to tighter lending standards, higher borrowing costs, elevated pressure on risk assets, and a shift toward cash and high-quality fixed-income securities.
Conclusion and Next Actions
The global M2 money supply is much more than a technical accounting statistic; it is a vital indicator of international liquidity, credit creation, and economic momentum. By recognizing that M2 tracks the combined pool of cash, checking deposits, and liquid savings across major economies, analysts can better understand how monetary policy translates into asset price movements and macroeconomic shifts. To apply these insights effectively, begin tracking the monthly M2 growth reports published by major central banks such as the Federal Reserve, the ECB, and the PBOC, and evaluate how changes in broad money growth align with your broader investment or economic strategy.