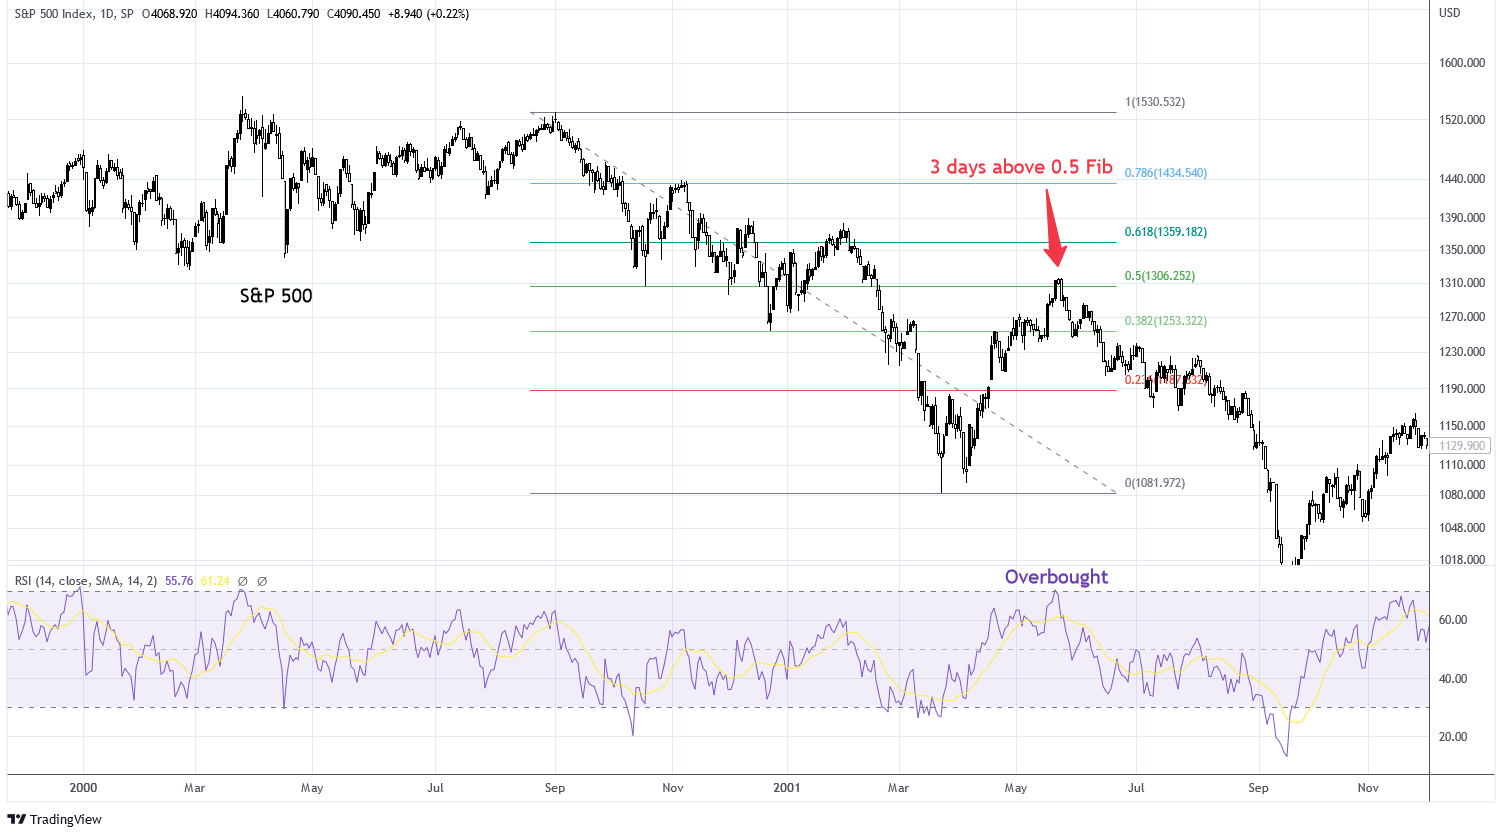
An S&P 500 interactive chart is a dynamic financial tool that allows users to visualize, filter, and analyze the historical and real-time performance of the Standard & Poor's 500 Index. By leveraging customizable timeframes, technical indicators, and multi-asset overlays, investors and researchers can uncover market trends, evaluate volatility, and conduct rigorous technical and fundamental analysis.
Understanding the S&P 500 Interactive Chart
The S&P 500 index tracks 500 of the largest publicly traded companies in the United States, serving as a primary benchmark for the broader equity market. While static charts provide a fixed snapshot of past price movements, an interactive chart empowers users to manipulate the visual data stream. Users can zoom into specific intraday trading sessions, expand the view across multi-decade structural bull and bear markets, and toggle various financial metrics on the fly.
To use these tools effectively, analysts must understand the core architecture of financial graphing interfaces. Most institutional-grade and retail platforms provide access to customizable candlestick, line, and bar charts. These interfaces allow users to overlay economic data, adjust scales from linear to logarithmic, and apply algorithmic studies directly to the price action. Mastering these features transforms raw ticker data into actionable market intelligence.
1. Customizing Timeframes for Macro and Micro Analysis
The primary utility of an interactive charting interface lies in its ability to adjust chronological horizons instantly. Analysts can toggle between a one-minute intraday view and a fifty-year logarithmic historical chart with a few clicks.
- Intraday and Short-Term Views: Examining 1-minute, 5-minute, or 1-hour intervals helps day traders and swing traders identify immediate support and resistance zones, intraday momentum shifts, and reaction points around economic data releases.
- Medium-Term Cycles: Daily and weekly charts assist portfolio managers in spotting intermediate trends, swing trading opportunities, and consolidation patterns that develop over several weeks or months.
- Long-Term Structural Trends: Monthly and yearly views reveal secular bull and bear markets, structural economic shifts, and generational valuation extremes. Long-term perspectives help investors contextualize current price action against historical precedents.
2. Applying and Customizing Technical Indicators
Technical indicators mathematically transform price and volume data to forecast future price movements or identify overextended market conditions. Interactive charts allow users to apply dozens of studies simultaneously and customize their underlying parameters.
- Trend-Following Tools: Moving averages—such as the 50-day and 200-day Simple Moving Averages (SMA)—help identify the dominant market direction and signal potential trend reversals when crossovers occur.
- Momentum Oscillators: Indicators like the Relative Strength Index (RSI) and Moving Average Convergence Divergence (MACD) quantify the speed and change of price movements, highlighting potential overbought or oversold conditions.
- Volatility Metrics: Bollinger Bands and Average True Range (ATR) measure market volatility, expanding during turbulent periods and contracting during market consolidation phases.
3. Utilizing Logarithmic Versus Linear Scaling
When analyzing financial charts spanning multiple decades, the choice of scale significantly alters the visual representation of percentage gains and losses.
- Linear Scaling: A linear scale spaces price increments evenly along the vertical axis. While useful for short-term charts, it distorts long-term data because a 100-point move from 1,000 to 1,100 looks identical to a 100-point move from 5,000 to 5,100, despite the latter representing a much smaller percentage change.
- Logarithmic Scaling: A logarithmic scale spaces increments proportionally based on percentage changes. On a log chart, a consistent percentage gain occupies the same vertical distance, making it essential for analyzing long-term exponential growth and structural S&P 500 performance.
4. Overlaying Economic Data and Macroeconomic Events
Market movements rarely occur in a vacuum. Advanced interactive charts allow users to overlay macroeconomic indicators and corporate data directly onto the S&P 500 price series.
- Interest Rates and Yields: Overlaying the 10-year U.S. Treasury yield helps analysts evaluate the relationship between borrowing costs and equity valuations.
- Inflation and Employment Metrics: Correlating Consumer Price Index (CPI) releases or non-farm payroll reports with S&P 500 price action reveals how equity markets react to macroeconomic shocks.
- Federal Reserve Policy: Marking Federal Open Market Committee (FOMC) rate decisions on the chart helps investors track how monetary policy shifts influence market direction over time.
5. Comparing Performance with Other Asset Classes
Relative strength analysis is a cornerstone of professional portfolio management. Interactive charts enable users to benchmark the S&P 500 against other asset classes, sectors, or individual equities on a normalized percentage basis.
- Sector Rotation: Comparing the S&P 500 index against specific sectors—such as technology, healthcare, or utilities—highlights which industries are leading or lagging the broader market.
- Asset Class Diversification: Overlaying gold, commodities, or international equity indices helps investors evaluate correlations, portfolio diversification benefits, and safe-haven flows during market stress.
6. Drawing Custom Support, Resistance, and Trendlines
Visual annotation tools enable analysts to map out market psychology and historical inflection points directly onto the chart interface.
- Support and Resistance Levels: Users can draw horizontal lines across historical price peaks and troughs where buying or selling pressure previously stalled market advances or declines.
- Trendline Construction: Connecting ascending lows or descending highs establishes visual boundaries for channels, triangles, and wedges, assisting in pattern recognition and breakout identification.
- Fibonacci Retracements: Applying Fibonacci tools from swing lows to swing highs identifies mathematically probable retracement levels during market pullbacks.
7. Analyzing Volume and Market Participation
Price action alone tells only part of the story; volume data reveals the level of institutional commitment behind price movements.
- Volume Histograms: Displaying trading volume at the base of the chart helps confirm the validity of breakouts. A price breakout accompanied by high volume carries more statistical reliability than one occurring on low volume.
- Volume Profile: Advanced charts offer volume profile tools that display trading activity over a specific price range rather than a time interval, identifying high-volume nodes where significant trading interest occurred.
8. Backtesting Strategies and Visualizing Historical Drawdowns
Understanding historical risk parameters is essential for risk management. Interactive charts allow investors to examine how the S&P 500 performed during past systemic crises.
- Drawdown Measurement: Using measurement tools, users can calculate the exact percentage drop and duration of historical bear markets, such as the 2008 financial crisis or the 2020 market disruption.
- Recovery Timeline Analysis: Observing how quickly the index recovered past losses provides historical context for managing portfolio volatility during modern market downturns.
9. Setting Custom Alerts and Price Notifications
Modern interactive charting platforms extend beyond passive analysis by offering proactive monitoring capabilities.
- Price Level Triggers: Users can set alerts that trigger notifications via email, SMS, or mobile push notifications when the S&P 500 crosses specific threshold values.
- Indicator Alerts: Advanced platforms allow alerts based on technical conditions, such as an RSI moving below 30 or a moving average crossover event.
10. Saving Layouts, Templates, and Multi-Chart Workspaces
Efficiency in market monitoring requires organized workspaces tailored to specific analytical frameworks.
- Custom Templates: Once a user configures their preferred indicators, color schemes, and timeframes, they can save the layout as a reusable template.
- Multi-Panel Views: Many platforms allow users to display multiple charts simultaneously—such as a daily chart alongside an hourly chart and a sector comparison—in a unified dashboard.
11. Exporting Data and Generating Reports for Offline Analysis
For quantitative researchers and financial planners, visual inspection is often just the first step in a broader analytical workflow.
- CSV Data Export: Users can export historical open, high, low, close, and volume (OHLCV) data into spreadsheet formats for custom quantitative modeling, statistical testing, or spreadsheet-based financial planning.
- High-Resolution Image Capture: Generating clean chart images allows analysts to include visual evidence in research reports, client presentations, or educational materials.
12. Utilizing Cross-Device Synchronization for Mobile Monitoring
Market opportunities do not adhere to traditional office hours. Modern cloud-based charting platforms ensure continuity across multiple devices.
- Cloud-Saved Settings: Annotations, favorite indicators, and custom watchlists saved on a desktop browser automatically synchronize with mobile applications.
- On-the-Go Surveillance: Investors can monitor intraday S&P 500 movements and review technical setups from smartphones or tablets while away from primary trading terminals.
| Feature / Tool | Primary Purpose | Best Used For |
|---|---|---|
| Logarithmic Scale | Proportional percentage scaling | Long-term multi-decade trend analysis |
| Moving Averages (SMA/EMA) | Trend identification and smoothing | Spotting intermediate trends and crossovers |
| Volume Profile | Price-based volume distribution | Locating institutional liquidity zones |
| Fibonacci Retracement | Mathematical pullback estimation | Finding potential support during corrections |
| Asset Overlay | Relative strength comparison | Sector rotation and asset allocation |
Frequently Asked Questions
What is the difference between a static chart and an interactive S&P 500 chart?
A static chart provides a fixed image of past price data that cannot be modified, zoomed, or customized. An interactive chart allows users to dynamically alter timeframes, apply technical indicators, draw custom annotations, and overlay macroeconomic data in real-time.
Why should I use a logarithmic scale instead of a linear scale on long-term charts?
A logarithmic scale displays equal percentage changes as equal vertical distances. On a linear scale, older price movements appear compressed because absolute point values were smaller, making logarithmic scaling essential for accurate long-term trend analysis.
Can I track intraday S&P 500 movements using an interactive chart?
Yes. Most interactive charting platforms offer intraday intervals ranging from 1-minute to 1-hour candles, allowing day traders to monitor real-time price action and short-term volatility.
How do technical indicators help analyze the S&P 500?
Technical indicators apply mathematical formulas to price and volume data to help identify trends, measure momentum, and highlight potential overbought or oversold market conditions.
Are interactive S&P 500 charts free to use?
Basic interactive charting tools are widely available for free on financial news websites and brokerage platforms. However, advanced institutional features, real-time tick data, and specialized studies may require a paid subscription.
Conclusion and Next Action
Mastering an S&P 500 interactive chart bridges the gap between raw financial data and informed decision-making. To put these capabilities into practice, open a reputable charting platform, select a multi-year logarithmic view, apply a 200-day moving average, and observe how historical market cycles have unfolded. Combine technical observation with disciplined risk management to enhance your overall market analysis workflow.