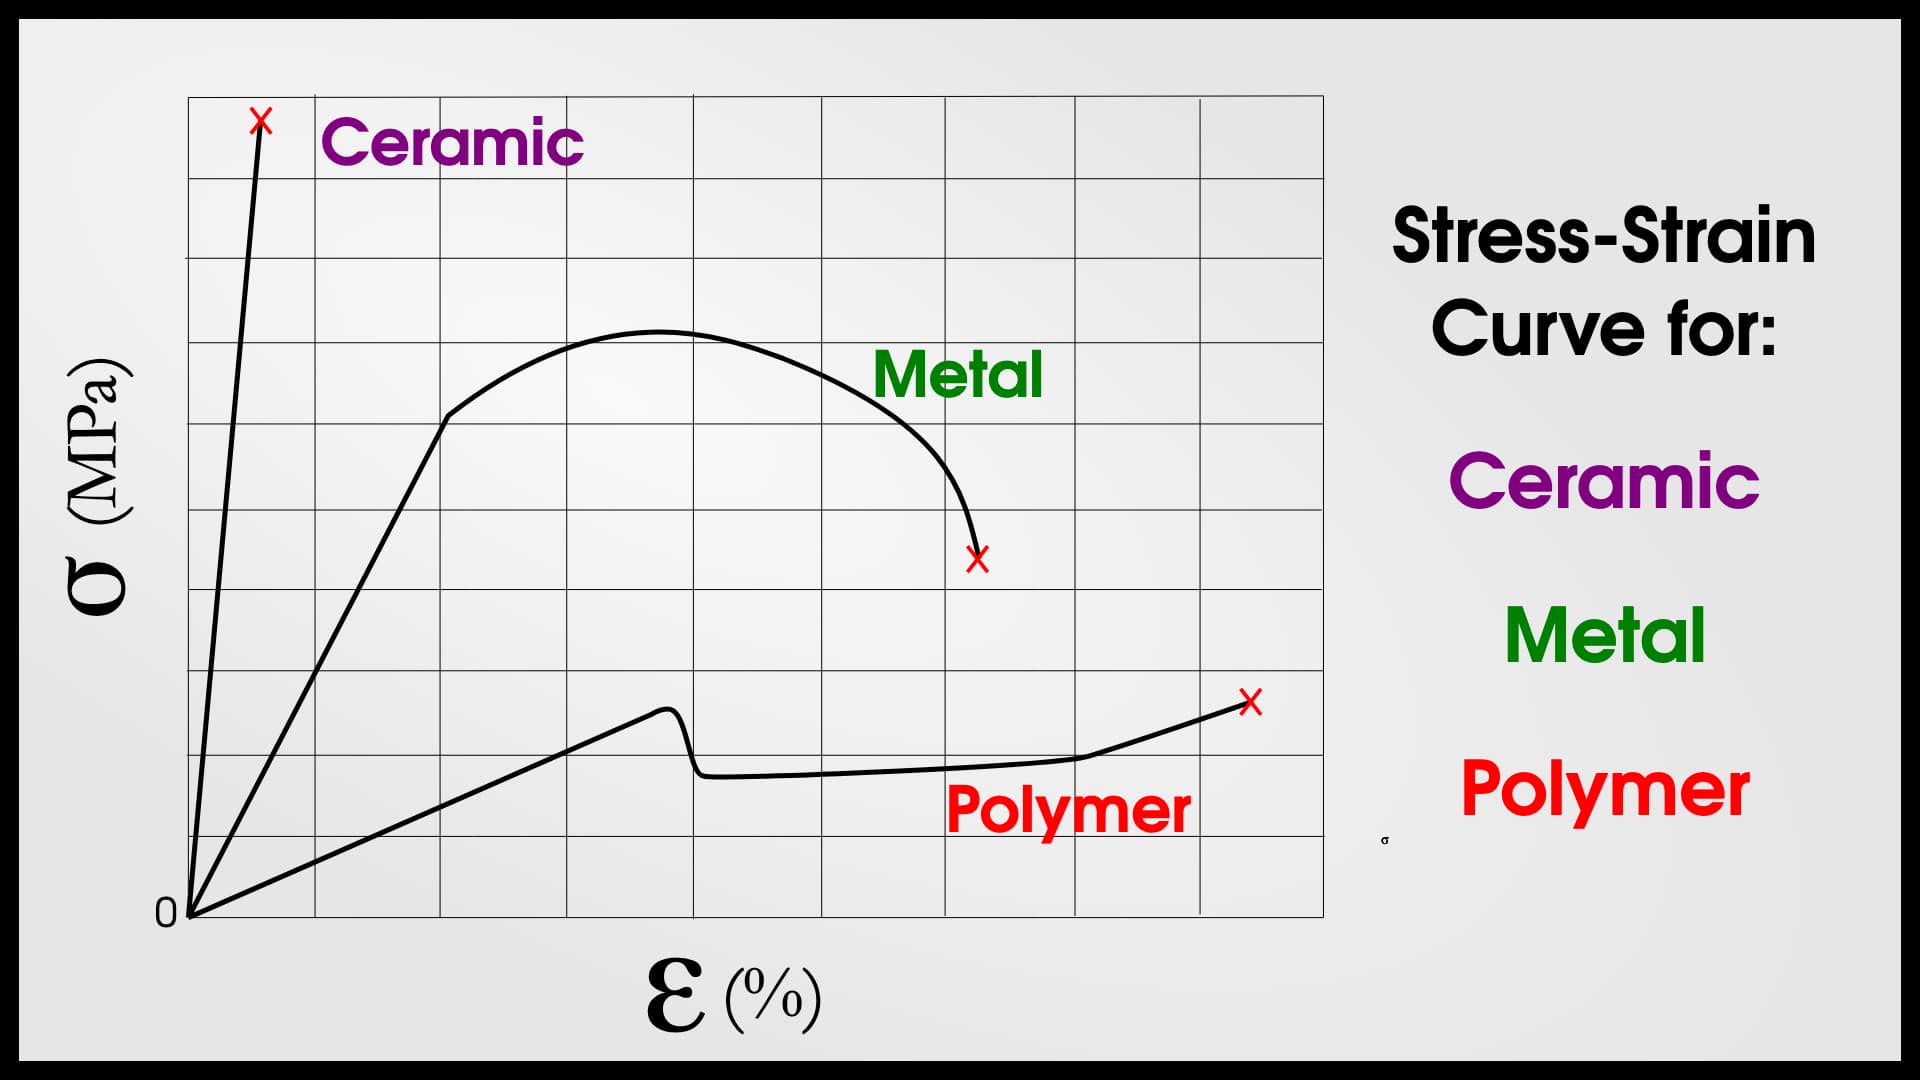
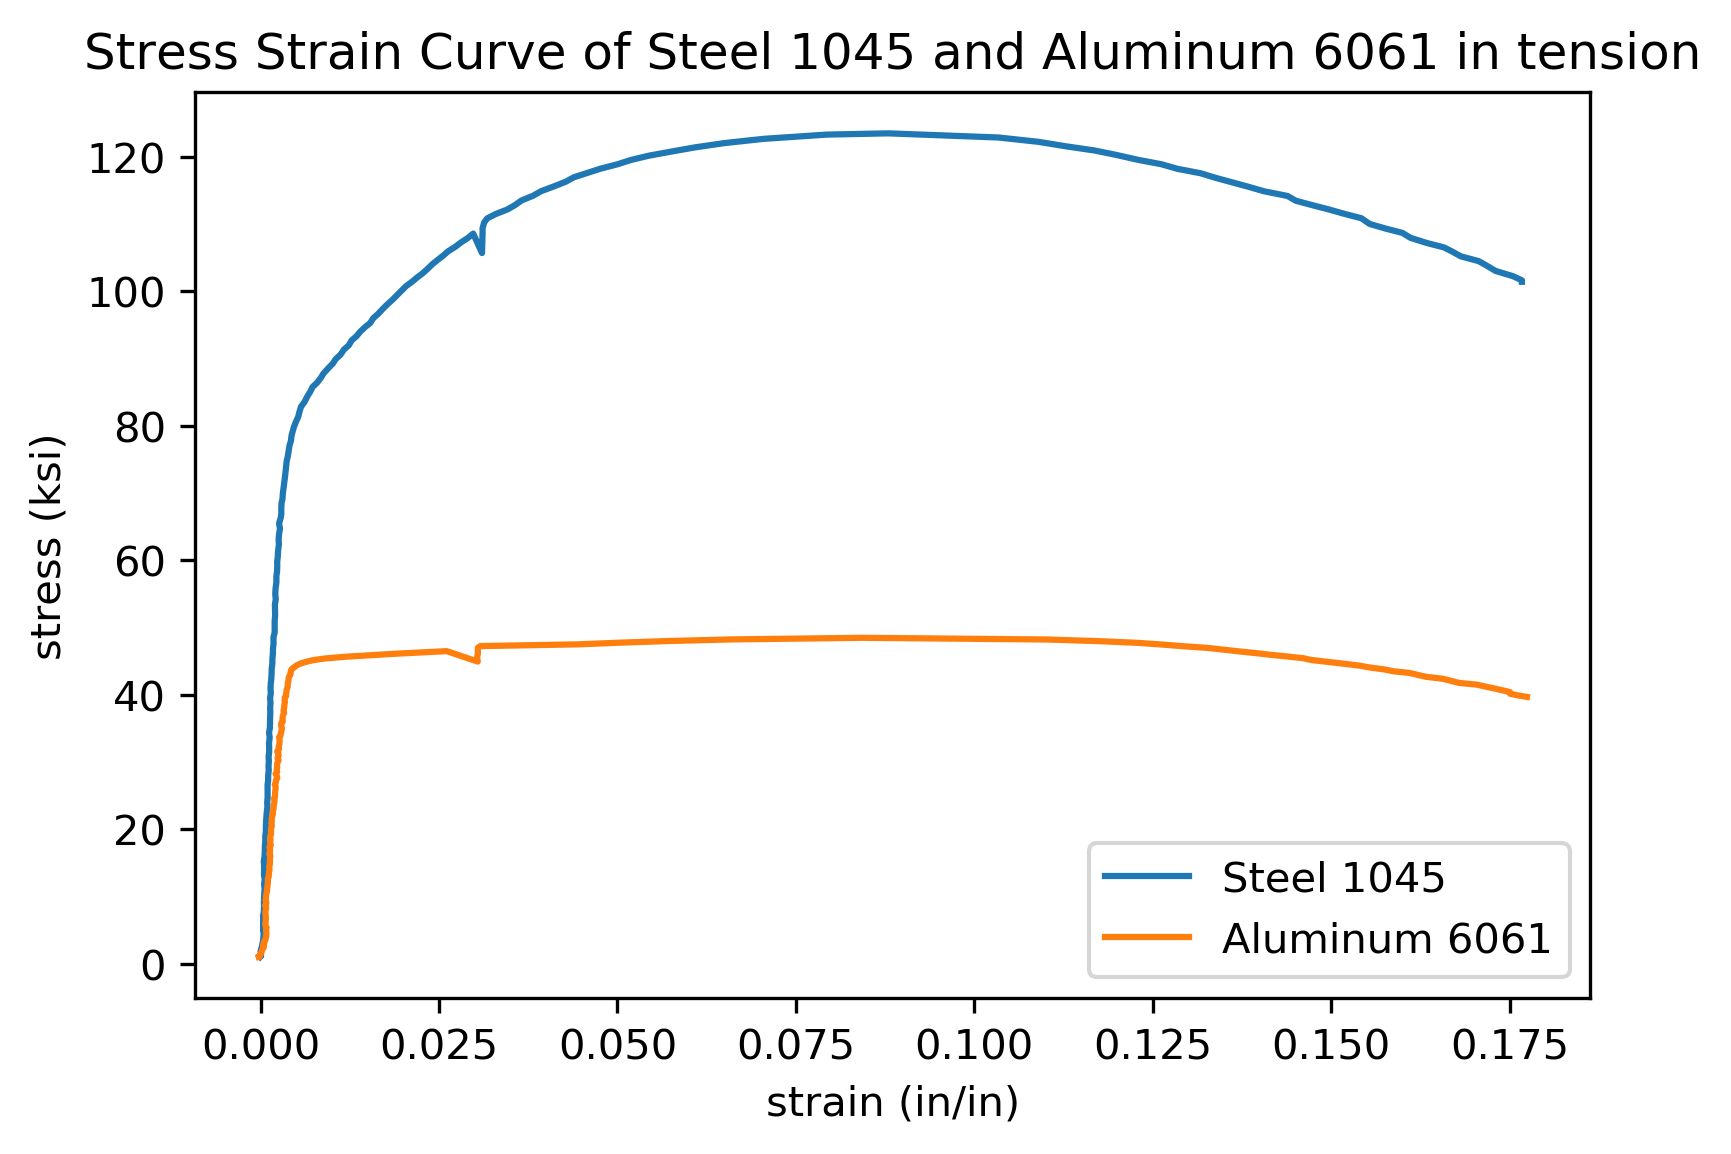
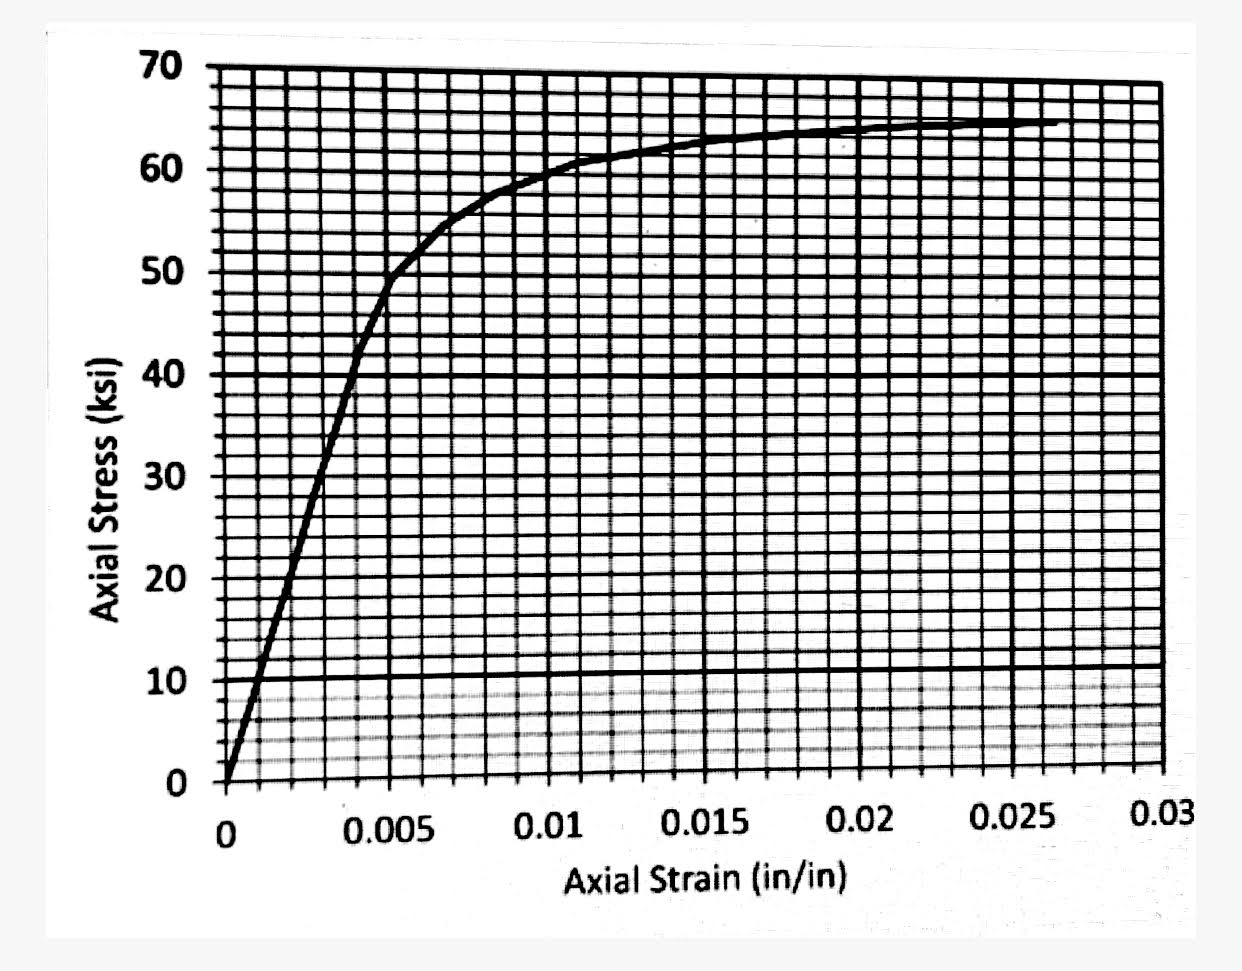
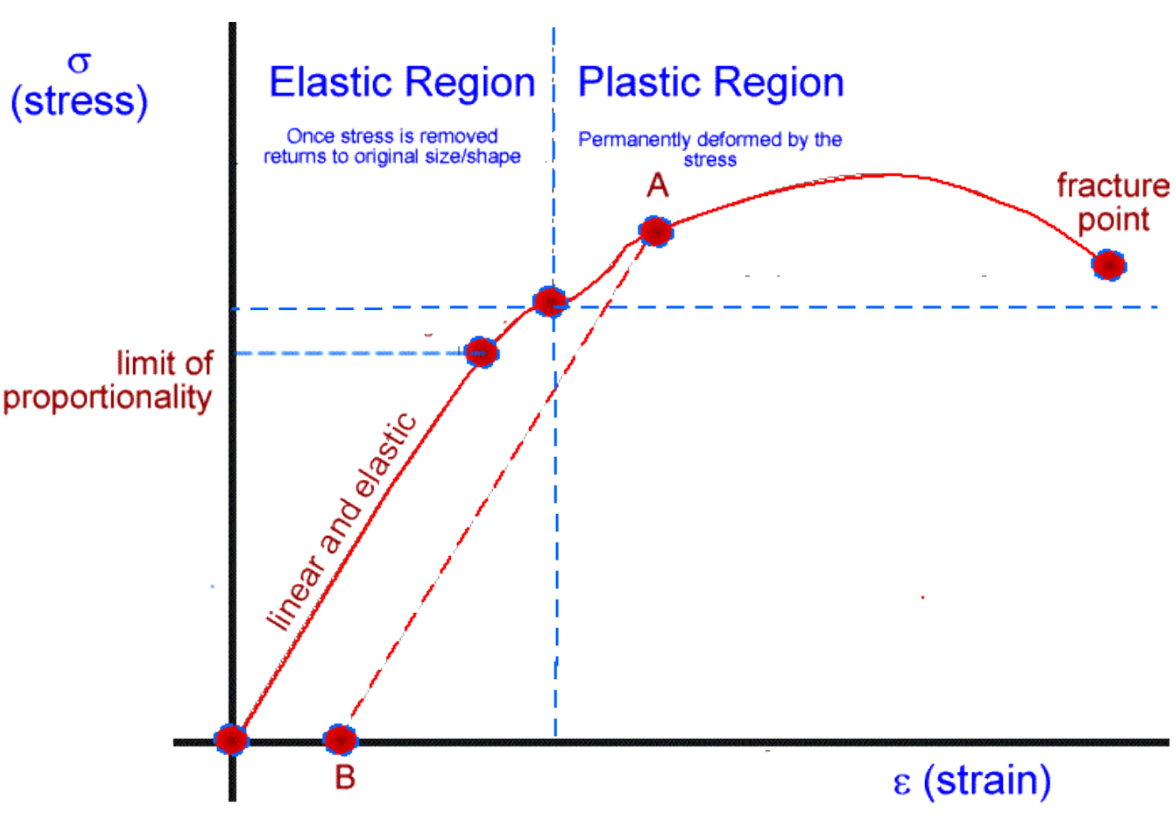
The stress-strain curve for Aluminum 6061 illustrates how this versatile alloy responds to external loads, progressing from linear elastic deformation to permanent plastic change, and finally to fracture. By analyzing specific points like the yield strength, ultimate tensile strength, and elongation, engineers can determine the material's suitability for structural and mechanical applications.
Aluminum 6061 is one of the most widely used precipitation-hardened aluminum alloys, prized for its excellent strength-to-weight ratio, corrosion resistance, and weldability. Understanding its stress-strain curve is not merely an academic exercise; it is a fundamental requirement for any engineer or designer working in aerospace, automotive, or marine industries as of 2026. The curve provides a visual and mathematical representation of the material's mechanical "personality," dictating how it will behave under the stresses of real-world service.
The Fundamentals of the Stress-Strain Relationship
To understand the Aluminum 6061 curve, one must first understand the variables involved. Stress ($\sigma$) is defined as the internal force per unit area acting on the material, typically measured in Megapascals (MPa) or pounds per square inch (psi). Strain ($\epsilon$) is the dimensionless measure of deformation, representing the change in length relative to the original length of the specimen.
The data for this curve is gathered through a standard tensile test, usually following protocols like ASTM E8/E8M. In this test, a "dog-bone" shaped specimen of 6061 is pulled at a controlled rate until it breaks. Sensors measure the force applied and the resulting extension, which are then converted into the stress-strain plot. While there are subtle variations based on the "temper" (heat treatment) of the aluminum, the general shape of the 6061 curve follows a predictable path through several distinct regions.
The Elastic Region: Hooke’s Law and Young’s Modulus
The journey begins at the origin of the graph (zero stress, zero strain). As load is initially applied to Aluminum 6061, the material enters the Elastic Region. In this phase, the relationship between stress and strain is linear, meaning they are directly proportional to each other.
The Mechanism of Elasticity
At the atomic level, the aluminum atoms are being slightly pulled apart from their equilibrium positions within the crystal lattice. However, the bonds between the atoms are not breaking; they are simply stretching. If the load is removed at any point within this region, the atoms will return to their original positions, and the specimen will return to its original dimensions. This is known as reversible deformation.
Young’s Modulus ($E$)
The slope of this linear portion is known as the Modulus of Elasticity, or Young’s Modulus. For Aluminum 6061, this value is approximately 68.9 GPa (10,000 ksi). Regardless of the heat treatment (whether it is 6061-O, 6061-T4, or 6061-T6), the Modulus of Elasticity remains virtually the same because it is a reflection of the interatomic bond strength of the aluminum matrix itself. This value is critical for calculating the "stiffness" of a component—its resistance to bending or stretching under load.
The Proportional Limit and the Transition to Yielding
As the stress increases, the curve eventually begins to deviate from the straight line. The last point at which the stress-strain ratio is perfectly linear is called the Proportional Limit. Slightly beyond this is the Elastic Limit, the maximum stress the material can endure without suffering permanent deformation.
In Aluminum 6061, these two points are very close together and are often difficult to distinguish on a standard plot. Unlike mild steel, which often exhibits a sharp, jagged "upper and lower yield point," Aluminum 6061 transitions smoothly from elastic to plastic behavior. This "smooth knee" in the curve necessitates a specific method for defining when "yielding" has officially occurred.
The Yield Strength and the 0.2% Offset Method
Because Aluminum 6061 does not have a discrete yield point, engineers use the 0.2% Offset Method to determine its Yield Strength.
How the 0.2% Offset is Calculated
- A line is drawn parallel to the linear elastic portion of the curve, starting at a strain value of 0.002 (or 0.2%).
- The point where this offset line intersects the actual stress-strain curve is defined as the Yield Strength.
For the common 6061-T6 temper, the yield strength is typically around 276 MPa (40,000 psi). For the annealed 6061-O temper, it is much lower, often around 55 MPa (8,000 psi). Reaching the yield strength marks the onset of Plastic Deformation. From this point forward, any additional stress will cause permanent, irreversible changes to the material’s shape.
The Plastic Region: Strain Hardening (Work Hardening)
Once the yield strength is exceeded, the Aluminum 6061 enters the Plastic Region. Here, the material undergoes permanent deformation through a process called "slip." On a microscopic level, dislocations (defects in the crystal lattice) begin to move and multiply.
The Phenomenon of Strain Hardening
As the dislocations move, they eventually begin to tangle and pile up against each other and against grain boundaries. These "logjams" of dislocations make it increasingly difficult for further deformation to occur. Consequently, the material actually becomes stronger as it is deformed. This is known as Strain Hardening or Work Hardening.
On the stress-strain curve, this is represented by the continued rise of the curve after the yield point. Even though the material is permanently stretching, it still requires an increasing amount of stress to continue that stretching. For 6061-T6, this region is relatively short compared to softer alloys because the T6 heat treatment has already "pre-hardened" the material via precipitation of magnesium silicide ($Mg_2Si$), leaving less room for additional work hardening.
Ultimate Tensile Strength (UTS)
The curve eventually reaches a peak. This peak represents the Ultimate Tensile Strength (UTS). It is the maximum engineering stress that the Aluminum 6061 can withstand before it begins to fail.
For 6061-T6, the UTS is approximately 310 MPa (45,000 psi). At this exact point on the curve, the rate of strain hardening (which strengthens the material) is exactly balanced by the rate of cross-sectional area reduction (which weakens the specimen). Once the UTS is passed, the material can no longer support the load effectively, and the "engineering stress" begins to drop, even though the material is still being pulled.
Necking: The Onset of Instability
Immediately following the UTS, the deformation stops being uniform throughout the length of the specimen. Instead, the material begins to thin out rapidly in one specific location. This localized reduction in cross-sectional area is called Necking.
Because the cross-section is shrinking so fast at the neck, the "Engineering Stress" (calculated using the original area) appears to decrease on the graph. However, the "True Stress" (calculated using the actual instantaneous area) continues to rise until the moment of fracture. In practical engineering design, the onset of necking is considered a failure point, as the structural integrity is compromised by the rapid localized thinning.
Fracture and Failure
The final point on the stress-strain curve is the Fracture Point. This is where the internal bonds of the Aluminum 6061 finally give way, and the specimen snaps into two pieces.
Ductile vs. Brittle Failure
Aluminum 6061 is generally considered a ductile material, though its level of ductility depends heavily on its temper. A ductile failure is characterized by significant plastic deformation and a "cup and cone" appearance at the break site.
- 6061-T6: Displays moderate ductility, with an elongation at break of roughly 8% to 17% depending on the thickness.
- 6061-O: Displays high ductility, with elongation reaching 25% to 30%, resulting in a much "longer" plastic region on the stress-strain curve.
Engineering vs. True Stress-Strain Curves
It is important to distinguish between the Engineering Stress-Strain Curve and the True Stress-Strain Curve.
| Feature | Engineering Curve | True Curve |
|---|---|---|
| Area Used | Original cross-sectional area ($A_0$) | Instantaneous cross-sectional area ($A_i$) |
| Length Used | Original gauge length ($L_0$) | Instantaneous length ($L_i$) |
| Post-UTS Behavior | Curve trends downward due to necking. | Curve continues to trend upward until fracture. |
| Common Use | Standard design and material comparison. | Advanced manufacturing simulations (e.g., forging). |
For most structural designs in 2026, the engineering curve is the standard reference. However, for processes like deep drawing or heavy machining where the metal is pushed far past its yield point, the True Stress-Strain curve is required for accurate calculations.
Comparison of Aluminum 6061 Tempers
The specific "path" the curve takes is dictated by the heat treatment (temper). Below is a comparison of the typical mechanical properties that define the curve for different versions of 6061.
| Property | 6061-O (Annealed) | 6061-T4 (Solution Heat Treated) | 6061-T6 (Precipitation Hardened) |
|---|---|---|---|
| Yield Strength (0.2% Offset) | ~55 MPa (8 ksi) | ~145 MPa (21 ksi) | ~276 MPa (40 ksi) |
| Ultimate Tensile Strength | ~125 MPa (18 ksi) | ~240 MPa (35 ksi) | ~310 MPa (45 ksi) |
| Modulus of Elasticity | 68.9 GPa | 68.9 GPa | 68.9 GPa |
| Elongation at Break (%) | 25% - 30% | 20% - 25% | 8% - 17% |
| Curve Characteristic | Long, flat plastic region. | Moderate curve. | High peak, shorter plastic region. |
External Factors Influencing the Curve
While the alloy composition is fixed, environmental and operational factors can shift the Aluminum 6061 stress-strain curve significantly.
Temperature Effects
Aluminum alloys are sensitive to temperature. As the temperature increases, the yield strength and UTS decrease, while the ductility (elongation) increases. Conversely, at cryogenic temperatures (common in aerospace applications), Aluminum 6061 actually becomes stronger and retains much of its toughness, unlike many steels which become brittle.
Strain Rate
The speed at which the material is pulled also matters. In high-speed impacts or ballistic scenarios, Aluminum 6061 exhibits "strain-rate sensitivity," where the yield strength may appear higher than it would in a slow, quasi-static tensile test.
Aging and Time
Because 6061 is a precipitation-hardened alloy, its properties can change over time if exposed to heat. Over-aging (heating beyond the T6 parameters) causes the $Mg_2Si$ precipitates to grow too large, which "softens" the material and lowers the entire stress-strain curve.
Practical Engineering Applications of the Data
Engineers use the 6061 stress-strain curve to establish Factors of Safety (FoS). For most structural applications, the "working stress" is kept well within the elastic region—often at or below 50% to 60% of the yield strength.
- Stiffness Design: If a component must not deflect under load (like a camera gimbal or a mounting bracket), the designer focuses on the Modulus of Elasticity.
- Permanent Set: If a part is being "formed" (bent into a permanent shape), the manufacturer must apply enough stress to move into the Plastic Region, but not enough to reach the UTS, which would risk cracking.
- Energy Absorption: In automotive crush zones, the "area under the curve" is calculated. This area represents the Toughness of the material—its ability to absorb energy before failing. 6061-T6 provides a good balance of strength and energy absorption.
Common Pitfalls in Interpreting the Curve
A frequent mistake is assuming that "Failure" only occurs at the fracture point. In many precision engineering contexts, failure occurs the moment the material passes the Yield Point. For example, if an internal combustion engine connecting rod made of 6061-T6 yields by even 0.5%, it will likely cause a catastrophic engine failure, even though it hasn't technically "snapped" yet.
Another error is ignoring the effect of welding. When 6061-T6 is welded, the heat of the weld "anneals" the surrounding area, locally reverting the material properties toward the 6061-O state. This creates a "soft spot" where the stress-strain curve is much lower than the rest of the part, often leading to failure at the heat-affected zone (HAZ).
Frequently Asked Questions
Does Aluminum 6061 have a fatigue limit on the stress-strain curve?
No. The stress-strain curve represents a single "pull" to failure (static loading). Fatigue involves repeated loading and unloading. Aluminum alloys, including 6061, do not have a well-defined endurance limit like steel; they will eventually fail under cyclic loading even at stresses below the yield strength.
Why is the 6061-T6 curve steeper than the 6061-O curve?
Actually, the slope (Young's Modulus) is the same for both. The 6061-T6 curve appears "taller" because it stays linear for much longer before yielding, but the initial angle of the line is identical because the atomic bond strength doesn't change with heat treatment.
Can I use the stress-strain curve to predict hardness?
There is a general correlation between UTS and hardness. For Aluminum 6061, as the UTS on the curve increases (e.g., moving from O to T6 temper), the Brinell or Rockwell hardness also increases. However, they are not interchangeable values.
What happens to the curve if the aluminum is cold-worked?
Cold-working (like rolling or drawing) increases the yield strength and moves the yield point higher up the curve, but it significantly reduces the elongation (ductility), making the "tail" of the curve much shorter.
Is the stress-strain curve the same for 6061-T6 sheet and 6061-T6 extrusion?
They are very similar, but not identical. Extrusions often have "directional" properties (anisotropy) where the stress-strain behavior is slightly different depending on whether you pull the specimen "with" or "across" the grain created by the extrusion process.
Moving Forward with Aluminum 6061
When selecting Aluminum 6061 for a project, always specify the temper and consult the specific stress-strain data provided by the material manufacturer. In critical 2026 applications, especially those involving additive manufacturing (3D printing) of 6061-equivalent alloys, the curve may vary due to layer-line orientation. Always perform site-specific tensile testing if the application involves life-safety or high-performance requirements to ensure the material performs as the curve predicts.