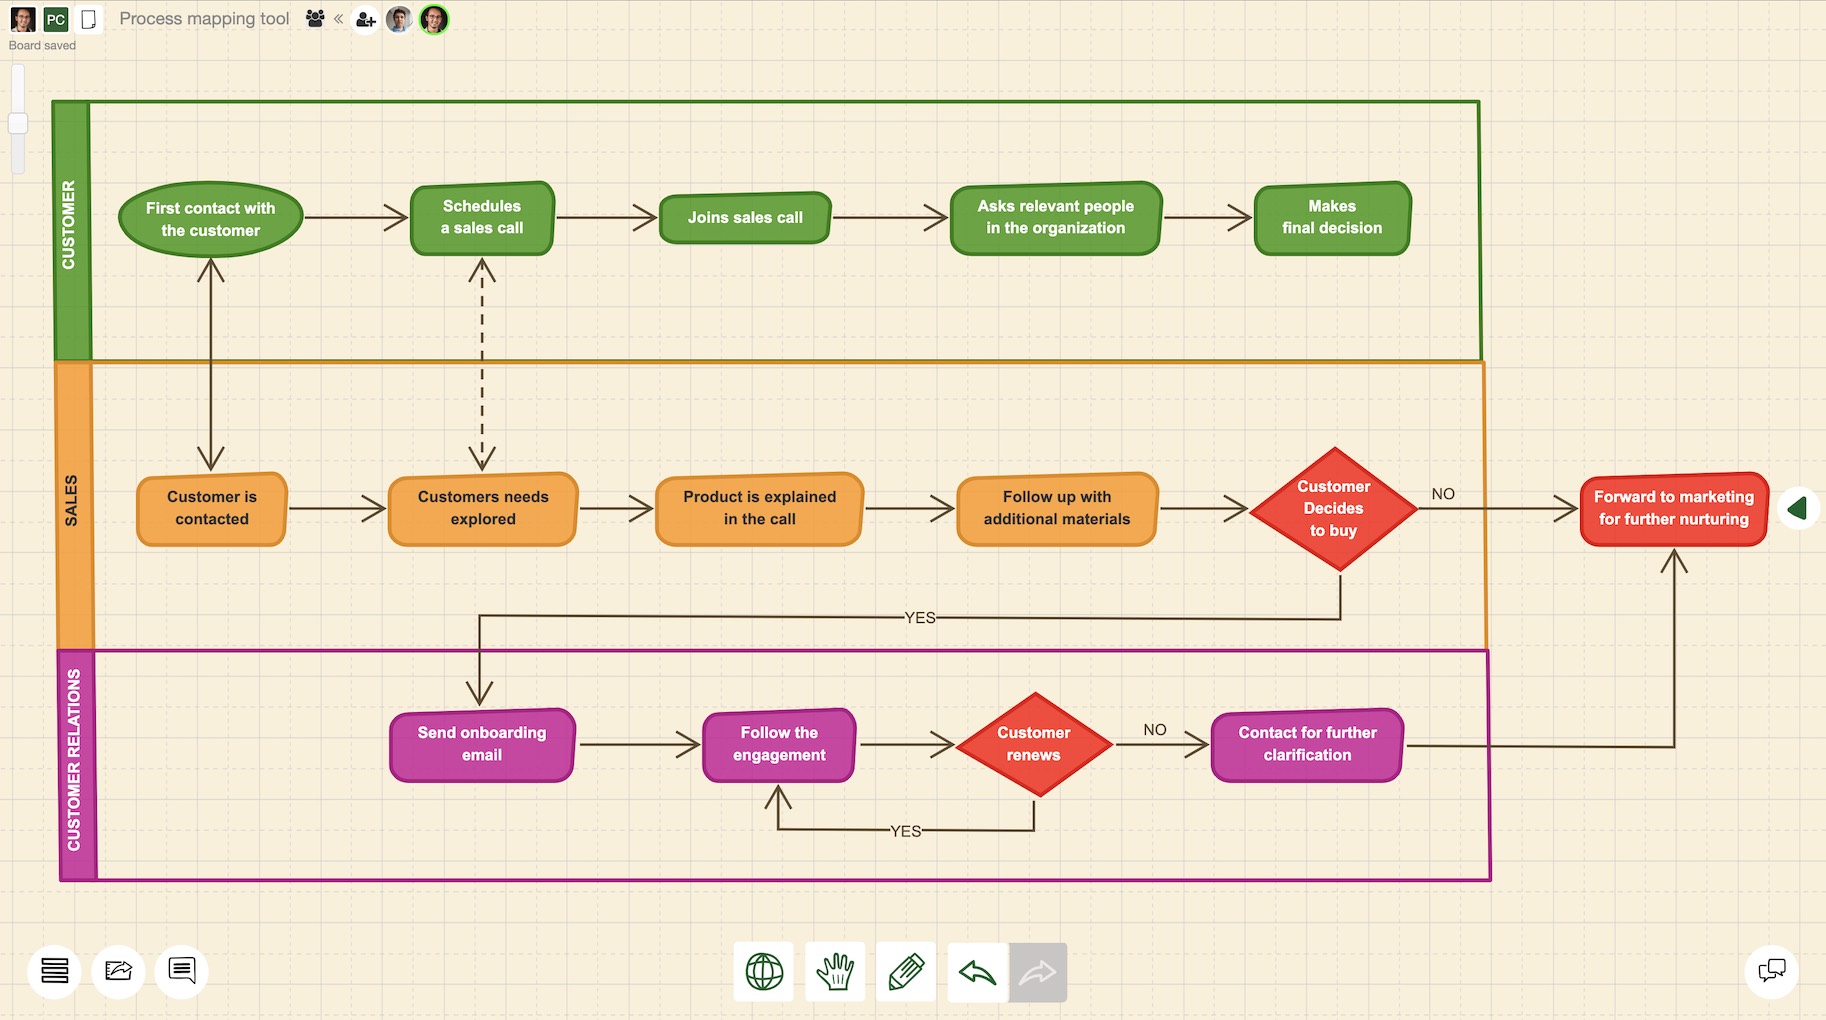
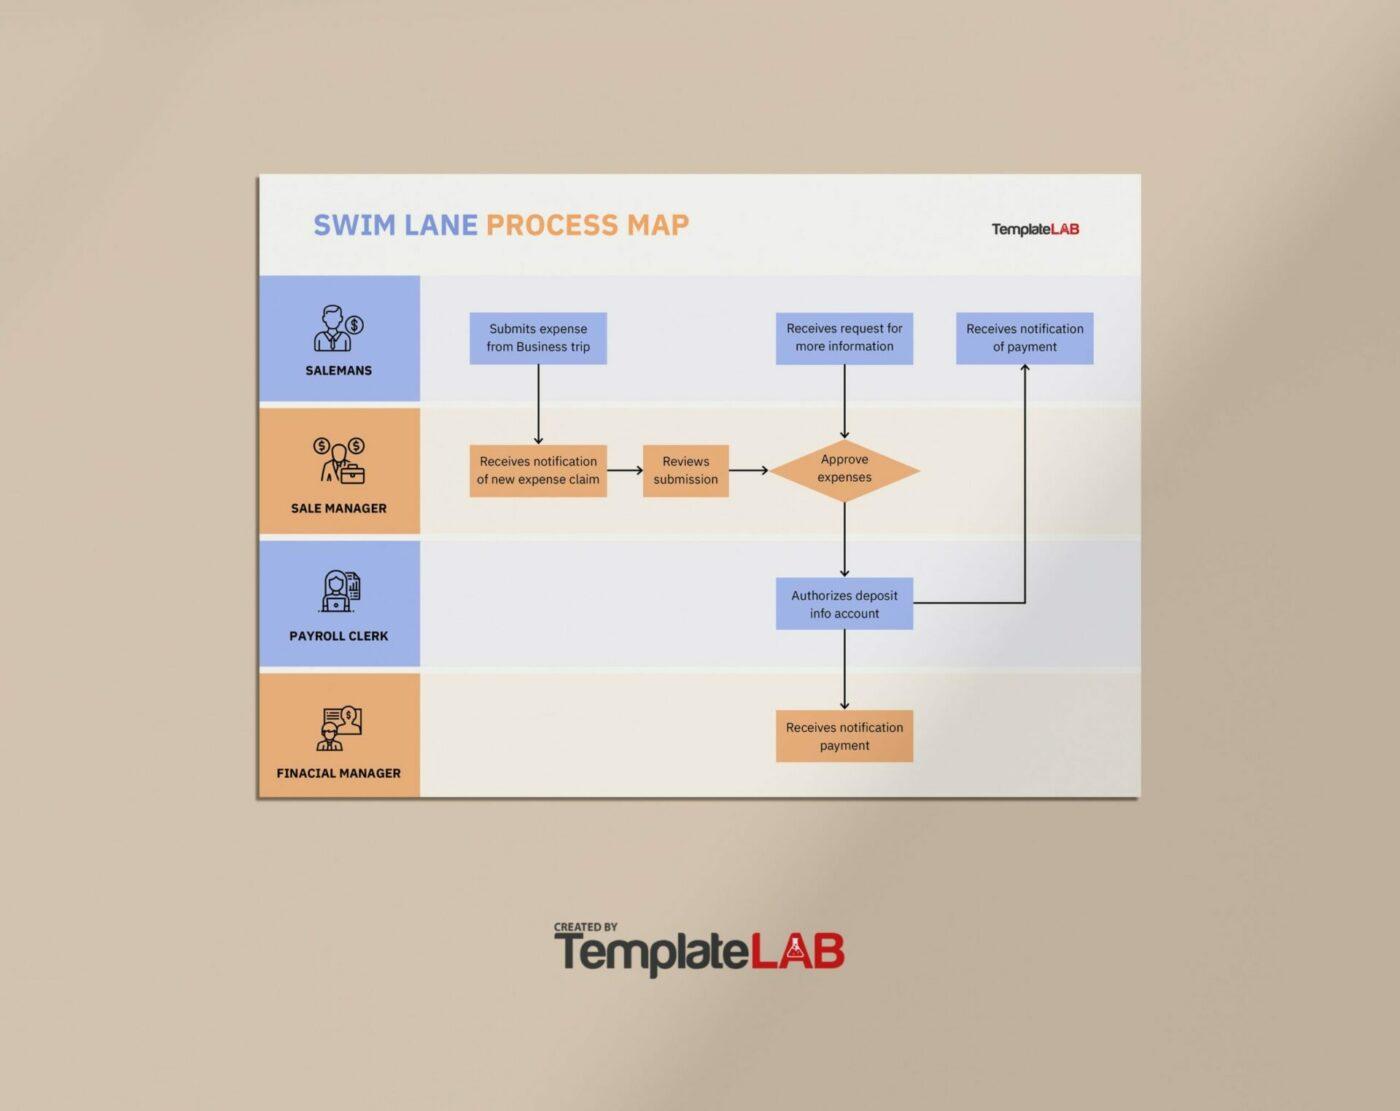
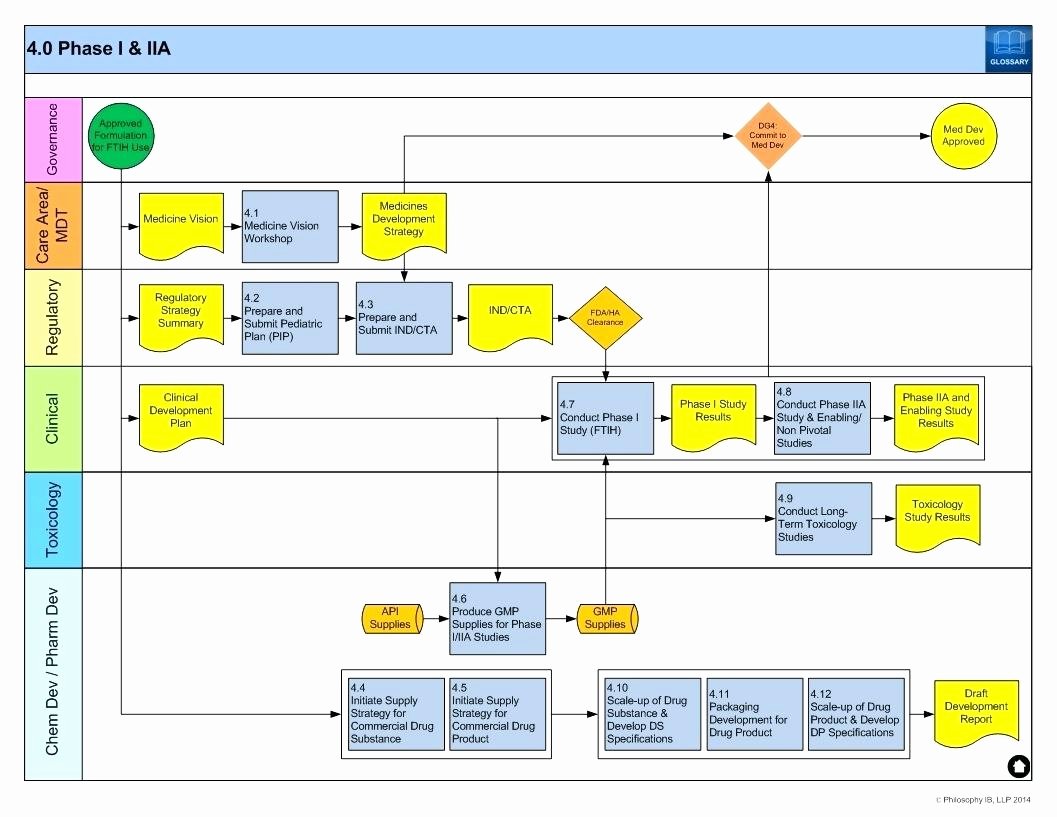
A high-level process map is a visual illustration that captures the essential milestones of a business process from start to finish without including granular technical details. Typically consisting of five to seven major steps, it provides stakeholders with a bird’s-eye view of how a value stream functions, identifying the primary inputs, outputs, and participants involved in achieving a specific organizational goal.
Understanding the Role of High-Level Process Maps in 2026
In the current business landscape of 2026, organizational complexity has reached a point where "information silos" are a primary threat to efficiency. A high-level process map (HLPM) serves as the fundamental corrective tool for this issue. Often referred to as a "Level 1" map, it sits at the top of the process hierarchy, providing the necessary context before teams dive into the "weeds" of Level 2 (operational) or Level 3 (task-level) documentation.
The primary objective of an HLPM is not to show how a specific task is performed, but rather to show what happens in the grand scheme of the business. By stripping away the noise of individual clicks, specific software instructions, and minor edge cases, the map allows executives, new hires, and cross-functional partners to understand the "macro" flow of value. This clarity is essential for strategic decision-making, as it highlights where different departments intersect and where handoffs occur—areas where most organizational friction is born.
The Essential Components of a High-Level Process Map
To be effective, an HLPM must remain concise while still being comprehensive enough to be accurate. In the professional standard for 2026, a high-level map generally adheres to the SIPOC model (Supplier, Input, Process, Output, Customer) or a simplified linear flow. Regardless of the specific framework used, every high-level process map must contain the following core elements:
1. Process Boundaries
Before a single box is drawn, the "Start" and "End" points must be strictly defined. Without these boundaries, "scope creep" occurs, and the map becomes cluttered with preceding or succeeding activities that belong to different processes. For example, in a "Customer Onboarding" map, the start might be "Contract Signed," and the end might be "First Successful Service Delivery."
2. Major Milestones (The "Process" Steps)
These are the 4–7 core blocks that represent the transformation of inputs into outputs. Each block should represent a significant phase. If you find yourself listing more than seven steps, you are likely shifting from a high-level map to a detailed operational map.
3. Primary Inputs and Outputs
High-level maps should identify what is required to trigger the process (Inputs) and what the final result is (Outputs). In 2026, these are often digital assets, data sets, or physical products. Identifying these helps in understanding the "dependencies" of the process.
4. Key Stakeholders or "Actors"
While detailed maps might list individual job titles, a high-level map usually identifies departments or broad roles (e.g., "Finance Department," "End User," "Logistics Provider"). This shows who is responsible for each major milestone.
Why Your Organization Needs High-Level Mapping
Many organizations make the mistake of jumping straight into detailed SOPs (Standard Operating Procedures) without first establishing a high-level framework. This leads to disconnected documentation that is difficult to maintain. The benefits of starting at the high level include:
- Strategic Alignment: It ensures that every team member understands how their specific work contributes to the ultimate goal of the organization. This is particularly vital in remote and hybrid work environments where local context is often lost.
- Gap Identification: When you look at a process from 30,000 feet, inefficiencies like redundant steps or "black holes" (where information goes in but nothing comes out) become glaringly obvious.
- Stakeholder Communication: Executives rarely have the time to review a 50-step flowchart. An HLPM provides them with the information they need to authorize resources or approve strategic changes without overwhelming them with data.
- Foundational Onboarding: For new employees, a high-level map serves as a mental "anchor." Once they understand the five major phases of their department’s work, learning the detailed sub-tasks becomes significantly easier.
High-Level vs. Detailed Process Maps: A Comparison
It is important to distinguish between the various "levels" of process documentation to ensure you are using the right tool for the right audience.
| Feature | High-Level Process Map (Level 1) | Detailed Process Map (Level 2/3) |
|---|---|---|
| Primary Audience | Executives, Stakeholders, New Hires | Front-line Workers, System Developers |
| Number of Steps | 4 to 7 major phases | 15 to 50+ granular steps |
| Level of Detail | Abstract; focuses on "What" | Specific; focuses on "How" |
| Key Components | Milestones, Departments, Major Outputs | Logic Gates, Individual Tasks, Tools used |
| Purpose | Strategy, Scope, and Communication | Training, Troubleshooting, and Automation |
| Time to Create | 1–3 hours (with the right people) | Days or weeks of observation |
How to Create a High-Level Process Map: A Step-by-Step Guide
Creating an HLPM is a collaborative exercise. It should never be done in a vacuum by a single analyst; instead, it requires the input of the people who actually own the process.
Step 1: Identify the Process and its Owner
Clearly name the process. Is it "Lead-to-Cash," "Order Fulfillment," or "Employee Offboarding"? Assign a single owner who is responsible for the accuracy of the map.
Step 2: Establish the "Trigger" and the "Goal"
What is the very first thing that happens to kick off this process? (e.g., A customer submits a support ticket). What is the final state that signifies completion? (e.g., The ticket is marked "Resolved" and the customer provides feedback). These are your bookends.
Step 3: Brainstorm the Major Steps
Gather key stakeholders and ask: "What are the five biggest things that happen between the start and the end?" At this stage, ignore the "what ifs" and the "sometimes" scenarios. Focus on the "happy path"—the way the process works 80% of the time under normal conditions.
Step 4: Sequence the Activities
Arrange the steps in chronological order. In 2026, most teams use collaborative digital whiteboarding tools to drag and drop these milestones until the flow makes sense to everyone in the room.
Step 5: Identify Handoffs
For each step, identify who is doing the work. If Step 2 is "Credit Check" (Finance) and Step 3 is "Inventory Allocation" (Warehouse), the line between them represents a handoff. These handoffs are the most common points of failure and should be clearly marked.
Step 6: Review and Validate
Walk through the map with someone who was not involved in the creation process. If they can understand the general flow of work within two minutes, the map is successful. If they have questions about specific details, you may have included too much or too little information.
Common Frameworks Used in High-Level Mapping
Depending on your industry and the specific goal of your mapping project, you might choose one of these standard frameworks:
SIPOC (Six Sigma Standard)
SIPOC is the gold standard for high-level mapping in manufacturing and disciplined service environments. It forces the team to look at the process as a sandwich:
- Suppliers: Who provides the information/materials?
- Inputs: What is provided?
- Process: The 5-step high-level flow.
- Outputs: What is produced?
- Customers: Who receives the output?
Value Stream Mapping (VSM) - High Level
While VSM can become very technical (including cycle times and wait times), a high-level VSM focuses exclusively on the flow of value to the customer. It is excellent for identifying "waste"—steps that don't actually add value to the final product.
Business Process Model and Notation (BPMN) Lite
BPMN is a standardized set of symbols. For high-level mapping, you use "BPMN Lite," which involves only circles (start/end), rectangles (tasks), and arrows (flow). This ensures that anyone globally, regardless of their language or background, can interpret the map.
Avoiding Common Pitfalls in Process Mapping
Even experienced managers often struggle to keep a process map truly "high-level." Avoid these common mistakes:
- Including Decision Diamonds: High-level maps should generally avoid complex "Yes/No" logic gates. If a decision significantly changes the entire path of the process, it might be worth showing, but usually, these belong in the Level 2 maps.
- Focusing on Exceptions: "But what if the customer doesn't have their ID?" This is a valid concern for a detailed SOP, but for a high-level map, it is a distraction. Document the standard path.
- Using Jargon: Because high-level maps are used for cross-departmental communication, they should use plain language. If the "Product" team uses an acronym that the "Sales" team doesn't know, the map fails as a communication tool.
- Ignoring the "As-Is" State: Organizations often map how they wish the process worked rather than how it actually works. A high-level map must reflect reality to be useful for improvement.
Digital Integration and the Future of Mapping in 2026
As of 2026, the static PDF process map is becoming obsolete. Modern organizations are utilizing "Living Maps" integrated with Process Mining software. These tools can automatically generate high-level maps by analyzing the "digital footprints" left in ERP (Enterprise Resource Planning) and CRM (Customer Relationship Management) systems.
However, even with AI-generated maps, the human element of the high-level process map explained here remains vital. AI can tell you what the data says is happening, but it cannot explain the strategic intent behind a process or the cultural nuances of a departmental handoff. The high-level map remains a "social contract" between departments, defining how they agree to work together to serve the customer.
Frequently Asked Questions
What is the difference between a process map and a flowchart?
While the terms are often used interchangeably, a flowchart is a general tool used to show any sequence of steps (including computer algorithms), whereas a process map is specifically designed to show a business workflow, including the inputs, outputs, and people involved. A high-level process map is a specific type of flowchart focused on macro-level business operations.
How many steps should a high-level process map have?
The industry standard is between four and seven steps. If you have fewer than four, the map is likely too vague to be useful. If you have more than seven, you are likely drifting into a Level 2 "Operational" map and risk losing the interest of your executive audience.
Who is responsible for creating the high-level process map?
The creation is usually facilitated by a Process Analyst or a Project Manager, but the content must come from the Process Owner (the executive or manager accountable for the process outcome) and Subject Matter Experts (SMEs) from the involved departments.
Does a high-level process map need to show software tools?
Generally, no. Mentioning specific software (e.g., "Enter data into Salesforce") is usually too granular for a Level 1 map. Instead, use broader terms like "Record Customer Information." This keeps the map relevant even if the organization switches software vendors.
When should a high-level process map be updated?
An HLPM should be reviewed annually or whenever there is a major strategic shift in the business model. Because it focuses on the "what" rather than the "how," it remains much more stable than detailed maps, which may need updates whenever a software interface changes.
Next Actions for Implementation
To begin implementing high-level process mapping in your organization, start with a single, critical value stream—such as your primary revenue-generating process. Schedule a 90-minute workshop with a representative from each department involved. Focus on identifying the five major milestones and the "Start/End" triggers. Once this "Level 1" map is validated and signed off by leadership, it can serve as the official framework for all subsequent detailed documentation and process improvement initiatives.