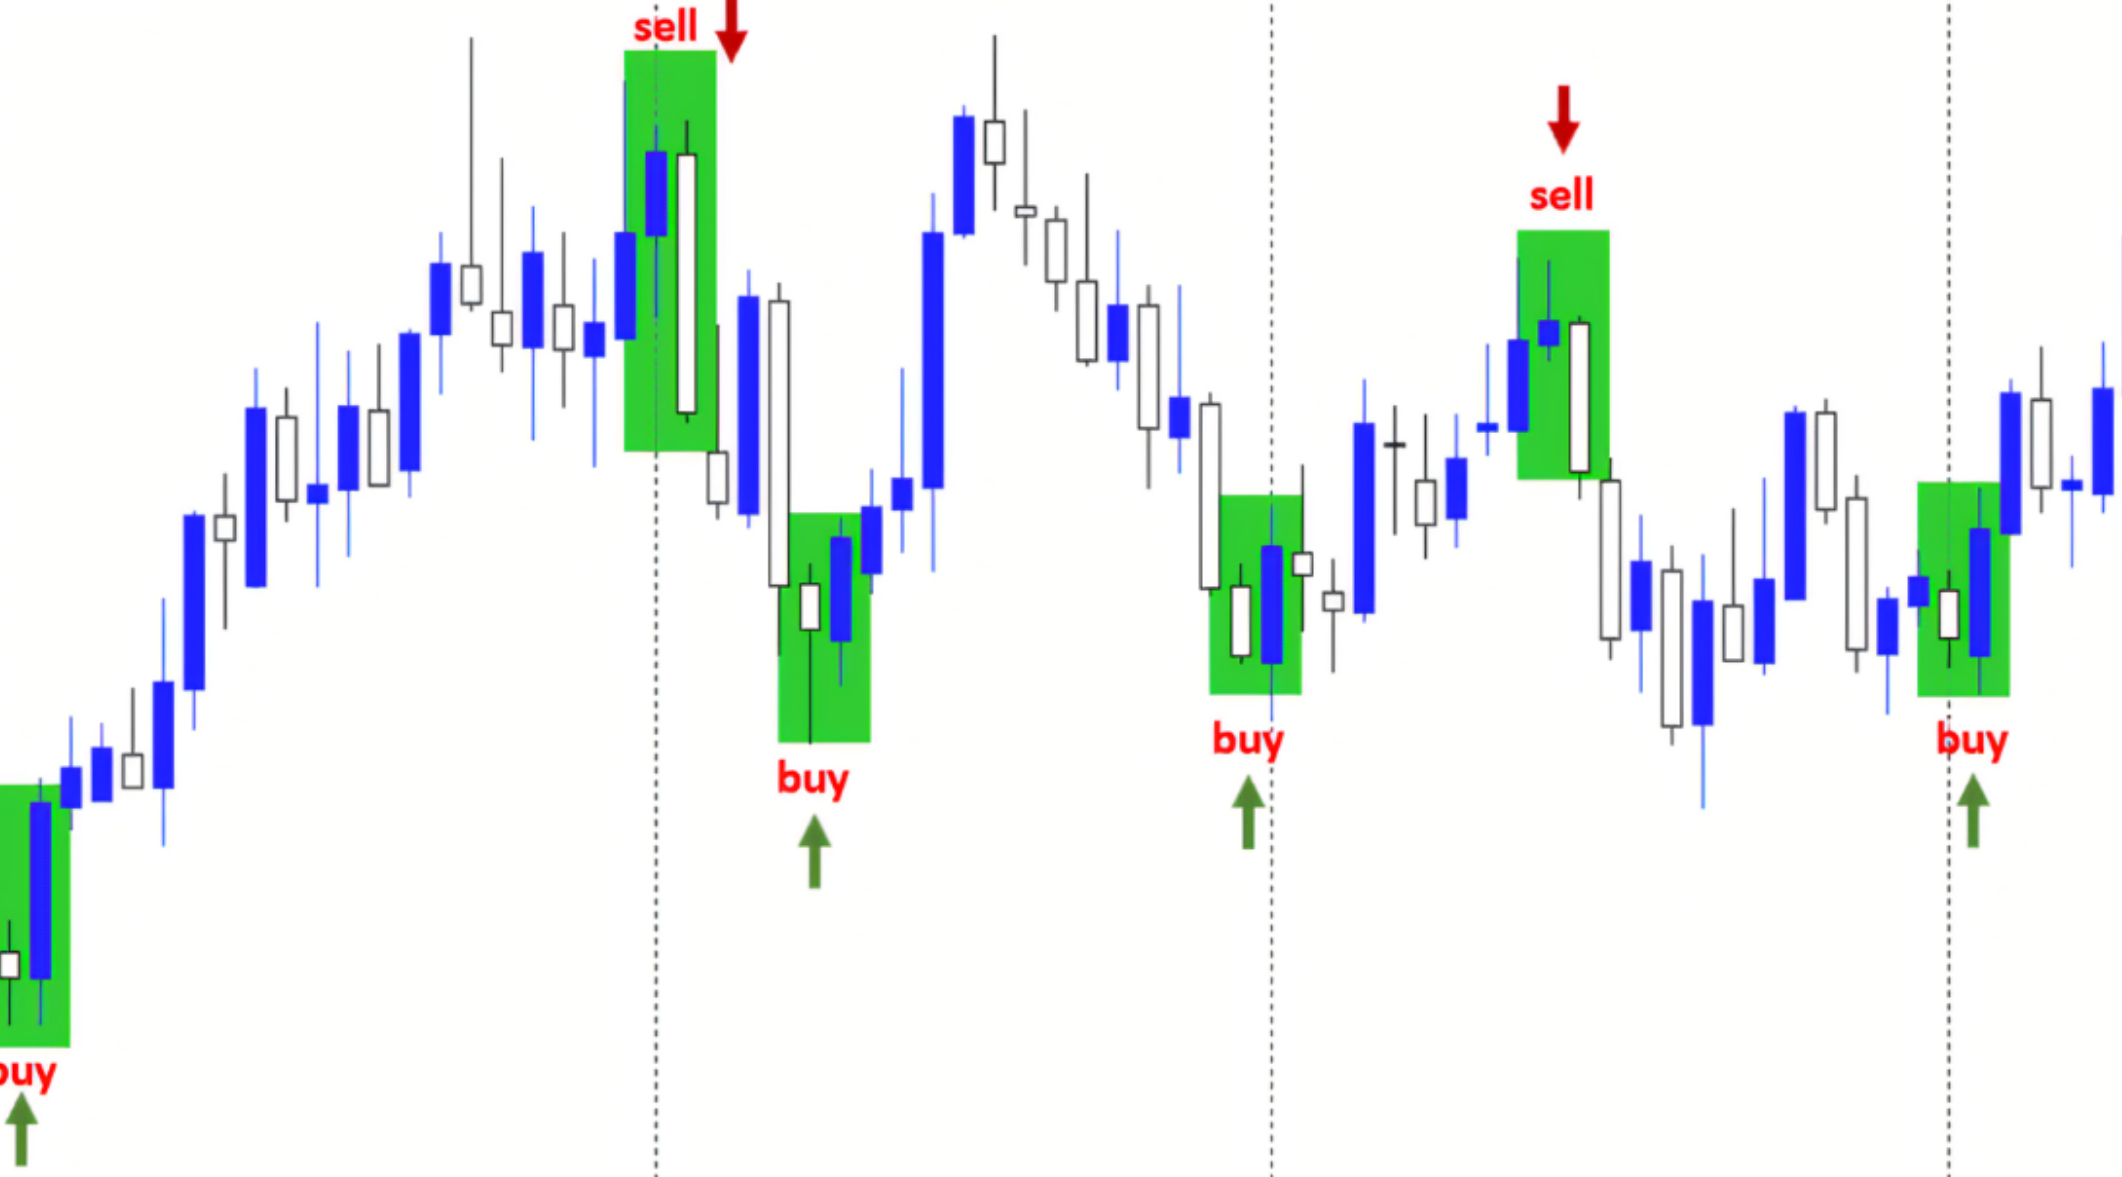
An MT4 candlestick pattern indicator is a specialized technical analysis tool that automatically scans price charts to identify, label, and alert traders to specific candlestick formations. By processing Open, High, Low, and Close (OHLC) data in real-time, it eliminates the need for manual chart monitoring, allowing traders to detect high-probability reversal and continuation signals across multiple timeframes simultaneously.
Understanding the Role of Candlestick Indicators in MetaTrader 4
In the trading landscape of 2026, MetaTrader 4 (MT4) remains a cornerstone for retail forex and CFD traders. Despite the emergence of newer platforms, the ecosystem of custom MQL4 indicators is unparalleled. A candlestick pattern indicator serves as a bridge between traditional Japanese candlestick theory and modern algorithmic efficiency. Instead of a trader spending hours scanning the M15, H1, and D1 charts for a "Morning Star" or an "Engulfing" pattern, the indicator performs this task programmatically.
The indicator functions by applying strict mathematical rules to price action. For instance, to identify a Bullish Engulfing pattern, the code verifies that the current candle's body completely overlaps the previous candle's body and that the current candle closes higher than it opened. This automation ensures that patterns are identified objectively, removing the psychological bias or "wishful thinking" that often plagues manual chart analysis.
The Evolution of Price Action Tools
Candlestick charting dates back to 18th-century Japanese rice traders, but its integration into MT4 has evolved significantly. By 2026, these indicators have become more sophisticated, often featuring "filter" settings that allow traders to ignore patterns that occur in low-volatility environments. This technical depth is crucial because a candlestick pattern in isolation is rarely a sufficient trade signal; its validity is heavily dependent on the surrounding market context, such as support and resistance levels.
Technical Specifications and Functional Mechanics
To effectively utilize an MT4 candlestick pattern indicator, one must understand the underlying logic that drives its alerts. Most high-quality versions of these indicators allow for the customization of the "detection sensitivity." This involves calculating the ratio of the candle body to its wicks (shadows).
Detection Logic and OHLC Data
The indicator utilizes the iClose(), iOpen(), iHigh(), and iLow() functions within the MQL4 language. For a Pin Bar (or Hammer) to be identified, the indicator typically checks if:
- The total range of the candle (High minus Low) is at least two or three times the size of the body.
- The body is located at one end of the candle range.
- The "nose" or the wick on the opposite side of the main tail is very small or non-existent.
By 2026, advanced versions also include volume spread analysis (VSA) components, checking if the identified pattern occurred on rising or falling tick volume, which adds a layer of confirmation regarding the strength of the move.
Visual Interface and User Experience
Upon installation, the indicator overlays text labels or icons directly onto the MT4 terminal. Most versions use a color-coded system:
- Blue/Green Labels: Indicate bullish reversal patterns (e.g., Piercing Line, Bullish Harami).
- Red/Orange Labels: Indicate bearish reversal patterns (e.g., Shooting Star, Dark Cloud Cover).
- Neutral Labels: Indicate indecision patterns like a Doji or Spinning Top.
Key Candlestick Patterns Detected
A robust indicator does not merely look for one pattern; it scans for an array of formations that represent shifts in market sentiment. Below is a breakdown of the primary patterns typically included in a comprehensive MT4 overview.
Reversal Patterns
Reversal patterns suggest that the current trend is losing momentum and a change in direction is imminent. The indicator looks for these at the extremities of price moves.
- The Hammer and Hanging Man: These are single-candle patterns with long lower or upper shadows. They represent a rejection of a specific price level.
- Engulfing Patterns: These involve two candles where the second candle's body completely "swallows" the first. In 2026, professional traders use these primarily to confirm entries at established demand or supply zones.
- Morning and Evening Stars: These are three-candle patterns. They are highly regarded for their reliability, as they show a clear transition from selling pressure to indecision, and finally to buying pressure (or vice versa).
Continuation Patterns
Continuation patterns suggest that the market is taking a brief pause before resuming its prior trend.
- Rising and Falling Three Methods: These are complex five-candle patterns that signify a temporary consolidation within a strong trend.
- Marubozu: A candle with no wicks, indicating that one side (bulls or bears) maintained total control from the open to the close.
Comparative Overview of Common Candlestick Formations
The following table summarizes the most common patterns identified by MT4 indicators and their typical market implications.
| Pattern Name | Number of Candles | Trend Sentiment | Reliability Rating | Typical Interpretation |
|---|---|---|---|---|
| Doji | 1 | Neutral/Indecision | Moderate | Represents a standoff between buyers and sellers; often precedes a reversal. |
| Bullish Engulfing | 2 | Bullish Reversal | High | Sellers were active but were completely overwhelmed by buyers by the period's end. |
| Shooting Star | 1 | Bearish Reversal | High | Price rose significantly but was pushed back down, showing strong resistance. |
| Morning Star | 3 | Bullish Reversal | Very High | A classic bottoming pattern showing a transition from bearish to bullish control. |
| Tweezer Tops | 2 | Bearish Reversal | Moderate | Two candles with identical highs, indicating a firm "ceiling" in the market. |
| Hammer | 1 | Bullish Reversal | High | Price dipped significantly but buyers stepped in to close the price near the high. |
Installation and Configuration Requirements
To use a candlestick pattern indicator in MT4 as of 2026, users must follow a specific set of technical steps to ensure the software integrates correctly with the terminal's data feed.
Step-by-Step Installation
- Download the .ex4 or .mq4 file: Ensure the source is reputable to avoid malware.
- Open the Data Folder: In MT4, navigate to
File>Open Data Folder. - Navigate to Indicators: Go to
MQL4>Indicators. - Paste the File: Move your downloaded indicator file into this folder.
- Restart or Refresh: Right-click "Indicators" in the MT4 Navigator window and select "Refresh" or restart the platform.
- Apply to Chart: Drag the indicator from the Navigator onto an active price chart.
Configuration Best Practices
Once applied, a "Settings" or "Inputs" window will appear. For optimal performance in 2026 market conditions, consider the following adjustments:
- Show Patterns (True/False): Most indicators allow you to toggle specific patterns off. It is often beneficial to turn off low-reliability patterns like the "Long Legged Doji" to reduce chart clutter.
- Alert Settings: Enable "Pop-up Alerts" and "Email/Push Notifications." This allows you to monitor the market without being tethered to your desk, as the MT4 mobile app can receive these push notifications instantly.
- Timeframe Filtering: Ensure the indicator is set to scan only the timeframes relevant to your strategy. Day traders typically focus on M15 through H1, while swing traders should prioritize H4 and D1.
Integrating the Indicator into a Trading Strategy
A common mistake among novice traders is treating a candlestick pattern label as an immediate "Buy" or "Sell" order. Professional technical analysis in 2026 emphasizes confluence—the meeting of multiple independent signals.
Combining with Support and Resistance
The indicator's value increases exponentially when a pattern occurs at a key price level. For example, a Hammer identified in the middle of a range is often "noise." However, a Hammer identified exactly at a multi-month support level is a high-conviction signal. Traders should use horizontal line tools or Fibonacci retracement levels to verify the location of the pattern.
Using Momentum Oscillators
To filter out false signals, many traders pair the candlestick indicator with an oscillator like the Relative Strength Index (RSI) or Stochastic Oscillator. If the indicator signals a Bullish Engulfing pattern while the RSI is in "Oversold" territory (below 30), the probability of a successful trade is statistically higher.
Managing Risk and Stop Losses
Candlestick patterns provide natural levels for stop-loss placement. When trading a reversal pattern like a Shooting Star, the stop loss is typically placed 2-5 pips above the high of the wick. The indicator helps quantify this risk instantly by visually marking the "extreme" of the pattern.
Troubleshooting Common Issues
Even in 2026, technical glitches can occur within the MT4 environment. Understanding how to resolve these ensures consistent market coverage.
- Indicator Not Loading: This is often due to a "DLL Imports" restriction. Go to
Tools>Options>Expert Advisorsand ensure "Allow DLL imports" is checked. Some advanced indicators require this to fetch external data or send advanced notifications. - Missing Labels on History: Many indicators limit the number of "bars back" they scan to preserve CPU resources. If you cannot see patterns on historical data, check the input setting for
MaxBarsorLimitand increase the value. - Repainting Issues: "Repainting" occurs when an indicator changes its signal after the candle has closed. A reliable candlestick indicator should not repaint. It should only confirm a pattern once the specific candle period has ended and the OHLC data is finalized. If your labels disappear or move, the indicator's logic is flawed, and it should be replaced.
Frequently Asked Questions
Can I use the MT4 candlestick pattern indicator for crypto trading?
Yes, as long as your MT4 broker provides cryptocurrency pairs (like BTC/USD or ETH/USD), the indicator will function. Candlestick psychology—representing the battle between buyers and sellers—is universal across all liquid markets, including crypto, forex, and equities.
Which timeframe is most accurate for these patterns?
Generally, higher timeframes like the Daily (D1) or 4-Hour (H4) are more reliable. Patterns on the 1-Minute (M1) or 5-Minute (M5) charts are often the result of market "noise" and high-frequency trading algorithms rather than a meaningful shift in institutional sentiment.
Does the indicator predict the future price?
No indicator can predict the future. A candlestick pattern indicator identifies historical price behavior that has a statistical edge of leading to a specific outcome. It tells you what is happening now based on what has happened in the immediate past.
Can I use multiple candlestick indicators at once?
While possible, it is not recommended. Different indicators may use slightly different mathematical thresholds for a "Hammer" or "Doji," leading to conflicting labels on your chart. It is better to find one high-quality, comprehensive indicator and learn its specific nuances.
Is there a performance hit to my computer?
MetaTrader 4 is a single-threaded application. If you apply a complex indicator that scans 50+ patterns across 20 different open charts, you may experience "terminal lag." To prevent this, limit the MaxBars setting to 500 or 1,000 and only keep necessary charts open.
Practical Recommendation for Traders
For traders looking to integrate an MT4 candlestick pattern indicator into their workflow in 2026, the best approach is systematic validation. Do not immediately trade live with the indicator. Instead, apply it to a demo account and observe how the patterns develop in real-time. Focus specifically on "rejection" candles at the edges of Bollinger Bands or during the retest of a broken trendline. By treating the indicator as a "notification system" rather than a "decision-maker," you can leverage automation to reduce screen time while maintaining the high standards required for professional price action trading.