The S&P 500 dividend history reveals a long-term pattern of aggregate payout growth punctuated by sharp, temporary contractions during severe economic recessions. While individual companies frequently alter or eliminate their distributions, the broad index has historically shown remarkable resilience, serving as a foundational benchmark for income-seeking equity investors worldwide.
Evaluating the historical trajectory of payouts within the Standard & Poor's 500 requires looking past short-term market noise to examine structural shifts in corporate finance, payout ratios, and macroeconomic conditions. Since its modern inception in 1957—and when back-tested through predecessor indices into the late 19th and early 20th centuries—the S&P 500 has evolved from a high-yield, slow-growth market into a hybrid instrument combining moderate dividend income with significant capital appreciation. Understanding this history helps investors contextualize current yields, evaluate risk, and construct realistic portfolios for long-term wealth accumulation and income generation.
Foundational Concepts: What Drives S&P 500 Dividends?
To analyze the dividend history of the S&P 500 accurately, one must first understand how distributions are calculated, weighted, and sustained at the index level. The S&P 500 is a float-adjusted, market-capitalization-weighted index comprising 500 of the largest publicly traded companies in the United States. Consequently, its aggregate dividend payments do not represent a simple average of what member firms pay. Instead, they reflect a capitalization-weighted sum where mega-cap corporations exert a massive influence on total payouts.
A corporation initiates, maintains, or grows its dividend based on free cash flow generation, capital allocation strategies, and board-level confidence in future earnings stability. Unlike bond coupons, equity distributions are never guaranteed. When corporate earnings contract—such as during the 2008 global financial crisis or the 2020 pandemic-induced downturn—corporate boards face intense pressure to preserve liquidity. This dynamic causes aggregate index dividends to decline during systemic shocks, even though many resilient companies manage to maintain or increase their payouts.
Furthermore, investors must distinguish between dividend yield and dividend growth. The dividend yield represents the annual payout divided by the current share price, fluctuating inversely with market prices. Dividend growth measures the actual nominal increase in cash distributed per share over time. A falling index yield does not necessarily mean companies are cutting payouts; it often indicates that stock prices are rising faster than dividend disbursements.
Historical Evolution of S&P 500 Payouts (1926–Present)
The history of U.S. stock market distributions can be divided into distinct eras defined by interest rate regimes, tax policy changes, and prevailing corporate governance philosophies. Long-term datasets maintained by financial researchers show that prior to the mid-20th century, common stocks typically offered dividend yields that significantly exceeded high-grade corporate bond yields. During this era, equities were viewed primarily as income-producing instruments rather than growth vehicles.
The Mid-20th Century High-Yield Era
From the post-World War II expansion through the inflationary turbulence of the 1970s and early 1980s, S&P 500 dividend yields routinely hovered between 3% and 6%. Inflationary pressures and volatile economic growth forced companies to offer high cash returns to attract risk-averse capital. However, as interest rates climbed to historic peaks in the early 1980s, fixed-income alternatives became increasingly attractive, altering the competitive landscape for investor capital.
The Share Buyback Revolution and 1990s Compression
A major structural turning point occurred in the 1980s and accelerated through the 1990s, catalyzed by regulatory changes under SEC Rule 10b-18, which provided safe harbor rules for open-market share repurchases. Corporate executives increasingly viewed buybacks as a more tax-efficient and flexible method of returning capital to shareholders compared to sticky, mandatory cash dividends.
If a company experiences a temporary earnings slump, it can easily halt share buybacks without triggering the negative market signal associated with a dividend cut. Consequently, throughout the 1990s dot-com boom, aggregate S&P 500 dividend yields compressed sharply, falling below 2% as many high-flying technology firms paid no dividends at all, reinvesting every dollar into aggressive expansion.
The 2000s and 2010s: Crises and Recovery
The turn of the 21st century tested the stability of index distributions. The bursting of the technology bubble in 2000 and the devastating financial crisis of 2008–2009 forced widespread distribution cuts, particularly among systemically important financial institutions. During the 2008 financial crisis, aggregate S&P 500 dividends fell by over 20% from peak to trough as banks and automakers slashed payouts to shore up capital reserves.
However, the subsequent post-crisis expansion demonstrated the cyclical recovery power of the index. Bolstered by low interest rates, stringent balance sheet management, and massive cash reserves in the technology, healthcare, and financial sectors, total dollar dividends paid by S&P 500 companies rebounded strongly, reaching all-time nominal highs by the mid-2010s.
Key Eras and Structural Shifts in S&P 500 Dividends
| Era / Timeframe | Average Dividend Yield | Dominant Capital Allocation Trend | Major Market Catalyst |
|---|---|---|---|
| 1950s – 1970s | 3.5% – 6.0% | High cash payouts; primary focus on income | Post-war economic expansion and stable industrial growth |
| 1980s – 1990s | 2.0% – 4.5% | Emergence of share buybacks; declining relative yields | SEC Rule 10b-18 implementation and bull market expansion |
| 2000s – 2010s | 1.5% – 2.5% | Payout contractions followed by aggressive recovery | Tech bubble crash and the 2008 global financial crisis |
| 2020 – Present | 1.3% – 1.8% | Hybrid return models (dividends plus large-scale buybacks) | Low interest rate regimes, pandemic recovery, and mega-cap tech dominance |
The Role of Sector Concentration in Modern Index Yields
Evaluating contemporary S&P 500 dividend history requires analyzing sector-level contributions. The aggregate yield of the index is heavily skewed by a handful of heavy-payout sectors, offset by mega-cap technology and communication services firms that historically favor reinvestment or buybacks over cash distributions.
Financials, utilities, consumer staples, and energy companies have traditionally served as the primary engines of S&P 500 dividend income. Utilities and consumer staples feature defensive business models with predictable cash flows, allowing them to maintain uninterrupted distributions across various economic cycles. Conversely, the energy sector exhibits high cyclicality; when commodity prices surge, energy firms generate extraordinary free cash flow, frequently distributing special dividends that temporarily lift the aggregate yield of the broader index.
In contrast, the massive market capitalization weighting of information technology means that sector-specific decisions drastically impact total index payouts. While dominant technology firms have initiated or steadily grown their cash disbursements in recent years, their aggregate yield remains low relative to their market value. This structural reality explains why the overall S&P 500 dividend yield in the 2020s (typically ranging between 1.3% and 1.8%) sits significantly below its historical long-term average of roughly 4%.
Total Return Perspective: Dividends vs. Capital Appreciation
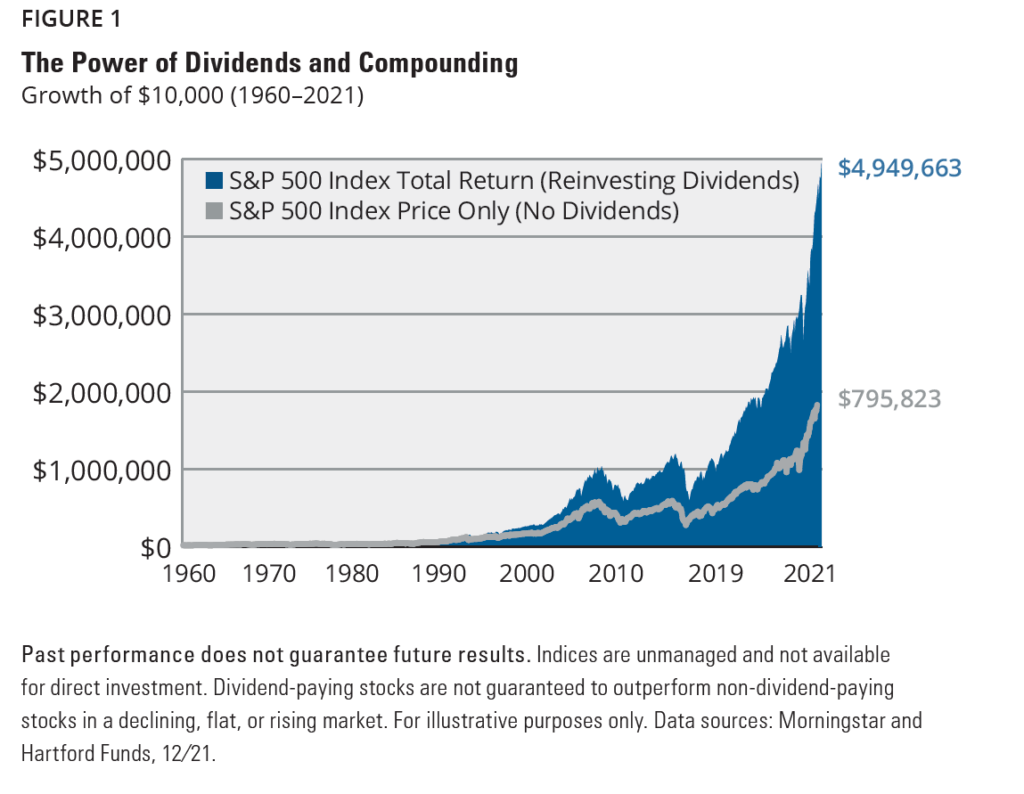
Any historical overview of S&P 500 dividends remains incomplete without examining the mathematical impact of dividend reinvestment on total wealth accumulation. Academic studies and historical market tracking demonstrate that reinvested dividends account for a substantial portion of long-term equity returns.
When an investor purchases an index fund or exchange-traded fund (ETF) tracking the S&P 500 and elects to automatically reinvest quarterly distributions, those cash payments purchase additional shares or fractional shares. During prolonged bear markets or sideways trading ranges—such as the structural stagnation periods of the 1970s or the 2000-to-2013 flat market—reinvested dividends acquire equities at lower valuations, effectively lowering the average cost basis and compounding share accumulation. Over multi-decade investment horizons, this compounding mechanism dramatically outperforms price-only index appreciation.
Common Misconceptions About S&P 500 Dividends
Investors frequently approach index dividends with outdated assumptions or behavioral biases that can impair portfolio performance. Recognizing these pitfalls is essential for sound financial planning.
- Myth: A high index yield guarantees superior total returns. In reality, high-yielding subsets of the market often lag during secular bull markets driven by high-growth, low-yield innovators. Total return—price appreciation plus dividends—is the ultimate metric of performance.
- Myth: Index dividends are fixed income substitutes. Because aggregate S&P 500 payouts decline during major economic crises, equity income lacks the contractual certainty and principal protection of U.S. Treasury bonds or investment-grade corporate debt.
- Myth: Companies that do not pay dividends are poor investments. Many hyper-growth firms generate superior shareholder value by retaining earnings to fund high-return internal projects or strategic acquisitions rather than distributing cash subject to immediate personal taxation.
Frequently Asked Questions
What is the historical average dividend yield of the S&P 500?
Over the long term spanning from the mid-20th century to the present, the historical average dividend yield of the S&P 500 has been approximately 4%. However, structural changes in corporate finance—specifically the proliferation of share buybacks and the rise of low-yielding, high-growth technology giants—have compressed the average yield to a range of 1.3% to 1.8% in recent decades.
Do S&P 500 companies cut their dividends during recessions?
Yes. While the aggregate index has a long-term history of growing dividend payments, individual member companies frequently reduce or eliminate distributions during severe economic contractions. During the 2008 global financial crisis and the 2020 economic shutdowns, aggregate index payouts experienced sharp, double-digit percentage drops as financial institutions and cyclical firms preserved liquidity.
How do share buybacks affect S&P 500 dividends?
Share buybacks serve as an alternative method for corporations to return capital to shareholders. When a company repurchases its own stock, it reduces the total share count, which mathematically increases earnings per share and can support higher future cash dividends per share. However, because buybacks do not put cash directly into the investor's brokerage account unless shares are sold, they complement rather than replace traditional cash distributions.
Why do some S&P 500 companies pay no dividends?
Many younger or hyper-growth companies within the S&P 500 choose to retain all earnings to reinvest in research, development, capital expenditures, or strategic acquisitions. Management teams often conclude that shareholders benefit more from long-term capital appreciation driven by internal reinvestment than from immediate cash payouts that may trigger tax liabilities.
How important are reinvested dividends to long-term stock performance?
Reinvested dividends are a primary driver of long-term equity wealth accumulation. Historical data shows that over multi-decade periods, reinvested dividends account for roughly 40% to 50% of the total nominal return generated by the S&P 500, significantly boosting performance through the compounding effect of purchasing additional shares over time.
Practical Recommendations for Income Investors
Investors utilizing S&P 500 vehicles for cash flow generation or wealth compounding should maintain a long-term perspective and account for macroeconomic volatility. Because aggregate payouts fluctuate with corporate earnings and economic cycles, investors relying strictly on index income for living expenses should maintain adequate cash buffers to weather periodic downturns without forced selling. Furthermore, tax implications—such as the distinction between qualified dividend tax rates and ordinary income—should be carefully reviewed with a qualified financial or tax professional before executing major portfolio reallocations.